Resource Management
Contents
Webinar (12/2023)
Overview
What is the global level of Resource management
How to define the displayed time period on the global level
Resource Dashboard
What is the project level of Resource management
How to set up permissions for Resource management
How to set up default filters for Resource management
How to display tasks of the workers in time with their total workload
How to work with daily/weekly/monthly view of planned workload
How to work with custom allocations
How to use the Balance feature
Global resource settings
How to work with competence planning by teams and task types
How to work with attendance records
How to work with task updates and assignment using a drag & drop feature
Integration with meeting calendar
How to use event/allocation tooltips
How to work with reservations
How to update tasks' timing (start date, due date, duration, completion)
How to work with step back button (Undo)
How to use Problems button
How to work with exporting options
How to add Resource management to your Dashboard
Resource Report
Tips and tricks
What are the corner situations
Overview
Resource management is a tool for professional planning and assignment of work in Easy Project. Managers plan work on projects with regard to real-time capacities of workers and estimated time for task realization. Resource management allows managers to balance the workload of the people while keeping schedules of the projects. You can easily look how are your people utilized in the future - whether and when they are overloaded or when they are available for unassigned tasks. Resource management is fully compliant with IPMA & PMI Project Management methodology standards.
Resource management is intended to be used mostly by:
- Project Managers
- Line Managers
- IT Managers
- Small Business Owners
- Project Portfolio Managers
- HR Managers
Why is Resource management important
Resource management is a key element to activity resource estimating and project human Resource management. Both are essential components of a comprehensive project management plan to execute and monitor a project successfully. As is the case with the larger discipline of project management, Resource management software tool helps automate and assist the process of resource allocation to projects and portfolio resource transparency including supply and demand of resources. The goal of the tool typically is to ensure that: (1) there are employees within our organization with required specific skill set and desired profile required for a project, (2) decide the number and skill sets of new employees to hire, and (3) allocate the workforce to various projects.
Resource management has an impact on schedules and budgets as well as resource leveling and smoothing. In order to effectively manage resources, organizations must have data on resource demands forecasted by time period into the future, the resource configurations that will be required to meet those demands and the supply of resources, again forecasted into the future. Forecasts should be as far out as is reasonable. Resource leveling, as it relates to inventory, is a Resource management technique aimed at keeping the stock of resources on hand level, reducing both excess inventories and shortages. In project management, resource leveling is scheduling decisions, which are driven by Resource management concerns, such as limited resource availability. As opposed to leveling, resource smoothing may not delay the project completion date, only particular activities within their float.
What are the main benefits of Resource management
- Increased revenue – Resource management will help you easily assess how well utilized your entire resource pool is on a daily, weekly or monthly basis, helping to ensure your most valuable resources are used to maximum effect, and your workload is balanced to avoid sustained periods of time on the bench.
- Conflict resolution – Resource conflicts can have a significant effect on revenue, at worst an unresolved resource conflict may result in an immediately missed revenue opportunity, along with a negative future impact on reduced customer satisfaction.
- Improve project delivery – Improving project delivery will help reduce costs and increase margins. Resource management enables resources to be allocated to work based on a number of specific criteria such as their availability, skills, and location so you will always be sure you have the right person allocated to the right job.
- Reduce administration costs – With a central, up to date view of your entire resource pool, you will reduce the administration costs associated with maintaining these out of date systems. What's more, you can improve revenue, maximize fee earning potential and nurture customer relationships. Only integrated Resource management software provides this visibility, control, and opportunity.
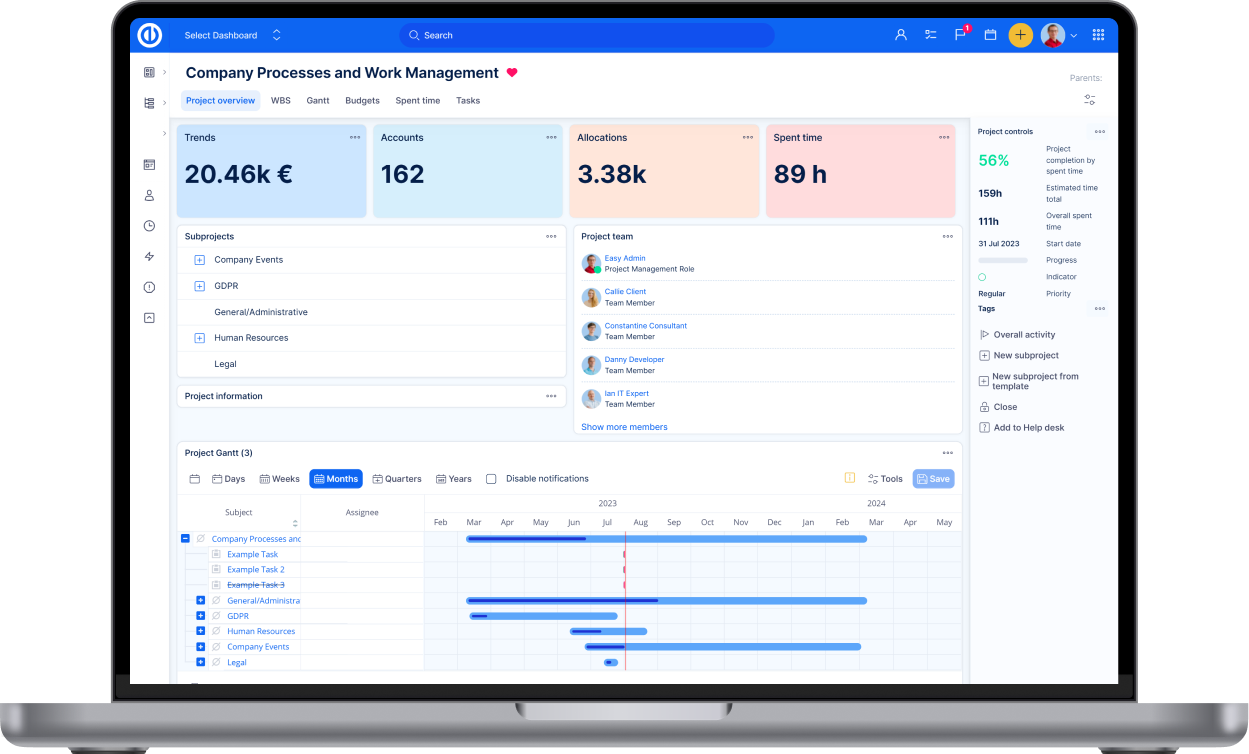
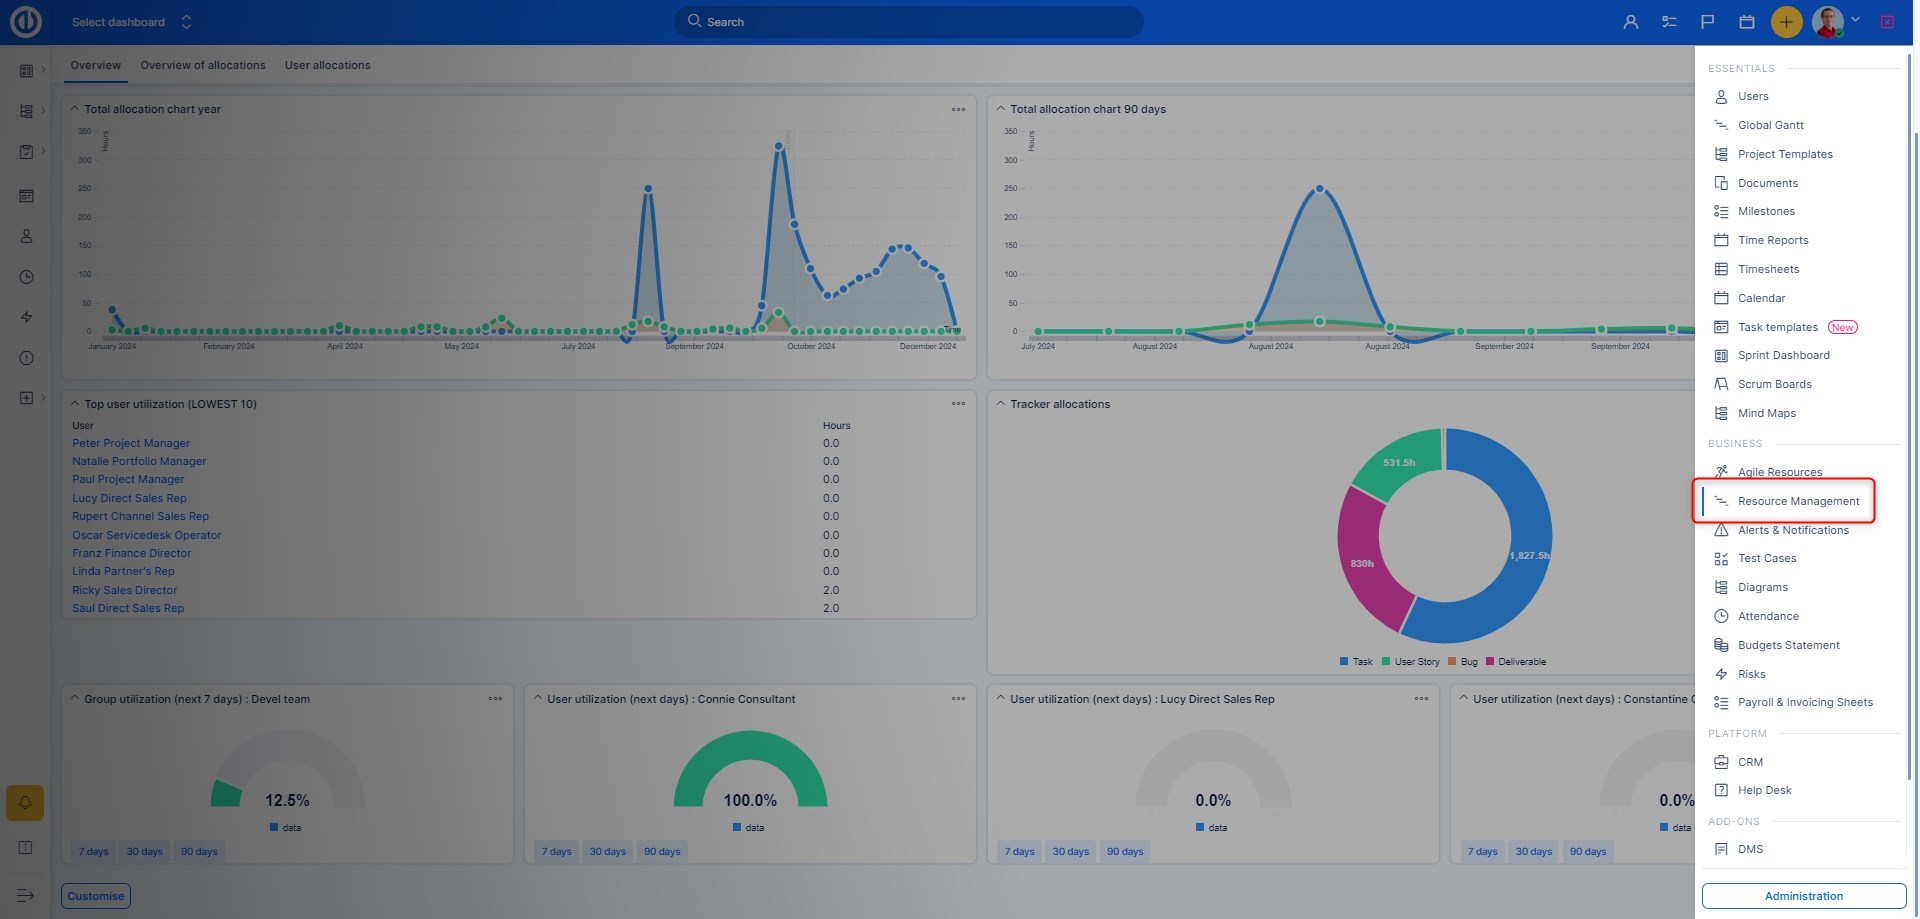
Global level of Resource management
Resource management is available both on the global level and the project level. To access it from the global level, go to Global menu >> Resource management or type "/easy_resource_dashboard" after your Easy Project domain address.
Resource Dashboard is the entryway into the RM module, we will describe the Dashboard and it feature in more detail in the following chapter
Resource management on the global level will most suit the users who need to have an overview of all available resources throughout Easy Project as well as all unassigned tasks on a single screen. The main advantage is, therefore, the unnecessity to switch between individual projects including their members and tasks when needed to manage resources for more projects at once. On the other hand, a certain disadvantage may be the complexity that may act to the detriment of clarity and speed so it's recommended to use the global view only when necessary.
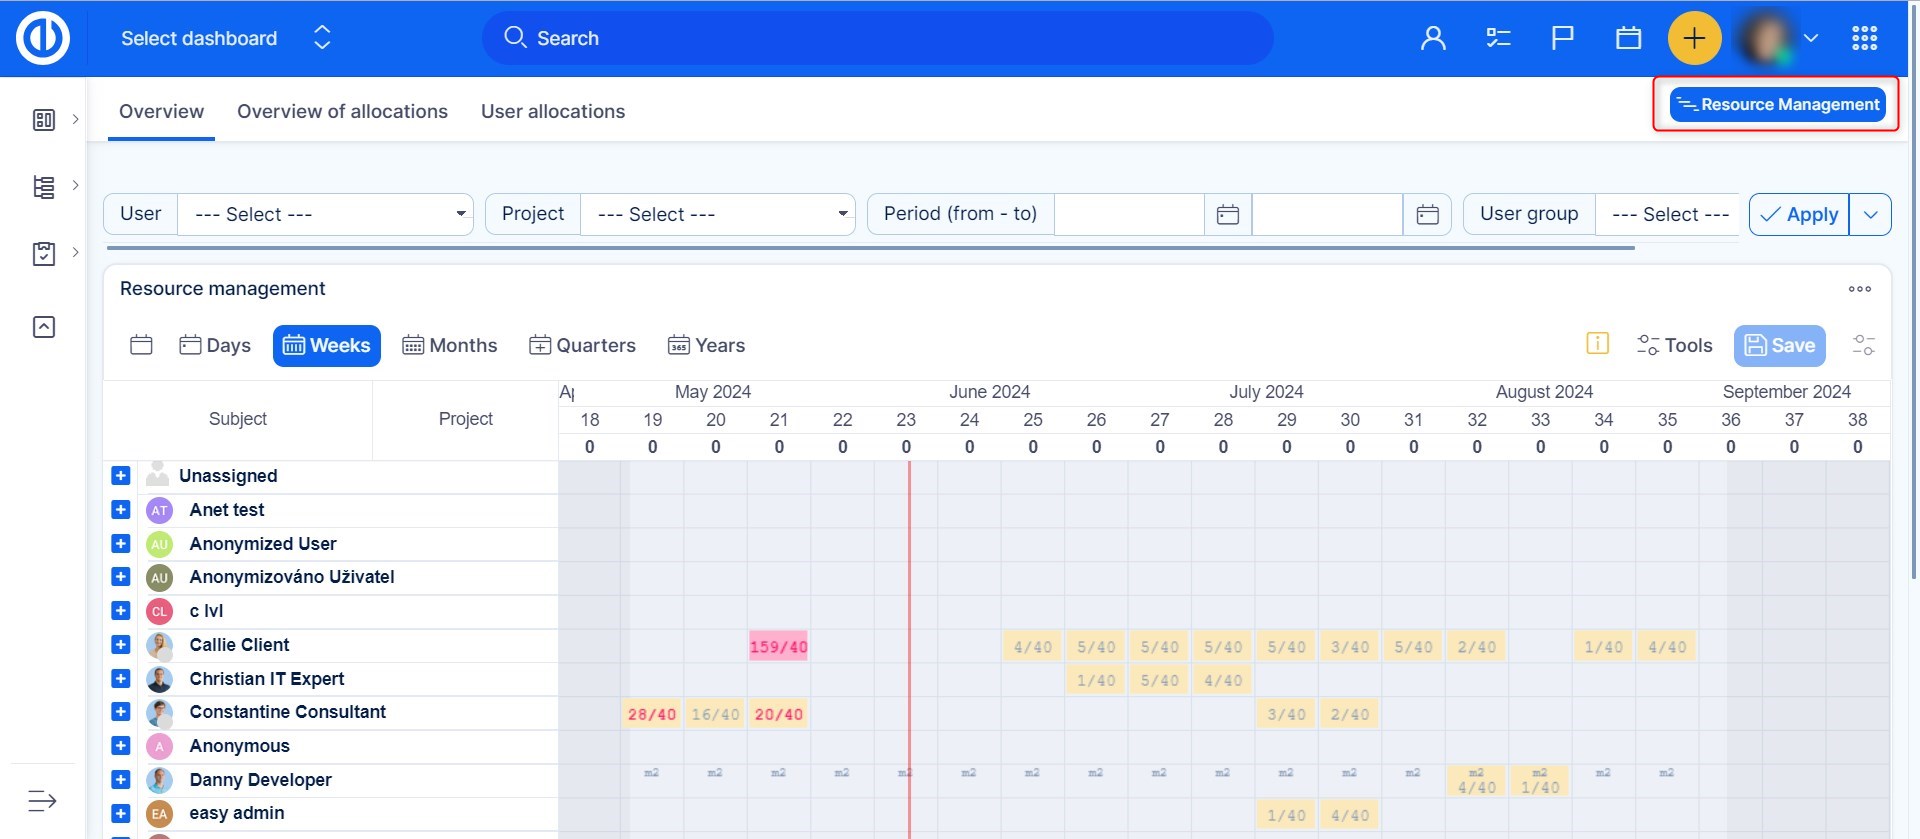
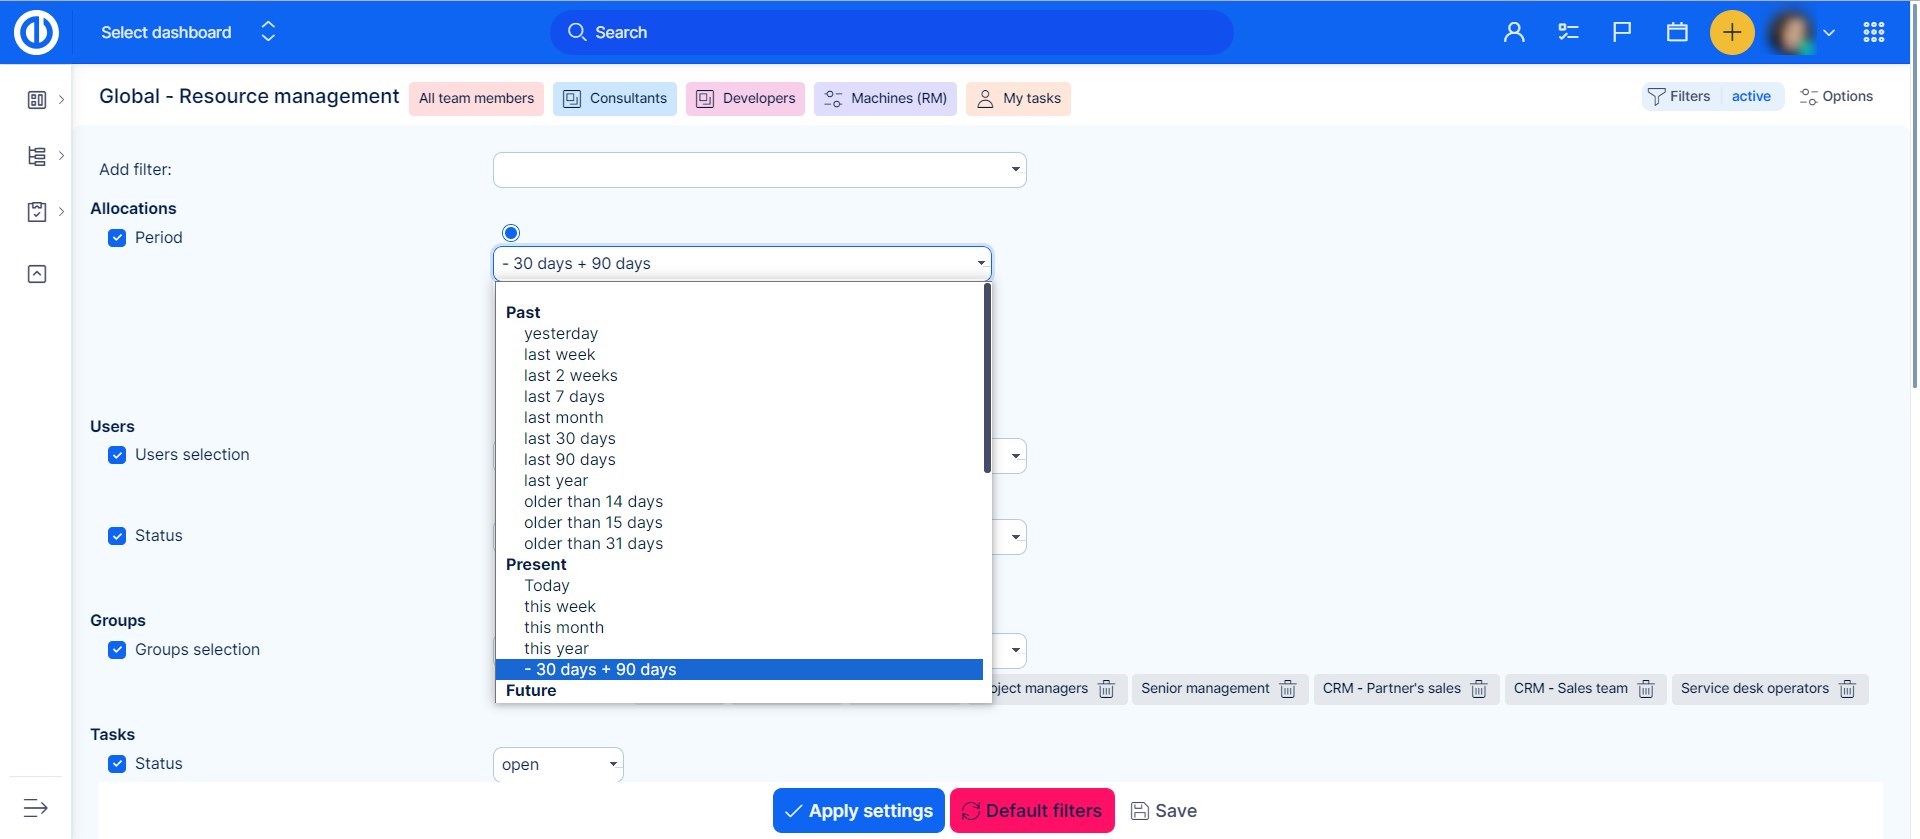
How to define displayed time period on the global level
On the global level of Resource management, you have to define displayed time period (by default, the period is set to -30 +90 days). To do it, click on the Filters button and check the period under Allocations. When set, you can see the selected period is visualized lighter than the rest of the timeline so you have a better overview of the time you need to allocate resources within. No tasks with both start date and due date laying outside the period are displayed (tasks with either a start date or due date inside the period are displayed), therefore, it can improve loading performance as well .
Resource Dashboard
Resource Dashboard is a complement to the Resource management plugin. It is a set of dashboards that brings an ultimate visual overview of all your resources on a one-page dashboard. So you need no more than just one look at this dashboard in order to get an instant insight into your KPI's and resources.
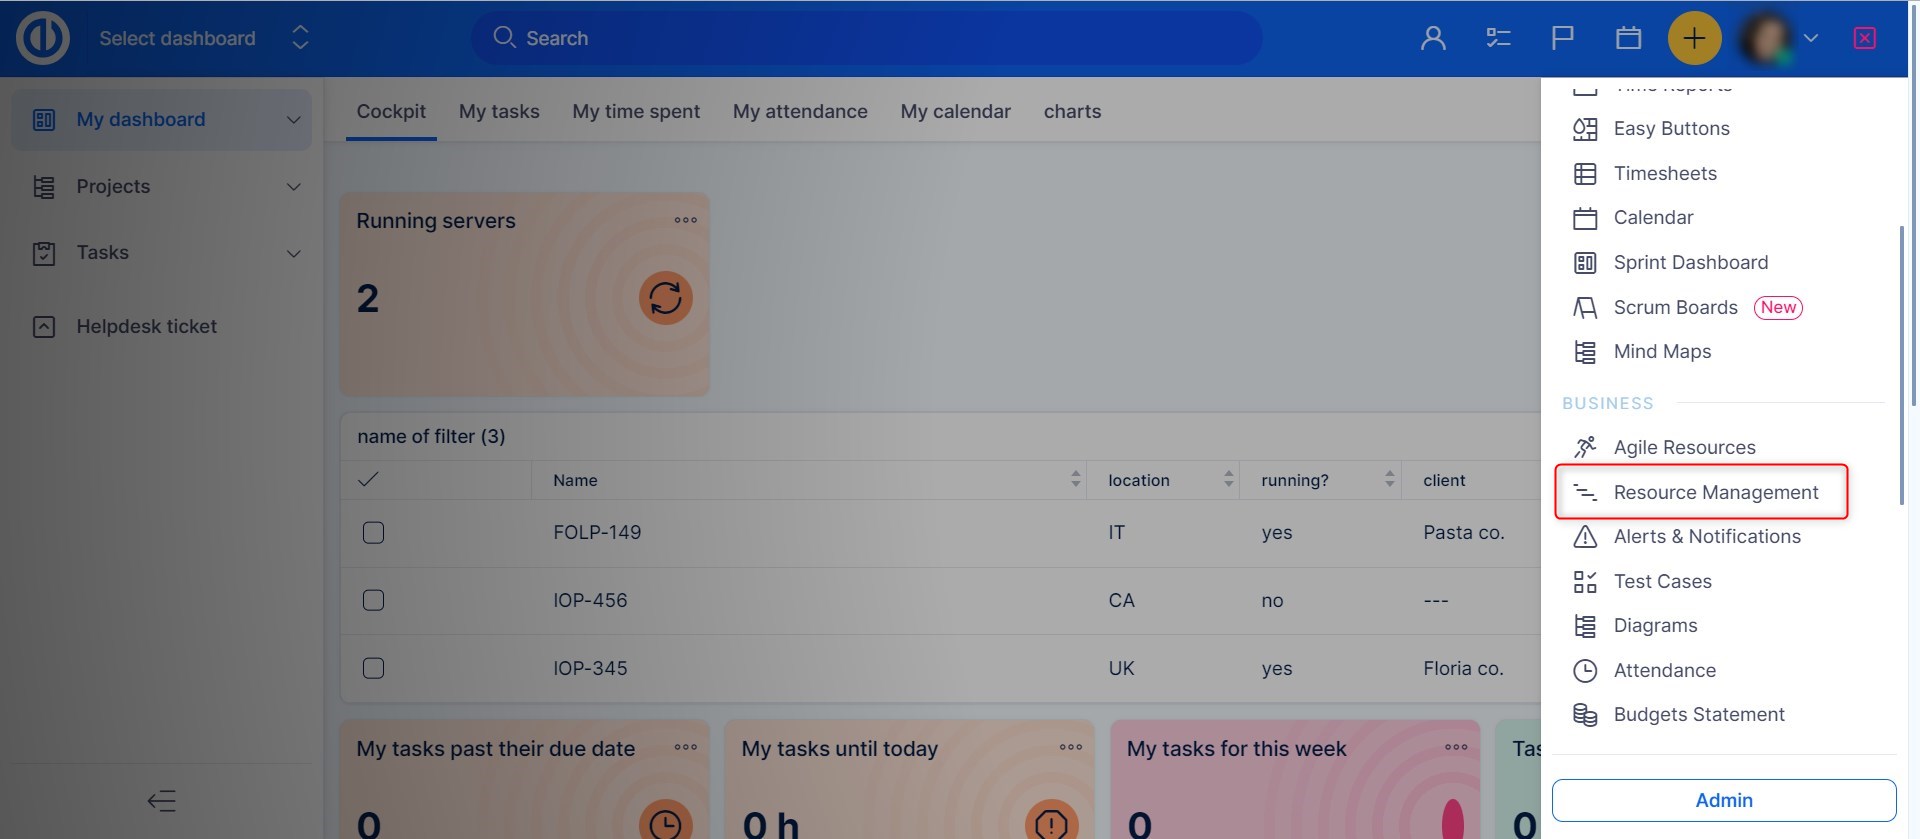
How to access the Dashboards
You can find it in Globa menu as shown below. Please note this is a global-level functionality only so you cannot find it on particular projects.
Easily customizable
In principle, the resource dashboard can be customized in the same manner as My Dashboard or a Project dashboard. The main difference is in the availability of widgets you can select from and put them on the page. Among the standard widgets that you can add into Resource Dashboard as well as on any other Dashboards, there are several additional widgets specifically customized for the purpose of showing resource allocations as listed below.
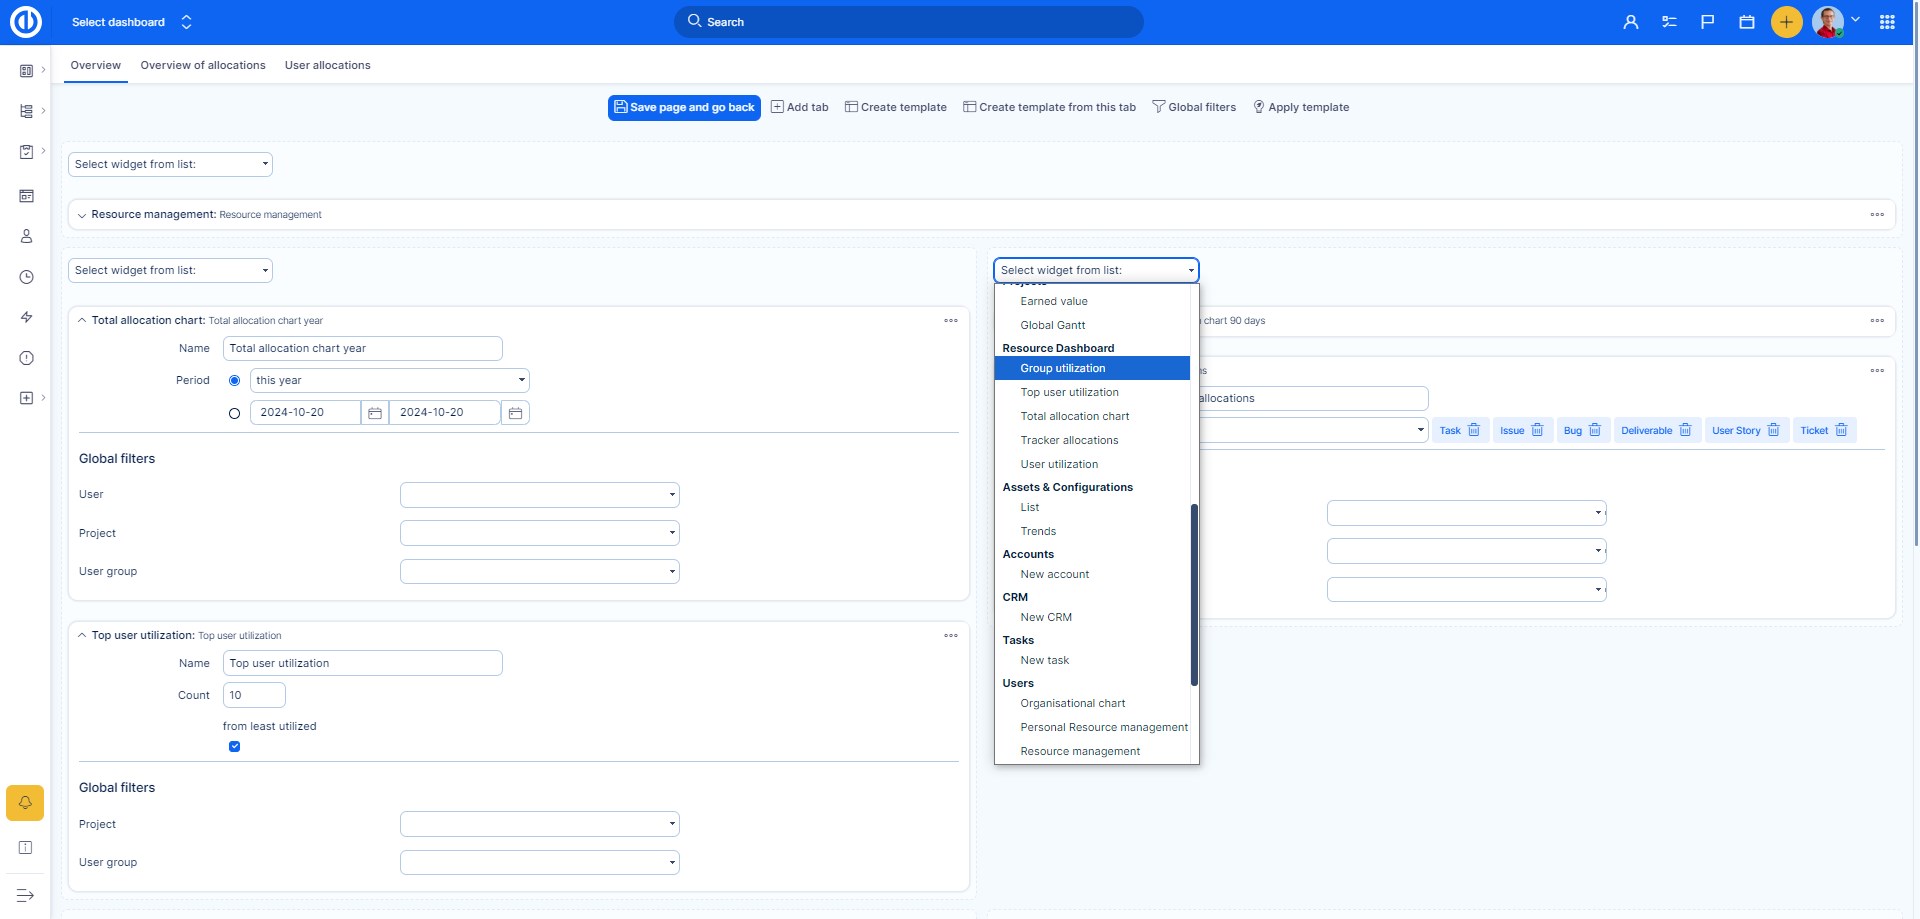
Many types of interactive visualization
Select from various available types of data representation such as graphs, charts, gauges and pipelines. Everything may be easily and quickly configured in widget settings.
- Tracker allocations
Tracker allocations show how much time is allocated for each type of a task tracker. It might look like this.
![]()
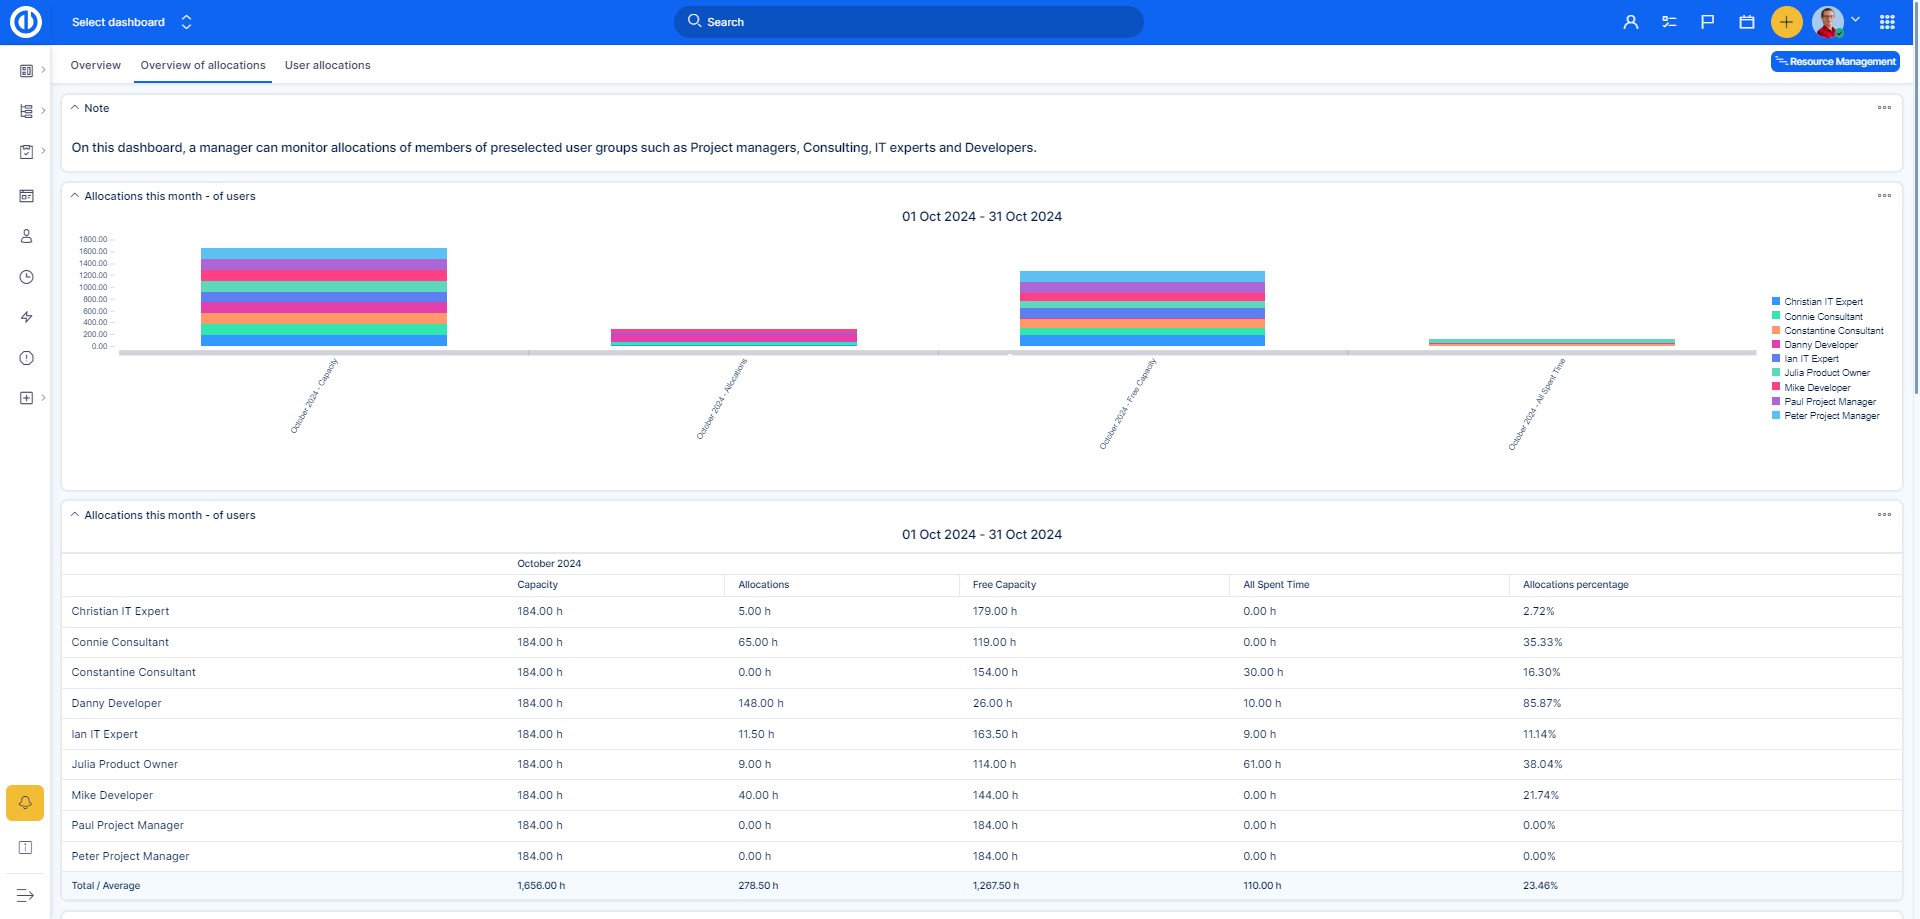
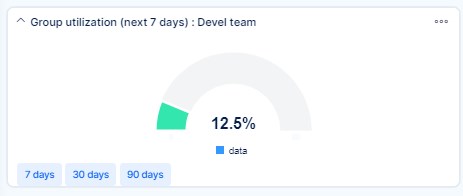
- Group utilization
Group utilization shows a work utilization of a selected group of users. Here is an example.
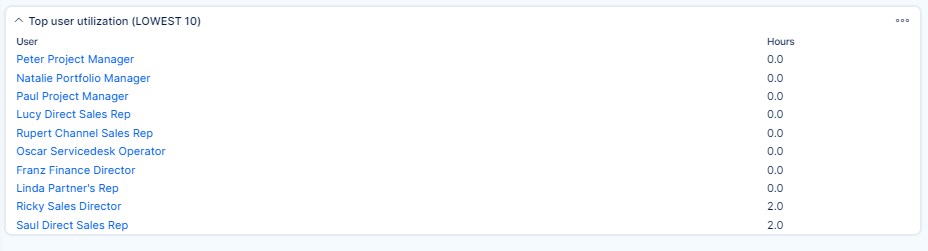
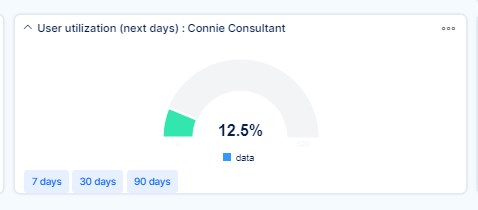
- Top user utilization / User utilization
While Top user utilization shows a list with specified number of most utilized users, a common User utilization shows a total allocation per selected user as illustrated below.
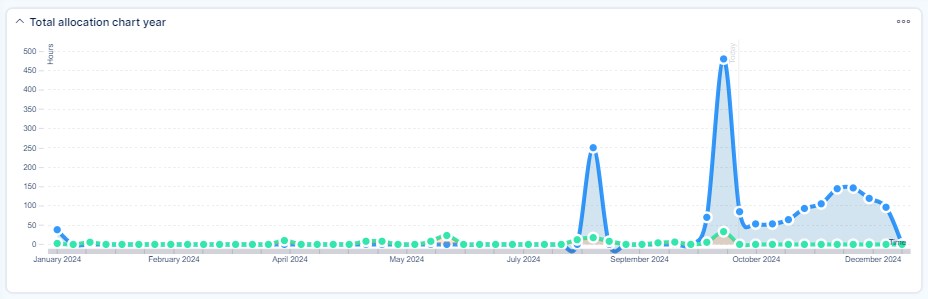
- Total allocation chart
Total allocation chart shows a total allocation overview as the proportion of spent time and estimated time per all resources in a single chart. This may look like this.
Project level of Resource management
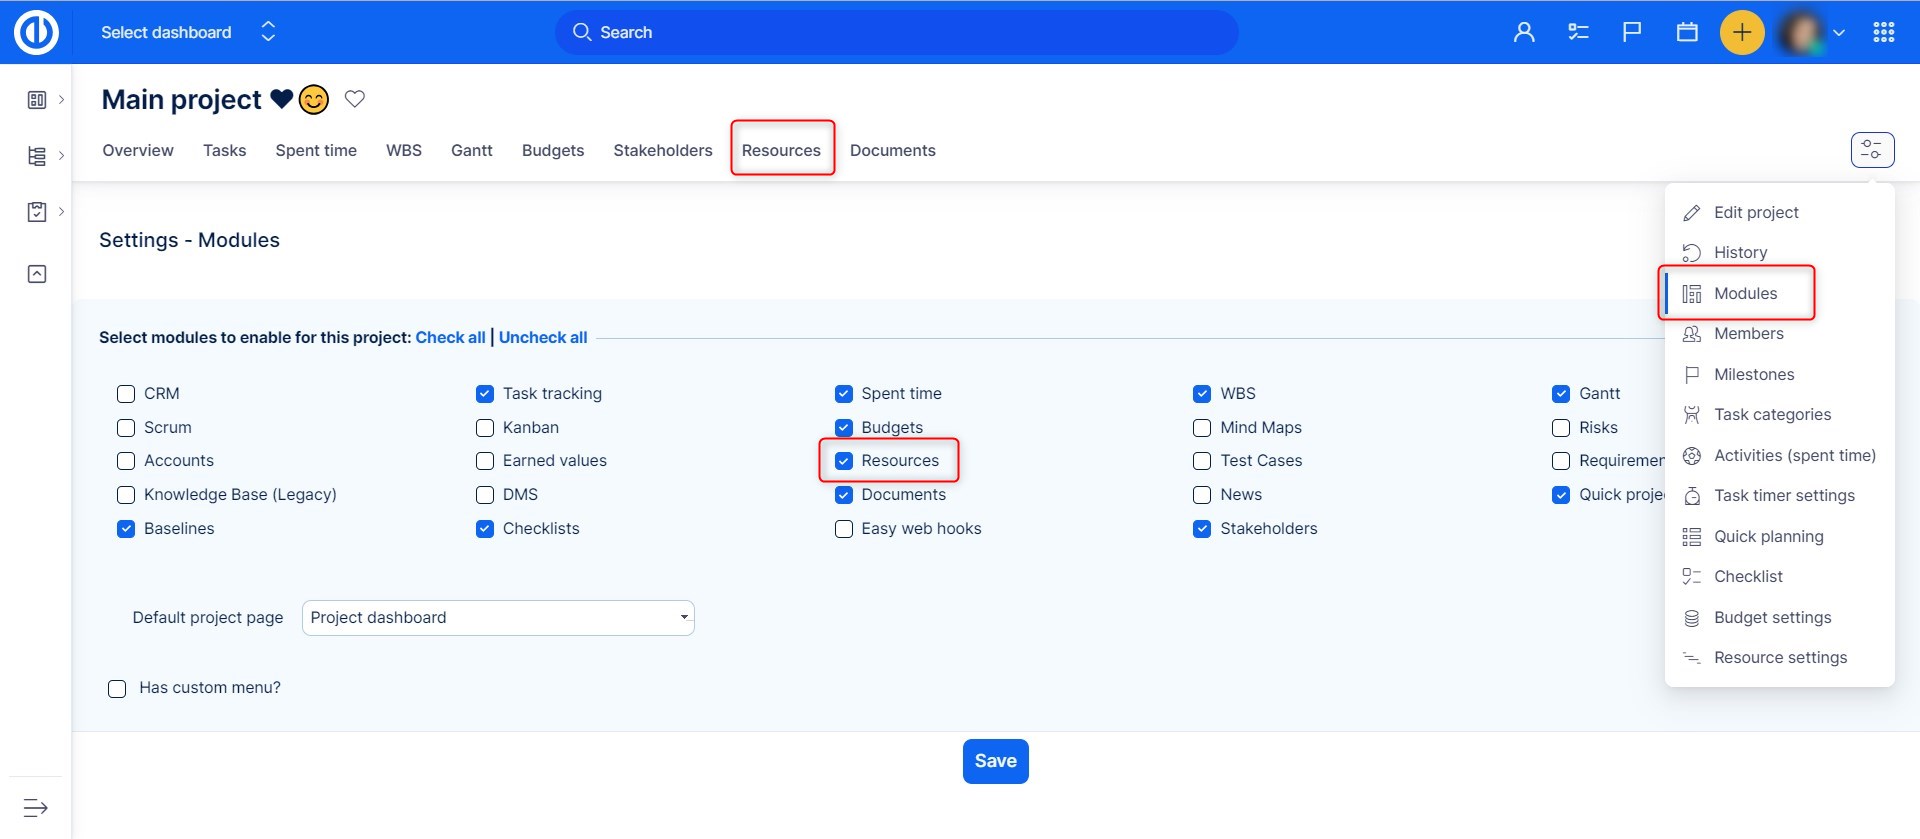
Now, let's have a look at Resource management on the project level. Before you can access it from a project, you need to activate the module called Resources in the project controls >> modules as shown in the image below.
Immediately after activating the module, the Resource management tab will appear in the top menu of the particular project. Click on it and Resource management will open. Using the functionality on the project level is a better choice for the users who need to manage resources of the particular project only so there is no need to see them for all the projects as on the global level. Another difference is that Resource management on the project level is integrated with Easy Gantt so you can effectively work with both the modules together which is not possible on the global level. If you open a parent project in Resource management, only the selected project is displayed, not its subprojects and their tasks.
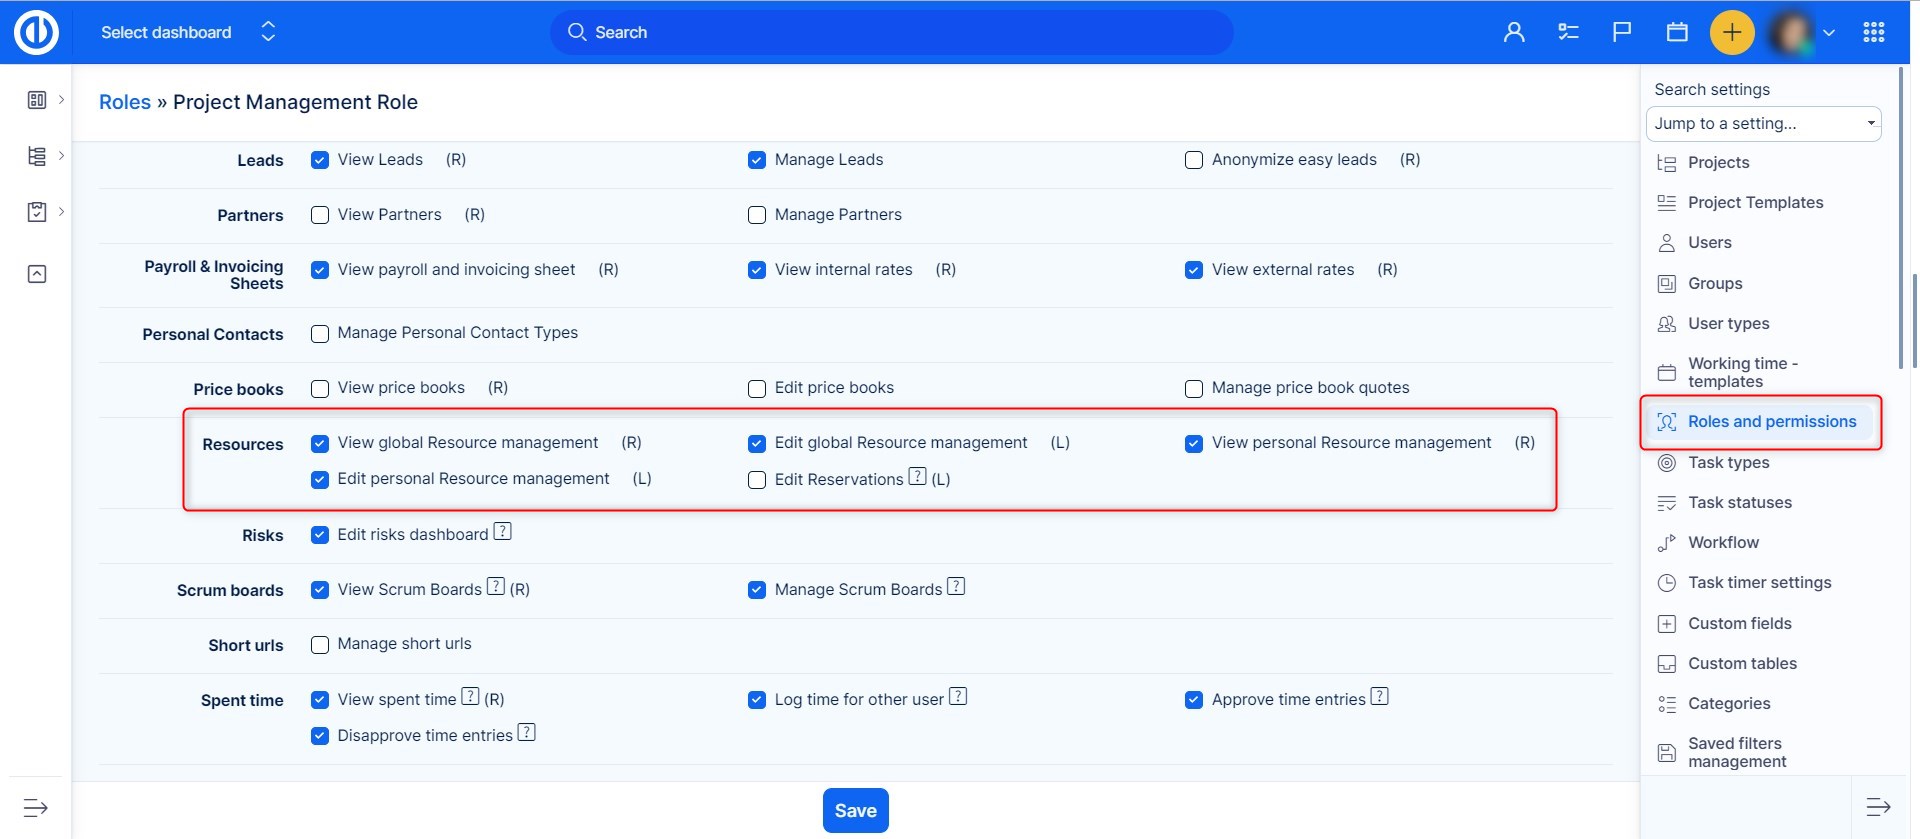
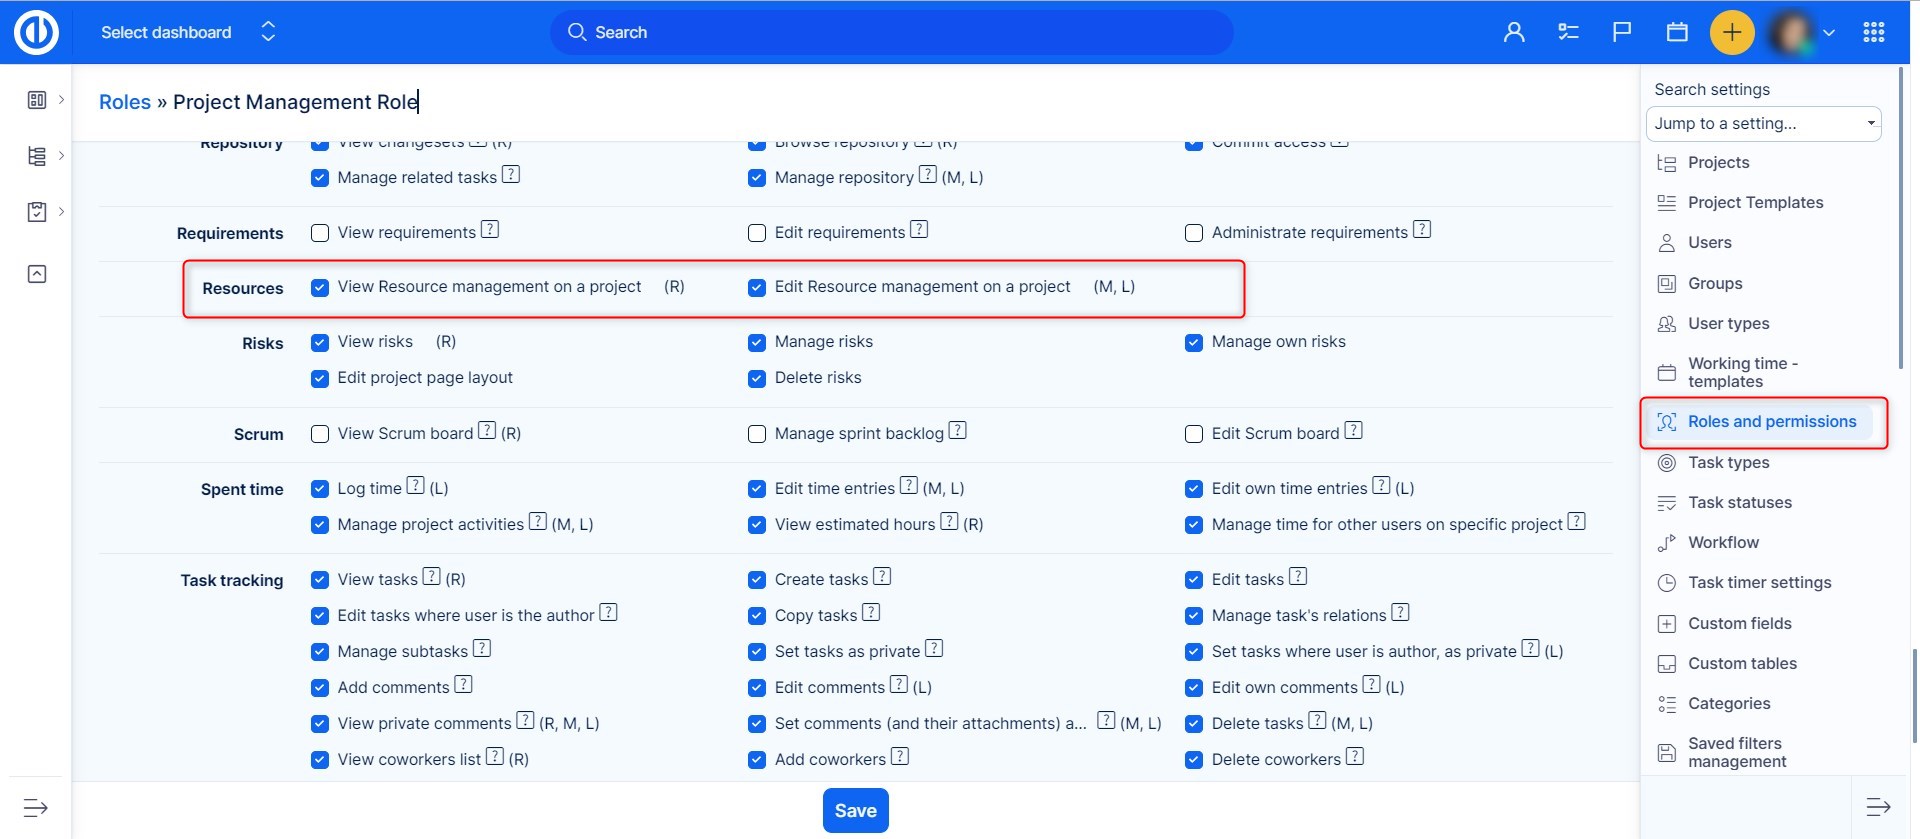
How to set up permissions for Resource Management
The permissions for Resource Management can be set up in Global menu >> Administration >> Roles and permissions >> Resources. Moreover, the Edit button (enabling you to work with Resource Management) is only available when the permission "Manage tasks relations" is enabled (can be found under Roles and permissions >> Project permissions >> Task tracking >> Manage task's relations).
Please note that some permissions are dependent on others. For example, the Edit button will only be available when permissions "View Easy Gantt" and "Manage tasks relations" are enabled. To view/edit Resource Management, you need permission to view/edit Easy Gantt. Permission "View estimated hours" is also required to use Resource Management.
How to set up default filters for Resource Management
Default filters are those set as system default and they are active every time for every user when no custom filters are active. To edit settings of default filters for global Resource management, go to Global menu >> Administration >> Default filters >> Resource management.
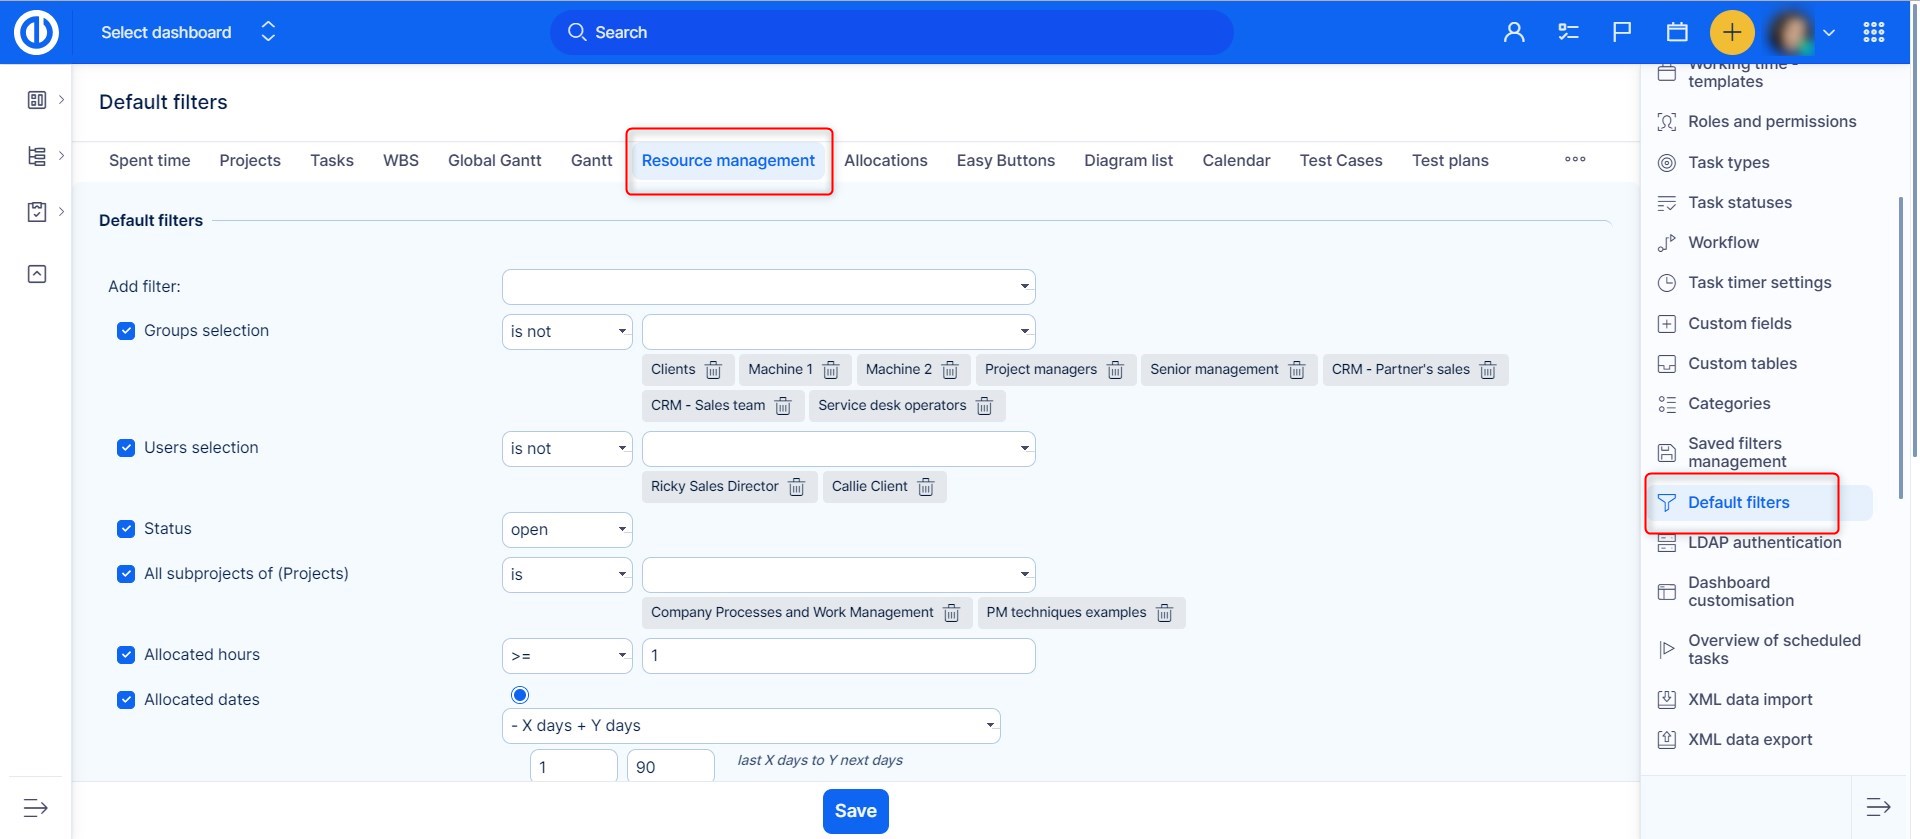
The available options are as follows:
- Add filter (select one or more filters that will be applied simultaneously)
- Default custom formatting (choose if a specific custom formatting scheme will activate along with the filter)
- Default columns (choose columns from the list that will show as default and move them to the right field)
- Show avatars (shows personal user avatars, i.e. little profile images)
Now, when you save the filters and go to Resource management, you will find the list of items filtered according to these criteria (if no custom filter is active). Default filters are valid for any other user as well.
How to display tasks of the workers in time with their total workload
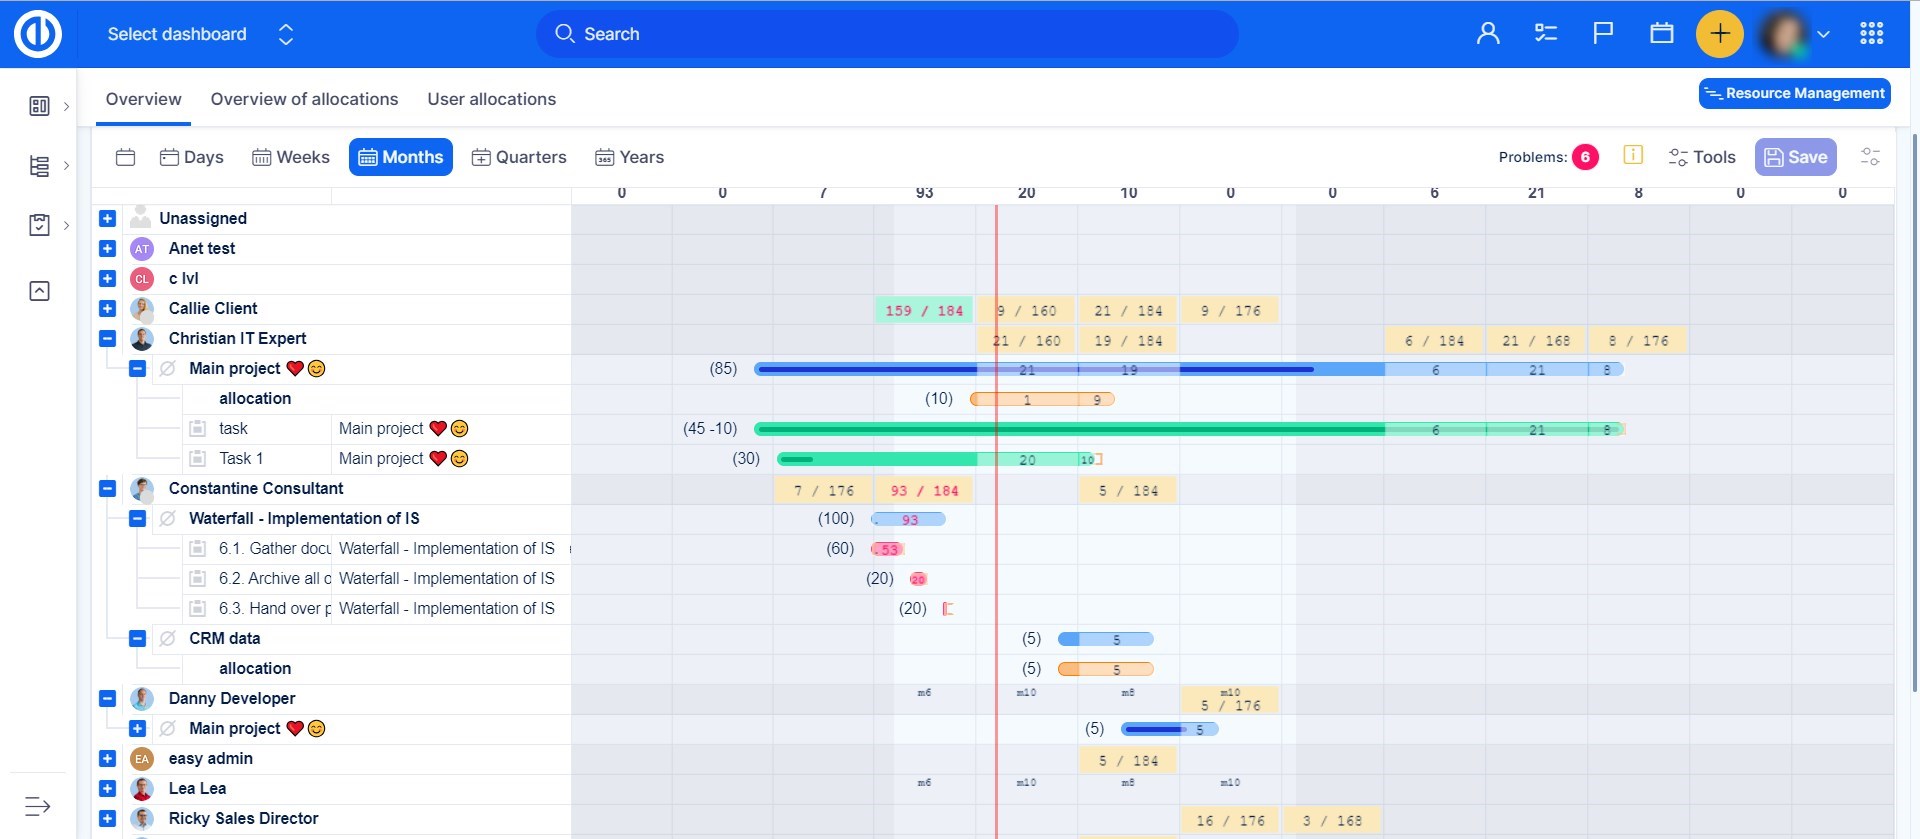
On the left side, you find both unassigned tasks as well as members (resources) of the particular project (on the project level) or all projects' members (on the global level). By clicking on "+" symbol next to the name, it expands the list of tasks assigned to the particular user. Each task is visualized on the timeline. The length of the task on timeline indicates the estimated number of days for realization. The numbers inside particular days (squares in the table) represent the number of hours planned for work on the task.
The total estimated number of hours for the task is automatically distributed among working days of the task duration starting from the back (due date) by default. For example, when the total estimated time for a task is 20 hours and task duration is 4 days, it will be distributed the following way: 0 hours on day 1, 4 hours on day 2, 8 hours on day 3 and 8 hours on day 4. This shows you when is the latest possible time to start working on the task in order to complete it within the due date. If a task is missing one date (start date or due date), the allocations are then calculated in the direction from the fixed date per 8 hours (resp. max allocable hours per day) and the task stretches accordingly in order not to overload. For example, the <20) changes to <8|8|4) where the round bracket is a fixed date and the angle bracket is undefined.
The maximum number of allocable hours per day can be set up in Resource settings in the upper right corner. When the whole task is green, it indicates there is no problem. When it's red, there is some issue with the task, most typically task duration is too short for its estimated hours' count or the number of hours exceeds max allocable hours per day. When a task is gray, it's closed.
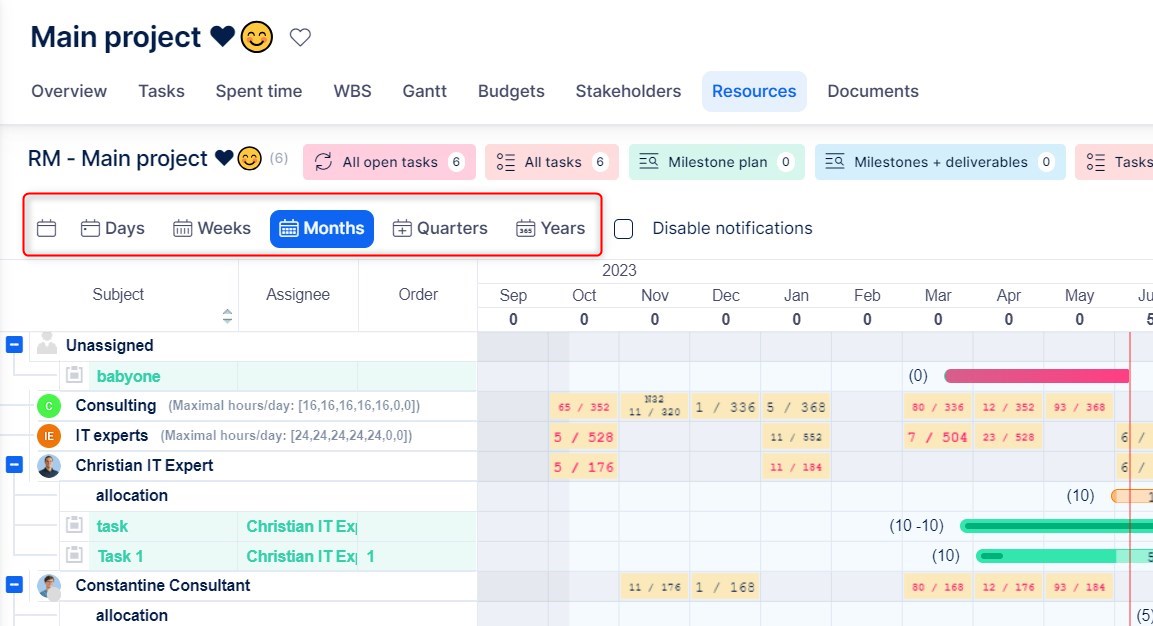
How to work with daily/weekly/monthly view of planned workload
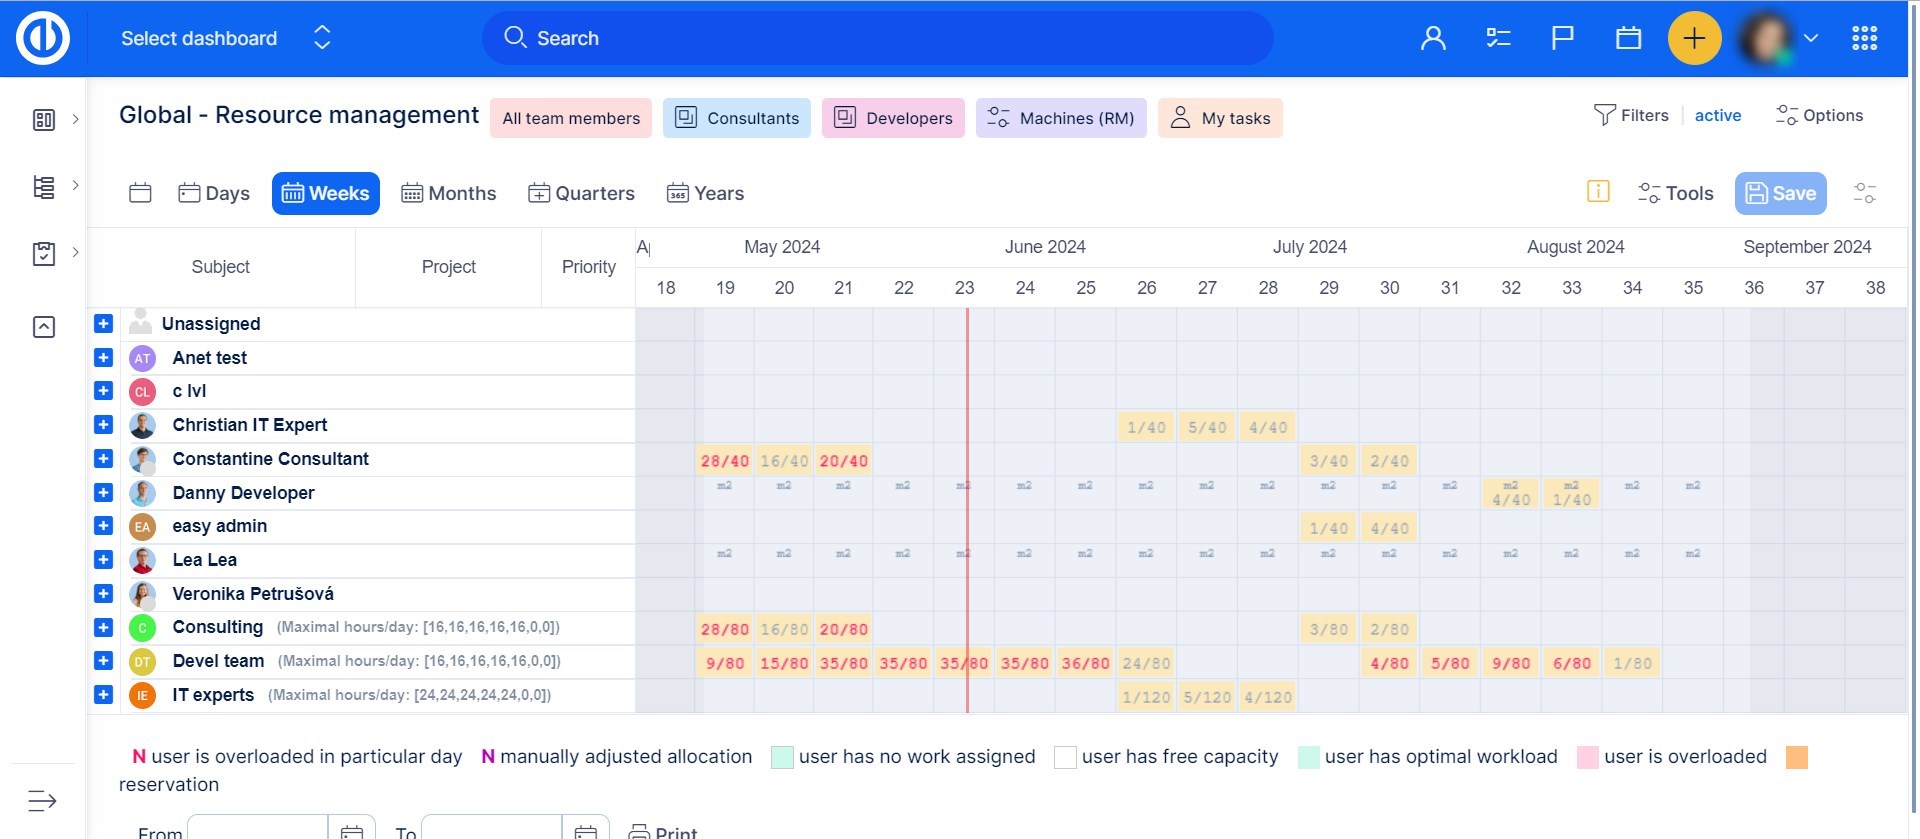
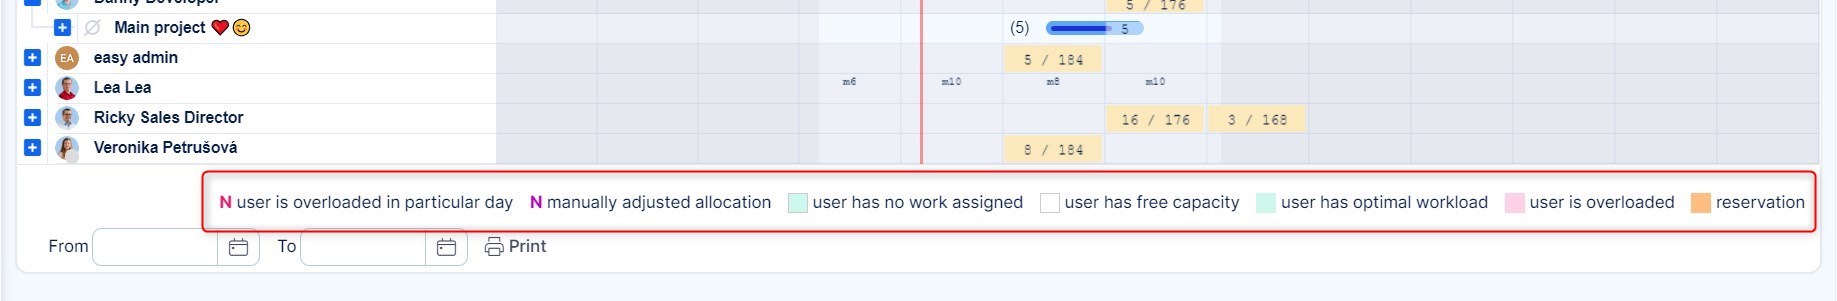
The timeline offers types of view: days, weeks, months. Based on the project length and the necessary level of detail, they can be switched between from the top menu. When you are on a week/month view, you can see a sort of resource allocation summary per each user in the respective period. The colors indicate the level of workload as described on the image below. After switching the view to weekly/monthly basis, all workload allocations are evenly spread over the respective period.
When text in cells is too long, it automatically splits into two lines and the invisible part is replaced with a hash symbol (#) as illustrated below. The purpose is to prevent text getting over to neighboring cells.
How to work with custom allocations
As was said previously, task's estimated time (hours) is automatically distributed throughout task duration (days) according to the allocation rules. If you don't like the way how the workload is allocated to individual days, you can personally reallocate it very easily. This is called custom allocation. By double-click on a particular day of the task duration, you can enter a custom number of hours. The number will turn purple then to indicate the custom allocation. The analogical way you can edit total estimated time (in brackets before the taskbar) and the daily workloads will recalculate automatically then. When a custom allocation is set, you can delete it via double-click and remove the value.
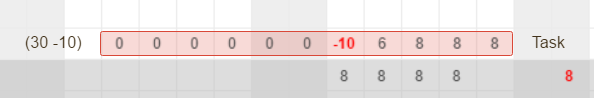
When you see two numbers in brackets before the taskbar, such as (30-10), the first number is total estimated time while the second one is time already spent on the task. Remember that any negative time value represents spent time.
When you move a task and drop it over weekend or vacation/holiday of the assignee, the number of working days in tasks' duration have to remain. Therefore, it automatically prolongs the due date of the task and allocated estimated time of the task is redistributed among working days only, skipping the days off.
!Important!
In Administration >> Overview of scheduled tasks there is an option to "Recalculate task allocations" This option will remove all custom allocations and replace them by allocations based on the default allocator. Be mindfull when using this feature.
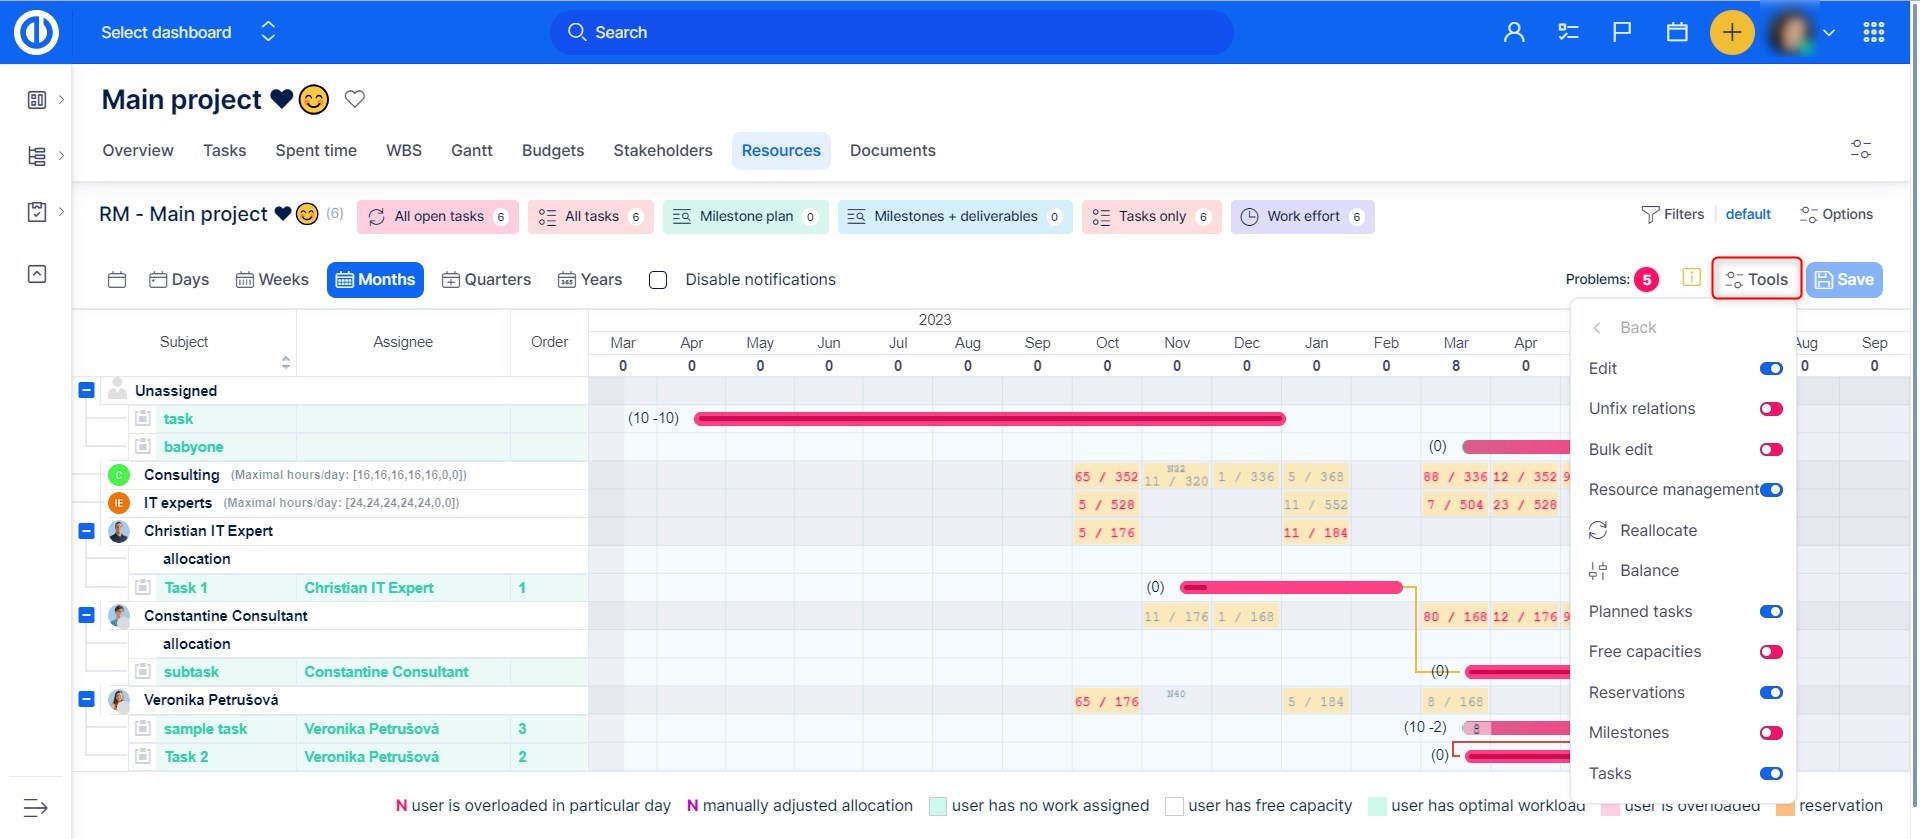
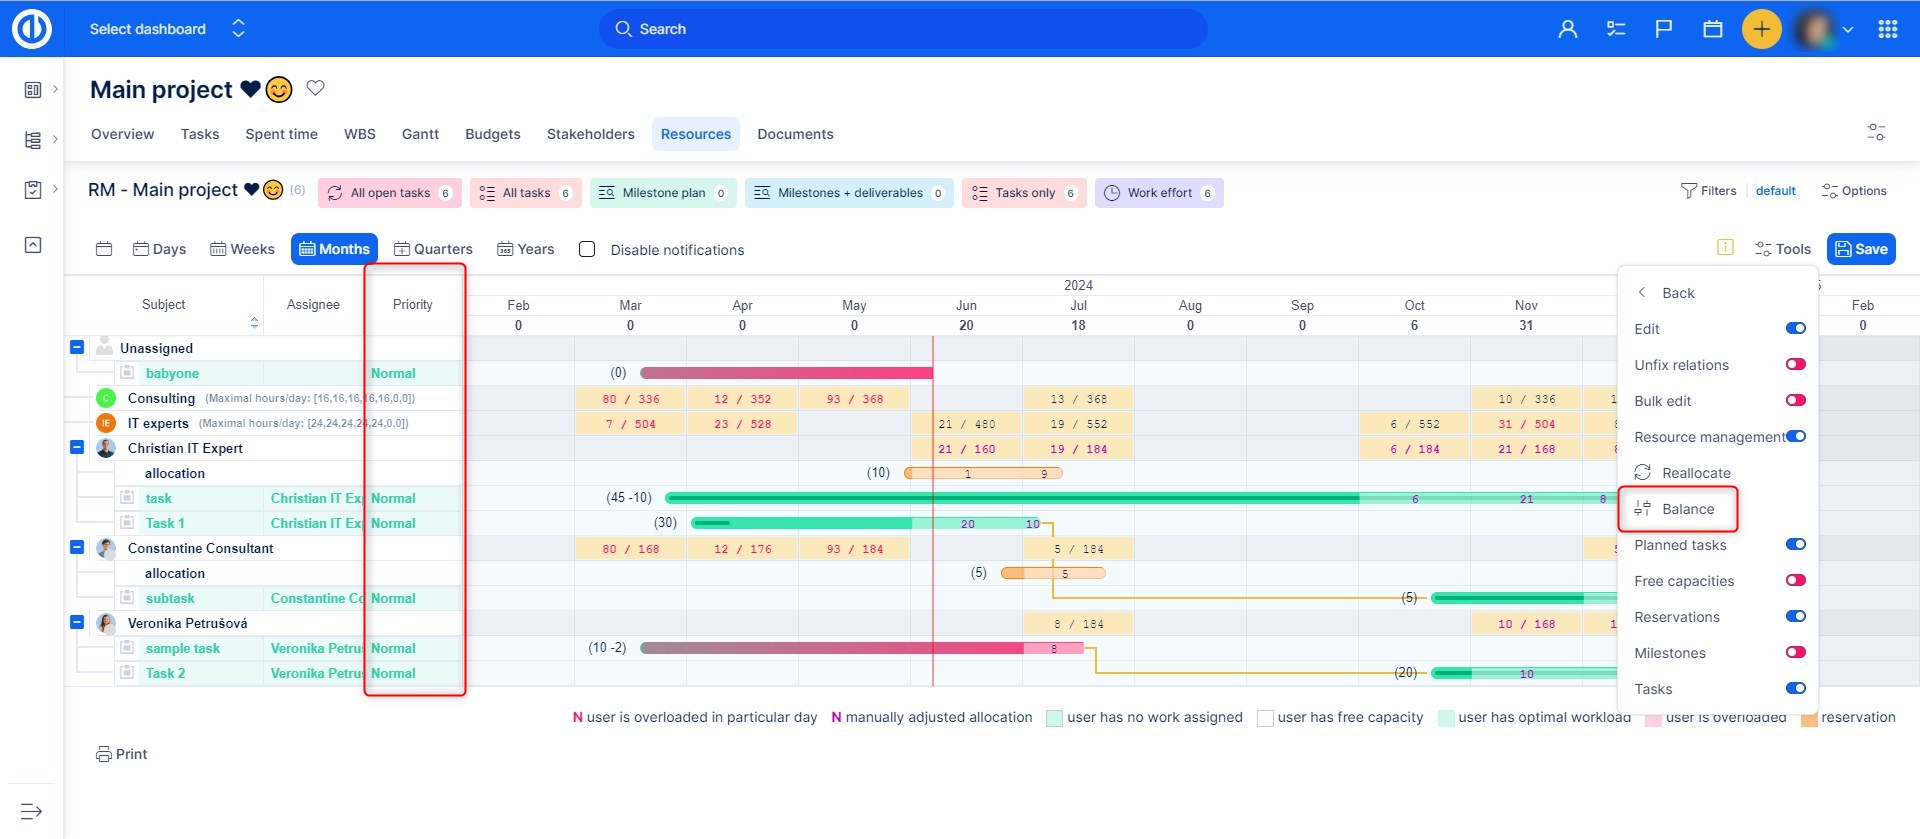
How to use the Balance feature
The Balance feature can be found in the Tools menu of Resource Management, both on the global and the project levels. By clicking on it, all allocated hours of all displayed user-assigned tasks (i.e. those expanded/visible on the timeline, not those hidden/collapsed) will automatically redistribute throughout the entire task's duration (start date - due date) based on the user's free capacity, taking into account his daily working hours, vacations as well as other task allocations.
A little difference between the global and the project levels is that the project-level balancing only works with tasks belonging to that particular project, ignoring any possibly visible tasks from different projects, and that the balancing process is always applied to all the tasks from this particular project, regardless of whether they are expanded or collapsed.
This automatic balancing process is based on the allocator type called Evenly (slow) = hours are allocated evenly throughout duration of a task, starting from today onwards. Only the last day of the task duration is never (auto)balanced because any remaining hours that could not be allocated into previous days are all moved into this last day. Likewise, when two or more tasks overlap, their allocated hours from the days of overlap are all moved to the last days of that particular tasks and must be allocated manually.
After the balancing is finished, any newly created vacations are not taken into account anymore, however, the process can be repeated to take them into account too. If you need to restore an original state of an unsaved reallocation (i.e. you did not click the Save button after the balancing process was finished), you can do it simply by refreshing the page (using F5 key). Do not use the Back button to cancel an unsaved Balance reallocation because it does not work well for this purpose. An already saved Balance reallocation can be taken back just manually by the user.
The balancing process is always executed in order of tasks' priorities - if the Priority column is displayed on the left side of Resource Management, tasks with a higher priority are balanced first (before tasks with lower priority). If the Priority column is not displayed, then tasks are balanced according to their order in the left-side list. Reservations are excluded from balancing. Reservations are allocated evenly by default, which can be changed when creating a reservation.
Global resource settings
Global resource settings can be entered by clicking on the "Resource settings" button in the upper right corner of global Resource management.
The options are as follows:
- Hours per day: Max allocable hours per day for all users who have not set their individual daily working hours for allocations.
- Advance hours definition: With this option enabled, you can set the "Hours per day" limits for each day of week separately.
- Default zoom: Default zoom for global Resource management
-
Default allocator: How estimated hours on tasks will be allocated. For performance reasons, changing this option will not affect current existing default allocators on tasks. If you do not work with this field on tasks, you can disable it in Administration >> Task types >> Standard fields. The options are as follows:
- From end - Hours are allocated from due date of a task.
- From start - Hours are allocated from start date of a task.
- Evenly (slow) - Hours are allocated evenly throughout duration of a task.
- Future from end - Hours are allocated from due date of a task towards today.
- Future from start - Hours are allocated from today towards due date of a task.
- Future evenly - Hours are allocated evenly from today towards the due date of the task. When hour limit per day is reached, all remaining hours are allocated to the due date of the task.
- Change allocator: Allow to change allocator on task edit
-
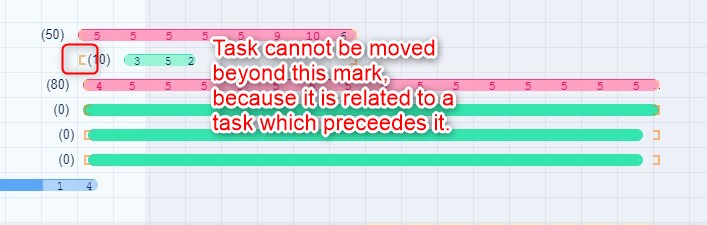
Show soonest start: Show lowest valid dates for tasks defined by relations or parent. As illustrated below, the square bracket indicates the lowest date you can move the task to, but not any further because it's related to another task that precedes it.
- Show latest due date: Shows the latest valid dates for tasks defined by relations or parent.
- Show free capacities: Enable toggling of display free capacities instead of allocated hours for assigned tasks on Resource management
- Show total project allocations: Shows the total number of allocated hours in the project-level Resource management only (not in the global-level RM).
-
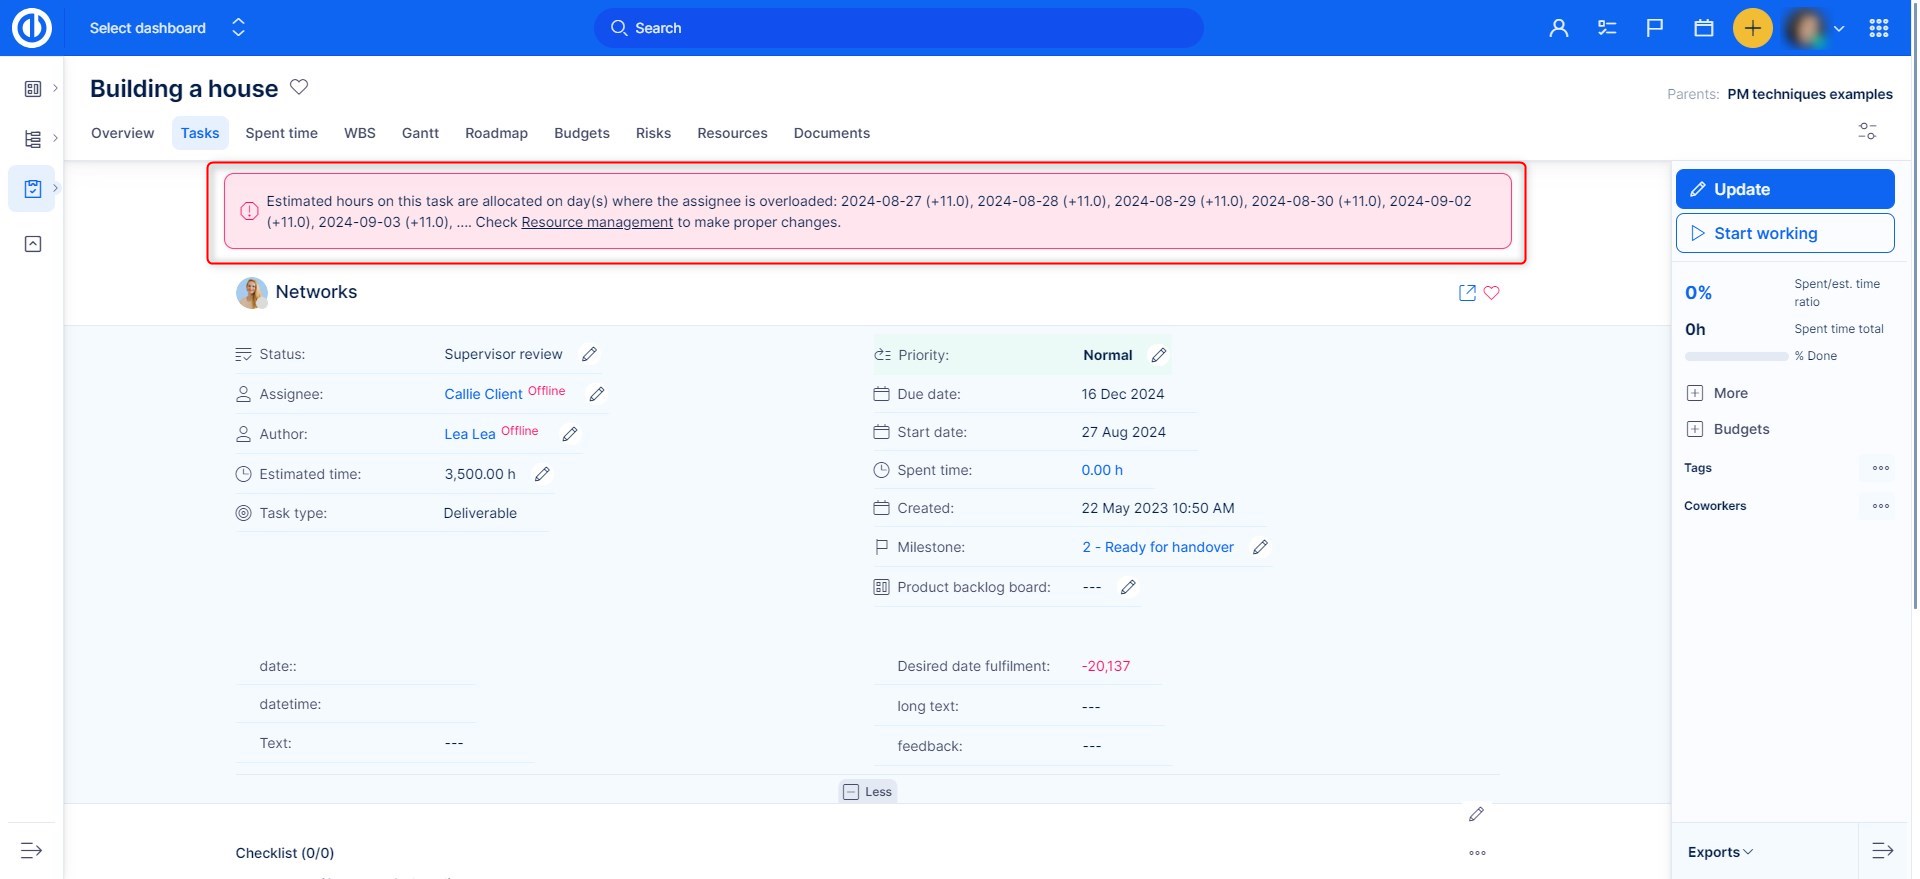
Watchdog: Watch assigned user overloading during task creation and editing, i.e. when a task has too many estimated hours related to a user's allocation capacity, a warning alert shows up in the full-screen task detail after creating or editing a task as illustrated below. The feature doesn't work when a task is unassigned, assigned to a group or anonymous user. Also, it doesn't show any alert when you are not on a task detail, for example, when assigning a task using the drag-n-drop feature in Resource management.
- Show groups: Show groups on global Resource management
- Decimal allocation: Hours will by allocated by decimal numbers (0.5 always rounds up) , for such allocations a period needs to be used. Use of a comma may cause incorrect allocations.
- Show project allocations by default: Turn on "With projects" option in Global RM by default.
-
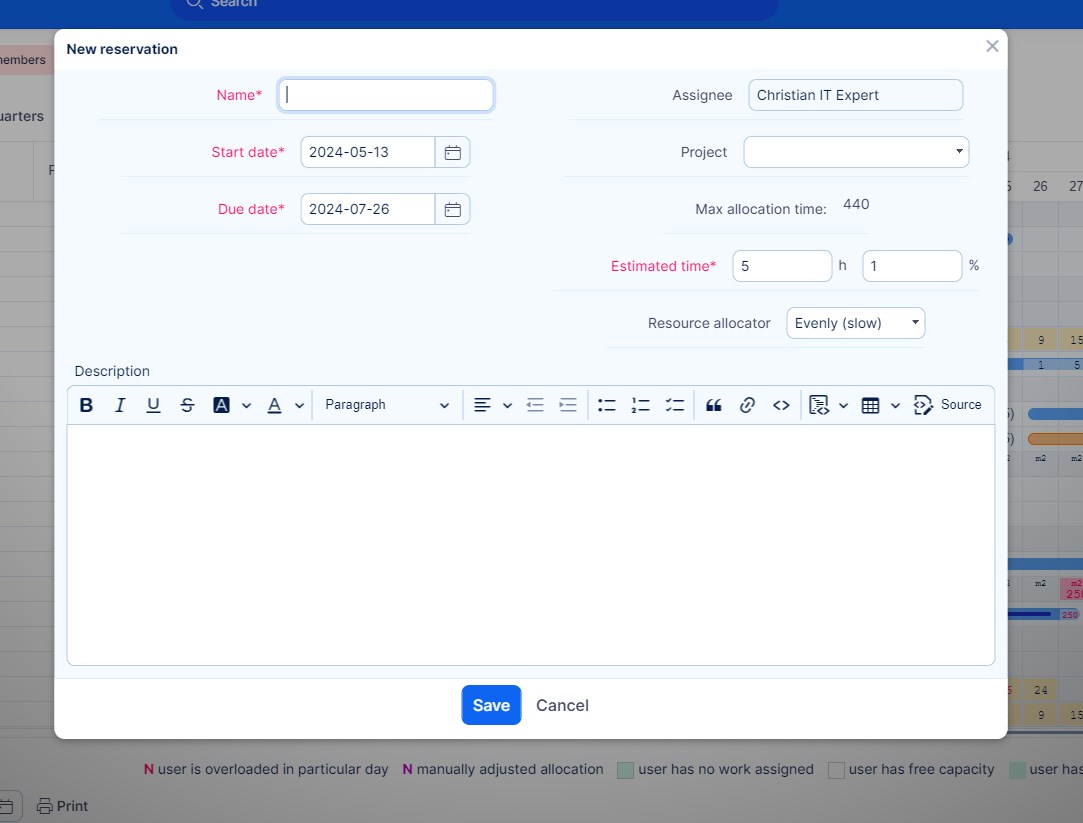
Enable reservations: Enable hours reservation on users. No tasks can be allocated inside the reserved hours until the reservation is canceled. You can delete or edit your reservation by right clicking on it. Click the animation below. The permission "Edit reservations", which can be enabled in Administration >> Roles and permissions, is still required for the specific user role to use Reservations.
- Enable holidays for groups: Allocations are reduced if members of the group have holidays.
- Planned tasks toggle button: Show toggle "Planned tasks" in Resource Management. This button only works with planned tasks, not planned projects.
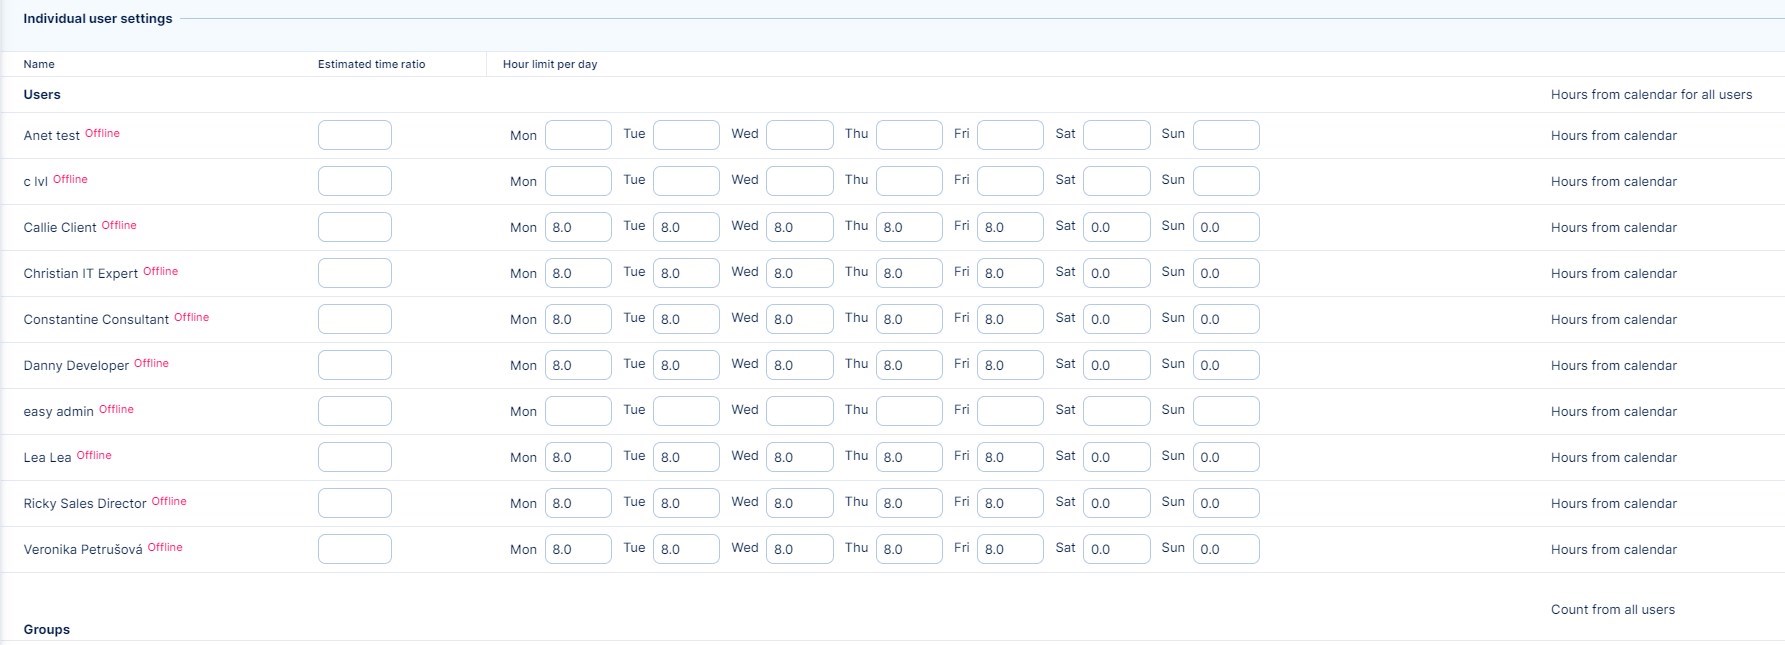
Individual user settings
- Estimated time ratio: Estimated time on tasks assigned to a user is multiplied by this constant in allocations. For example, if a task has estimated time 5 H and the ratio for assigned user is 8, he will be allocated with 40 H. This way, you can reflect different working speed of various people, such as new employee might be twice as slow compared to an experienced one.
-
Hour limit per day: User daily working hours for allocations are limited by this value. Leave blank to use the default value. When working with resource allocation summary on week/month view, the colors indicating user's workload in the respective period take into account his current allocation time capacity. For example, if user A has capacity 40 hours a week, user B can work 30 hours a week while user C only 20 hours a week, then a weekly workload with estimated time 25 hours will color yellow for user A (user has free capacity - less than 70% workload), green for user B (user has optimal workload - more than 70% workload) and red for user C (user is overloaded - equal or more than 100% workload).
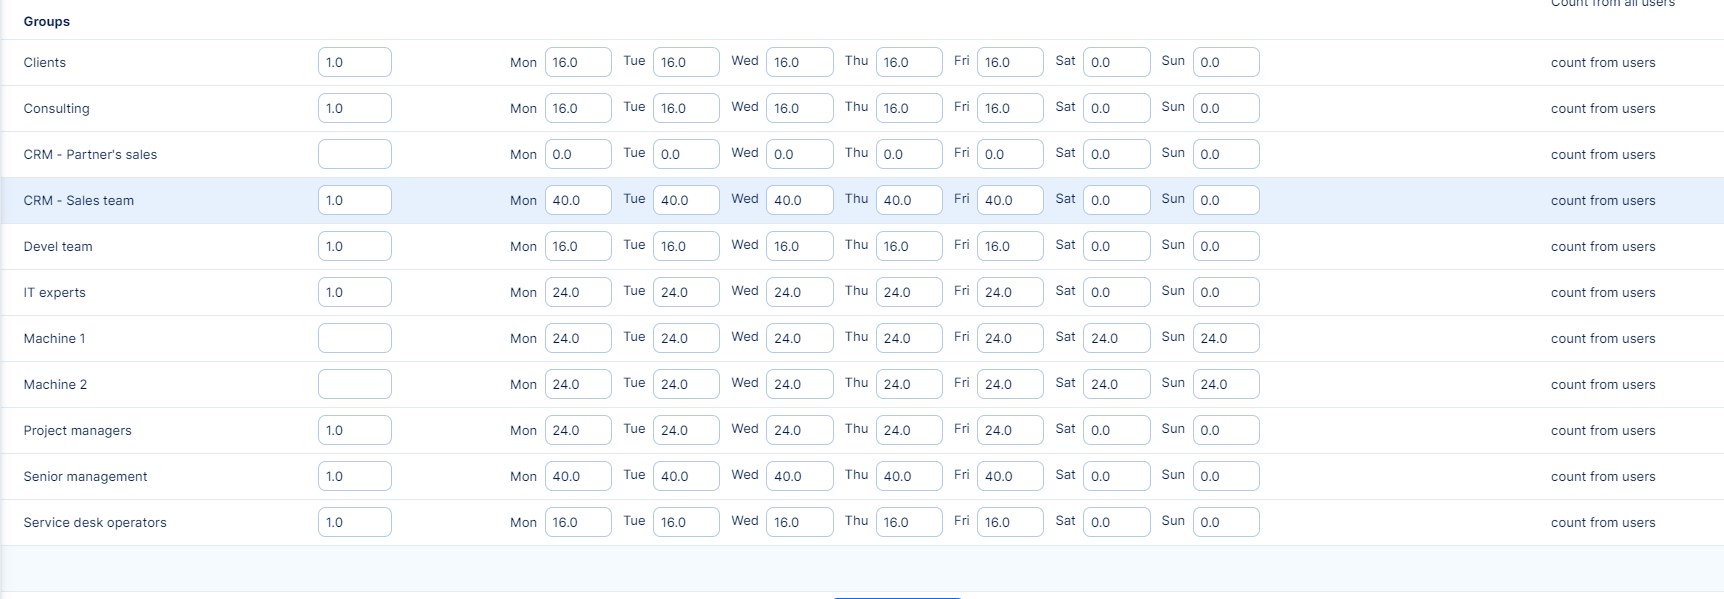
Groups
- Here you can set both "Estimated time ratio" and "Hour limit per day" for entire groups. The values can be entered either manually or let it count automatically from group members. If no values are set for individual users, they are evenly distributed among group members. If values are set both for users and groups, the group's settings take into account user's settings and thus distribute the values accordingly among group members.
How to work with competence planning by teams and task types
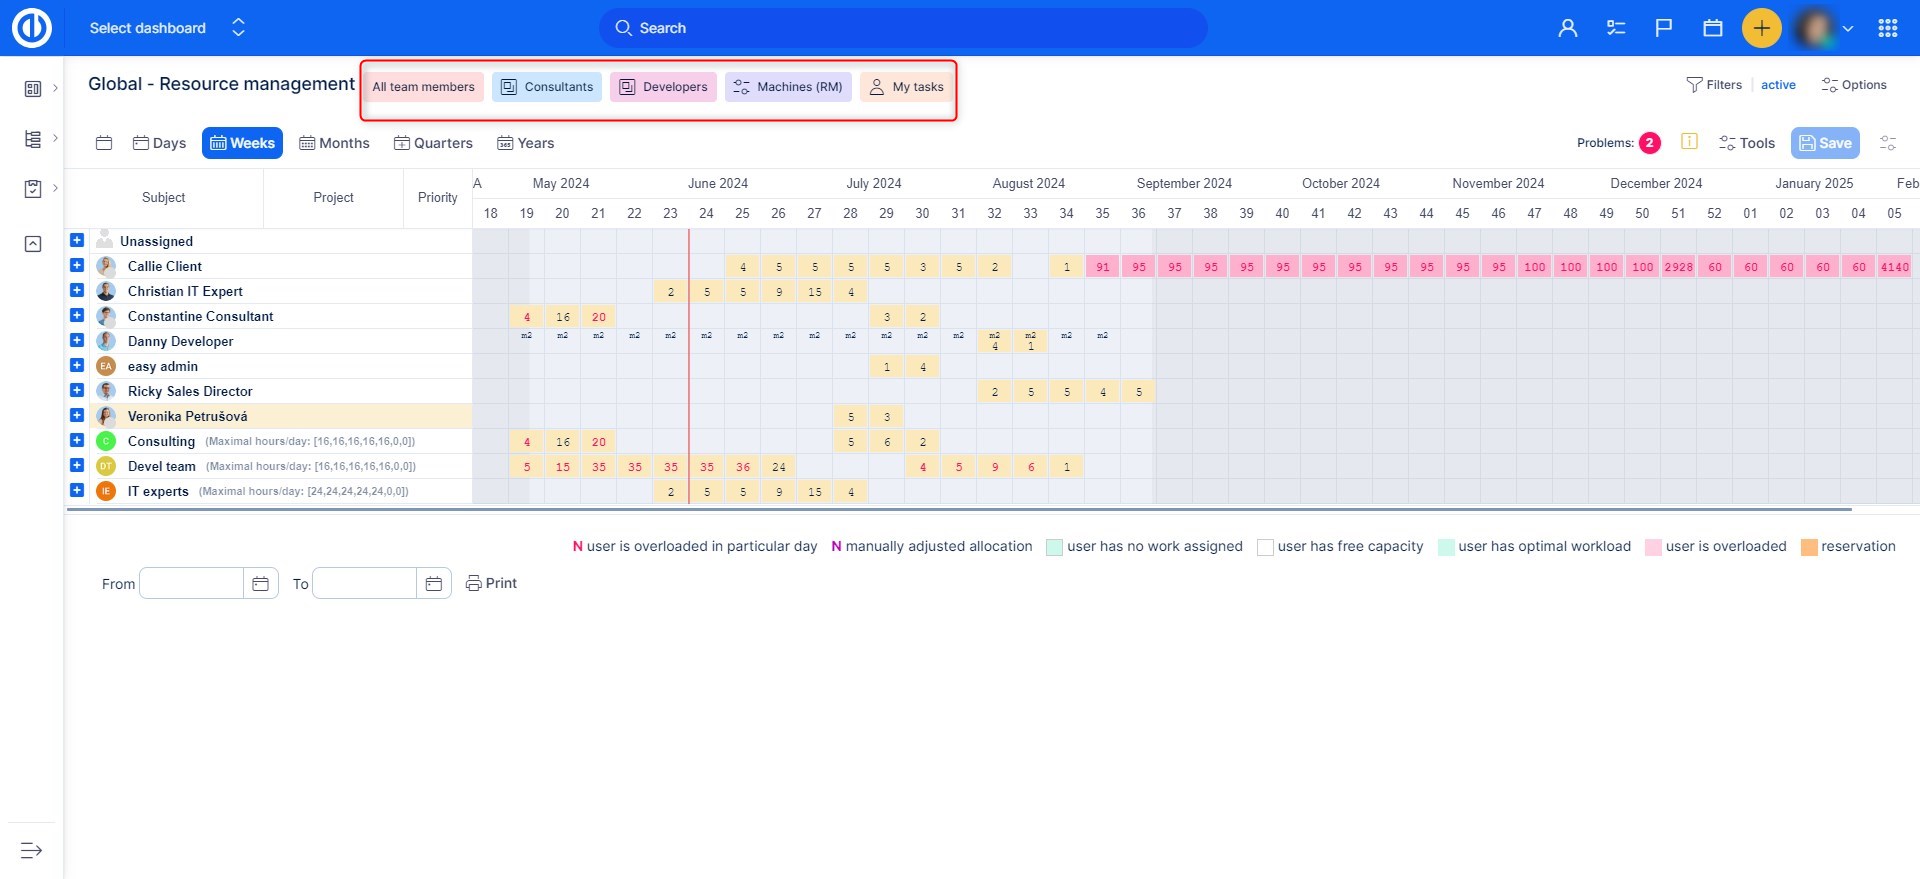
Competence planning allows you to reduce your view to the resources (users) you actually need to work with. To do it, set up and save filters by task type and user and then make them visible in the heading like on the animation below. If you don't know how to set up the filters, check out this tutorial. Resource management supports all standard filtering options already well-known from any kinds of lists in Easy Project. This way you can show only certain tasks or users according to your preferences. Resource management offers two groups of filters - for tasks and for users.
Filters above tasks affect the right side of the table - the grid where you allocate the tasks. While filtering above users affects the left side - list of users you are allocating the tasks to. Most useful for competence management, e. g. head of development views only development tasks and development team, while chief of sales works with a different set of users and tasks.
How to work with attendance records
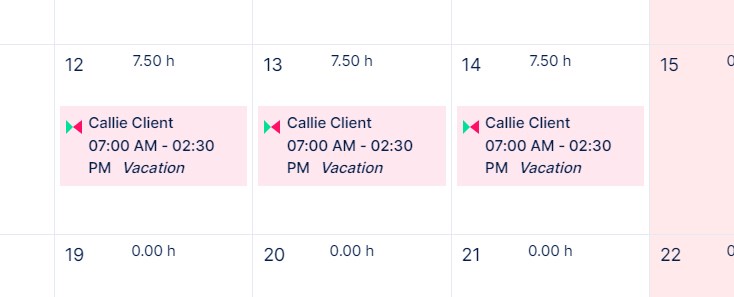
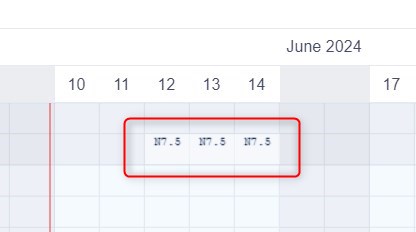
Thanks to the communication link between Resource management and Attendance management, the days when a user is not available (due to vacation, sickness or any other reason) are displayed on Resource management timeline with "N" symbol as shown in the image below. This will prevent the user from getting tasks for these particular days.
How to work with task updates and assignment using a drag & drop feature
You can drag a task a move it to another date simply. When a user is overloaded you can move the task to another user in the same manner. When a user is not a member of a particular project, he cannot be assigned with any task of this project.
Integration with meeting calendar
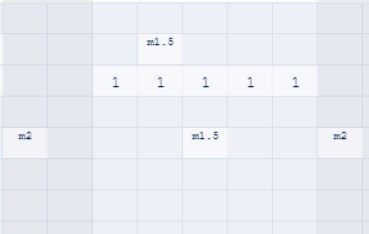
Thanks to integration with Meeting Calendar, all planned events such as meetings, holidays etc. are taken into account in workers' capacities. A day with such an event is marked by a letter such as "m" (meeting) or "H" (holiday). The number following the letter "m" indicates the estimated amount of hours for the meeting.
Event/allocation tooltips
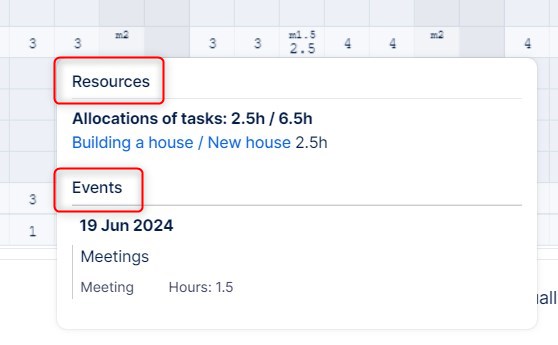
By clicking on a cell including an event, a small information tooltip appears showing the summary of the events in the selected period. The tooltip works on a daily, weekly and monthly basis as well. If there is a continuous event (vacation, business trip), the event is shown counted in the tooltip. A similar tooltip appears when you are on weekly/monthly view and click on any time allocation box on the timeline. This tooltip shows you the allocations of non-visible issues (tasks) which represent the total sum of hours for this particular week or month.
How to work with reservations
The Reservations feature enables managers to allocate specific workers to particular projects based on estimated working hours. This functionality is especially useful when managers are aware of the general project assignments but are uncertain about the specific tasks workers will undertake.
Key Functionality
- Managers can reserve workers for projects without assigning them to specific tasks.
- Each reservation specifies the expected working hours for a worker on a given project.
- Reservations serve as planned capacity blockers, ensuring that resources are accounted for in project planning.
- These reservations can be filtered separately from active tasks and projects, allowing for flexible reporting and planning.
Example Use Case
A manager knows that a worker will dedicate:
- 20 hours to Project A
- 20 hours to Project B
However, the exact tasks within these projects are not yet defined. Using reservations, the manager can ensure the worker's availability is blocked for these projects, preventing over-allocation.
Main Benefit
The Reservations feature supports long-term capacity planning by enabling managers to:
- Plan for an entire quarter or year without requiring detailed task specifications.
- Maintain a high-level overview of resource distribution across multiple projects.
- Prevent overbooking by visualizing planned but non-active allocations.
Filtering and Reporting
- Reservations are treated separately from active tasks and projects.
- They can be filtered out in reports to show only confirmed assignments by using the toggle labeled "Planned Tasks".
- Alternatively, they can be included to provide a complete view of anticipated workforce allocation.
Drag & Drop Update of Tasks' timing (Start Date, Due Date, Duration, Completion)
Timing attributes of the tasks (issues) can also be edited just by using drag & drop functionality. Switch to edit mode, move cursor over a task and you have several choices to do: 1) move the task on the horizontal line to change its start date and due, 2) stretch or shrink the task to change its duration, or 3) move the rider of the task to change its % completion.
Step back button (Undo)
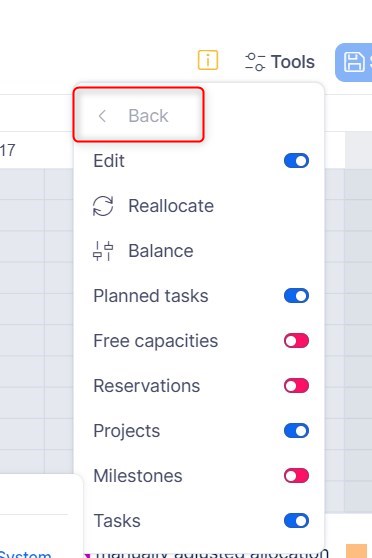
When you accidentally do anything wrong, simply take back an unlimited number of steps you have done just by clicking the "Back" button among the main controls. Do not use the Back button to cancel an unsaved custom allocation or Balance reallocation because it does not work well for this purpose (refresh the page using F5 key instead). An already saved allocation can be taken back just manually by the user.
How to use Problems button
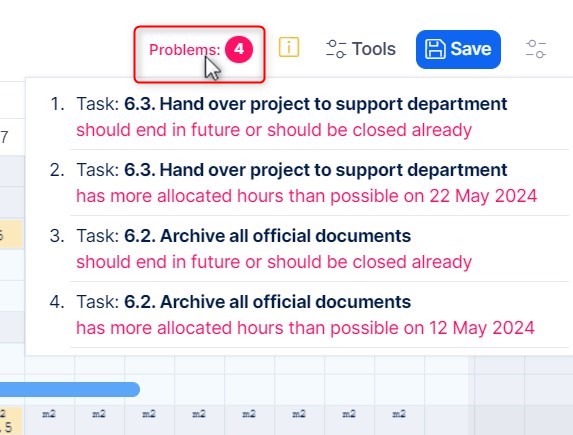
The Problems button can be found among the main controls at the top right. The button is complemented with a number that represents the amount of problems identified as illustrated below. Clicking on the button expands the list of the problems including the names of affected tasks and short explanations. These list items are links so you can click on any and that will highlight the respective task on the timeline. Clicking again on the button collapses the list.
Export options
You can print your tables from Resource management or save them as PDF just by clicking the Print button at the bottom row or pressing CTRL+P, which both open the browser print dialog. Changing or adjusting the export size format is always possible in the printing options. Aternatively, you can use an external PDF creator tool, such as Foxit Reader or PDFCreator.
Resource management on your Dashboard
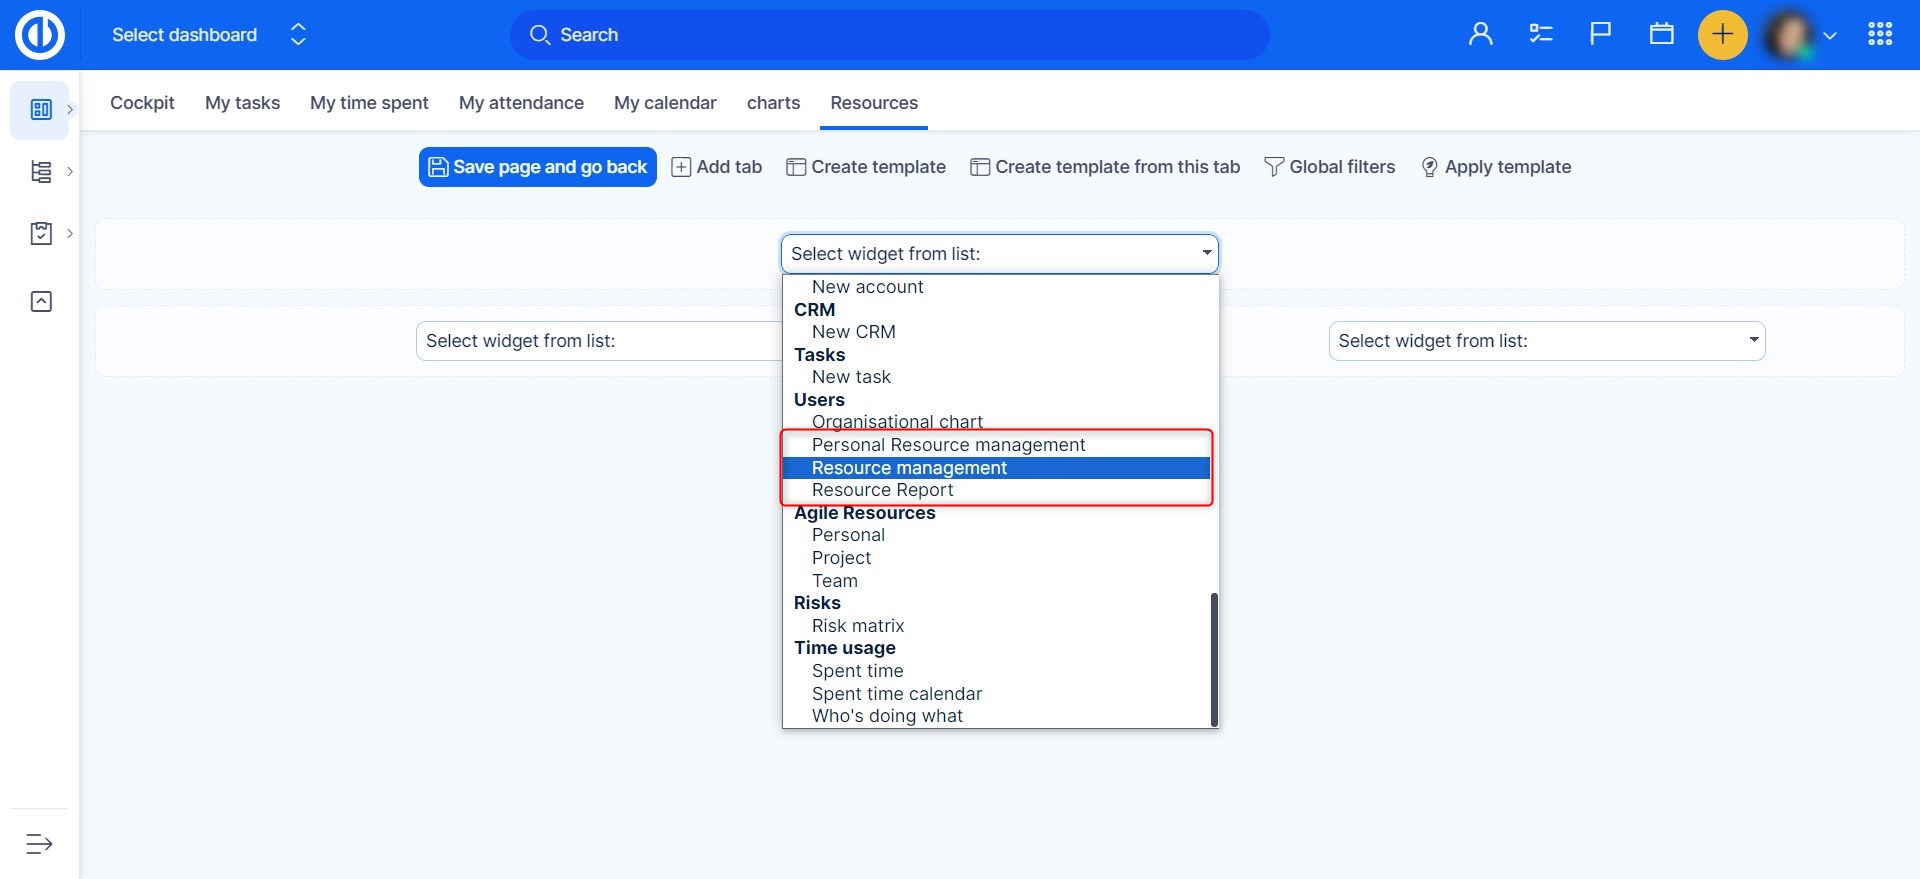
You can add either global or personal level Resource management as the widget on your Dashboard. To do it, click on "Customise" button in the lower left corner and select the particular widget from the list. Then customize your filters of the widget and save it.
Some exceptions apply to the selection of columns:
- Only user with Admin right is able to set columns on “Default filters” page for Personal Resource management widget
- User is unable to edit columns on the dashboard widget themselves
- Zooming with added columns brings visual change where some added columns get hidden , but current user is able to reveal them again.
- This is the case for both the widget and global resource management (even clicking on “Full screen” button triggers the change)
Resource Report
The Resource Report (a report above Resource Management) allows you to quickly create or just check the resource allocations directly from your Dashboard or a Project dashboard without having to open the main Resource management diagram. The main purpose is to ensure more flexible and time-saving resource management and get a better overview of available resources.
This tool serves primarily as a global overview for company management and tells you how well the company manages its resources, for example, in performing work on tasks (process orders), in fulfilling the full potential (capacity) of resources, in allocating the capacity of resources to work, etc. Based on this information, it is easy to find out whether there is an overall good or bad condition in utilizing the workers' capacity and the consequent need of hiring new workers or dismissing the existing ones. It is therefore also an important tool for the HR agenda.
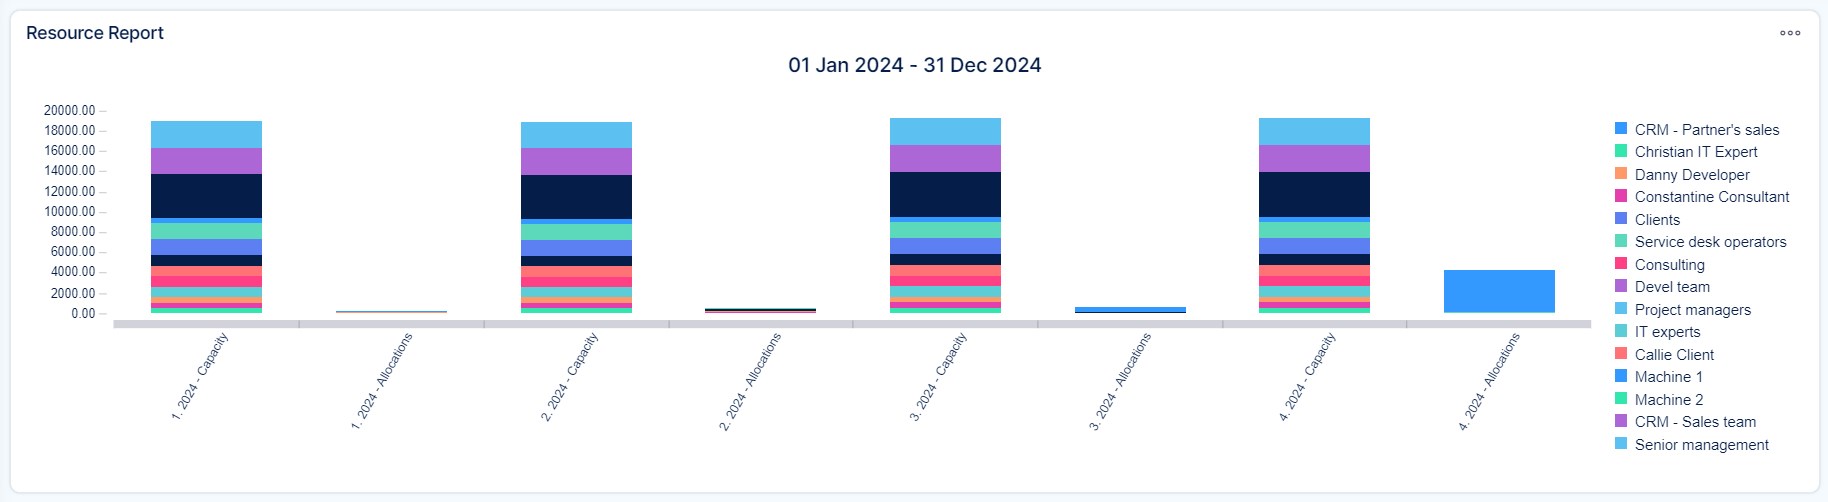
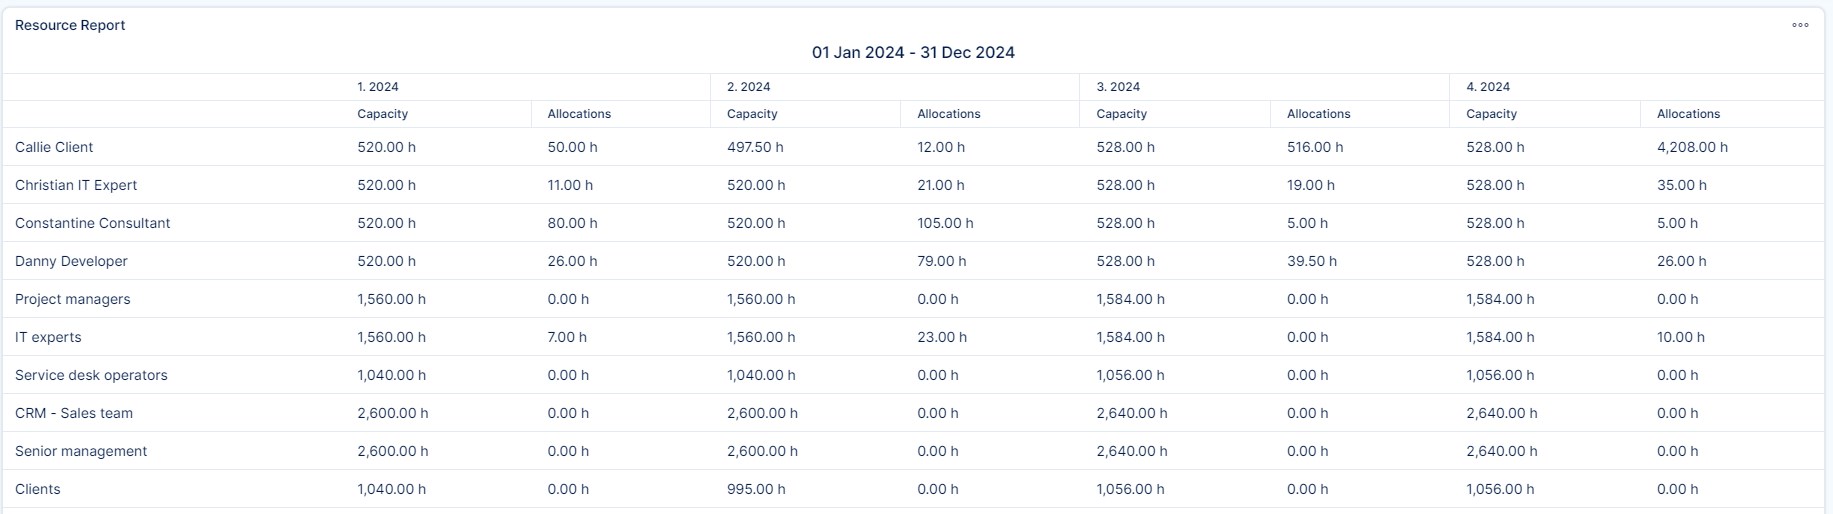
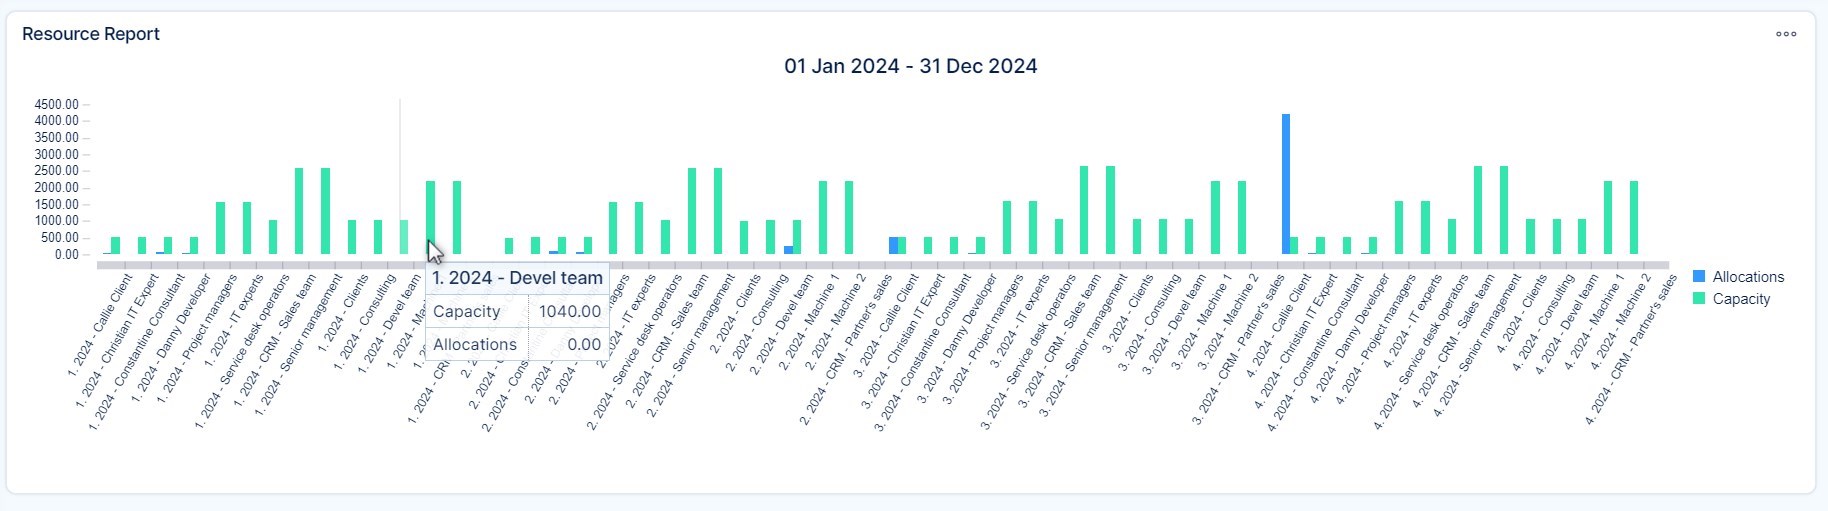
All data visible in the Resource Report is aggregated data from the Resource Management tool, only it is displayed in a different form. No data or calculations come from any sources other than Resource Management. A correctly configured Resource Report can look like this (list output at the top, the chart at the bottom).
A new page widget called Resource Report (under the section Users) is available on any customizable page such as your Dashboard or a Project dashboard. It is a complement of Resource Management plugin and brings:
- Contingency table listing of users and their allocated hours
- Stacked charts
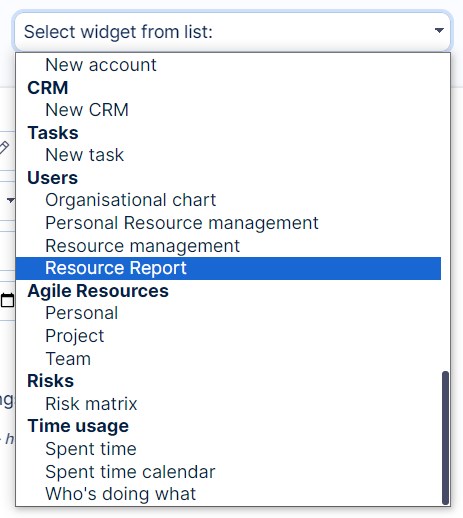
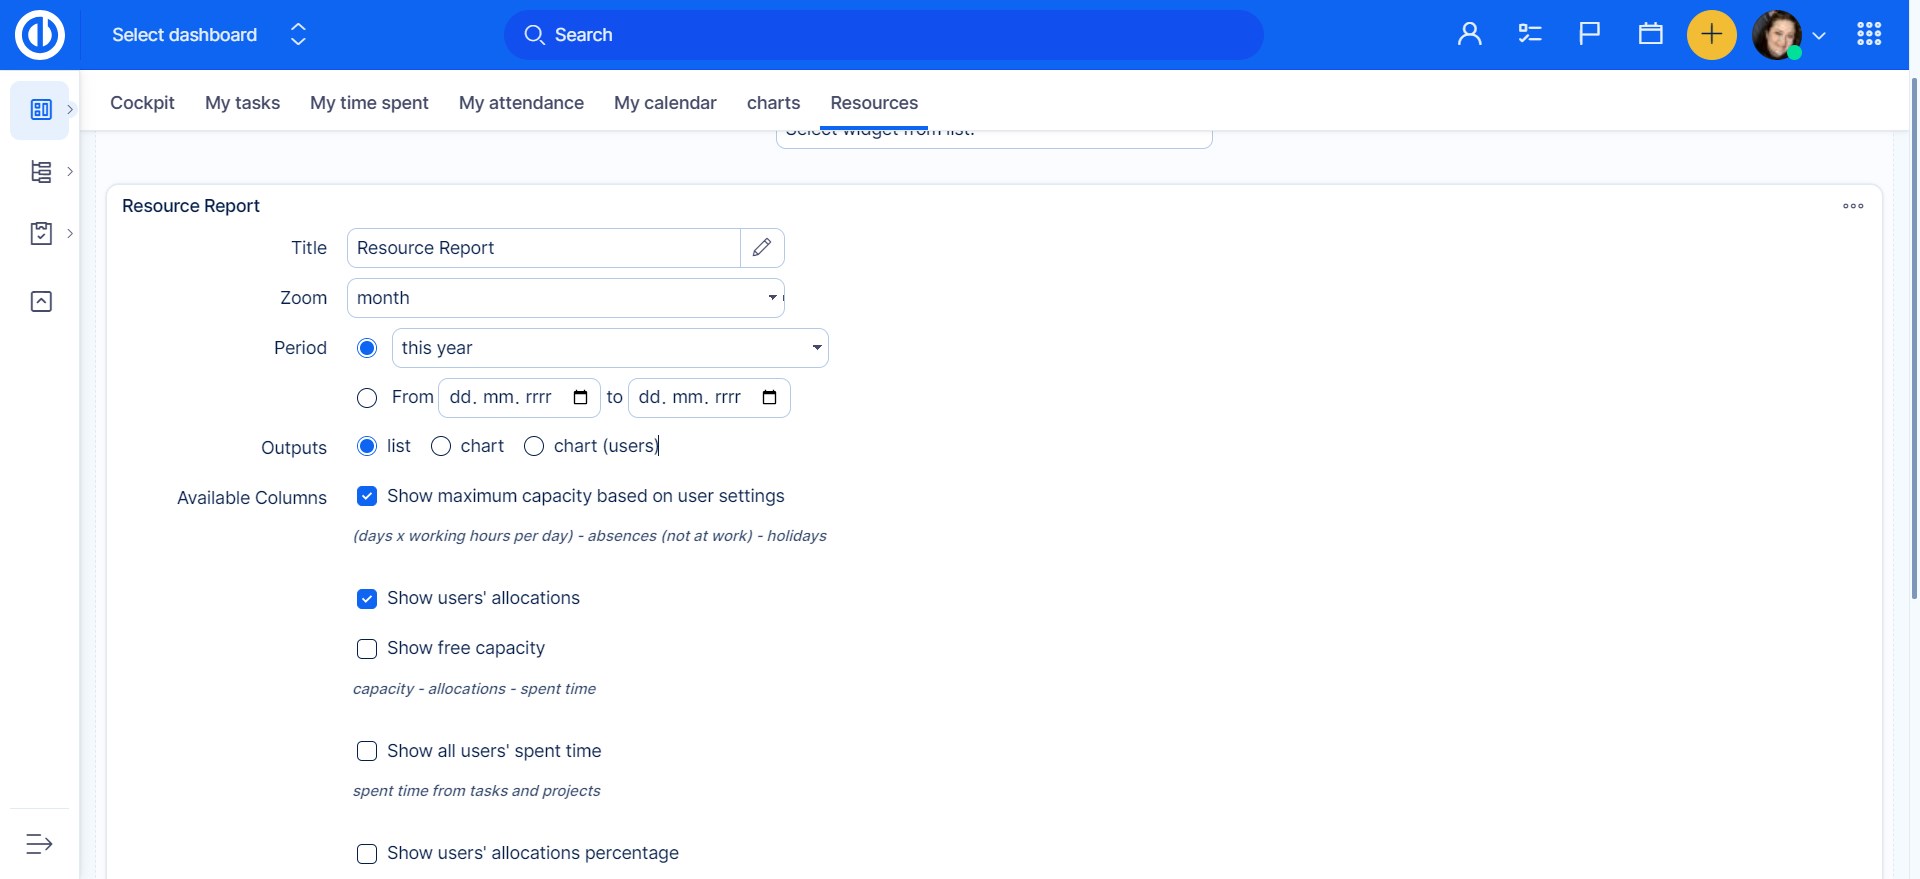
After selecting a widget from the list of available widgets, a blank form appears, in which it is necessary to fill in the following data:
- Title: the name of the Resource Report
- Zoom: the basic time unit of the Resource Report such as day, week, month, quarter, and year; the Zoom value must always be lower than the Period value to display data correctly
- Period: the visible time period of the Resource Report such as the previous month or this year; the Period value must always be higher than the Zoom value to display data correctly
- Outputs: select list or chart as a visible output type
-
Available columns: select columns to display in Resource Report such as:
- Show maximum capacity based on user settings: (days x working hours per day) - absences (not at work) - holidays
- Show allocation + reservations: as configured in Resource Management
- Show free capacity: capacity - allocations - spent time
- Show all user's spent time: spent time from tasks and projects
- Show user's allocations percentage: 100 * (1 - free capacity / capacity)
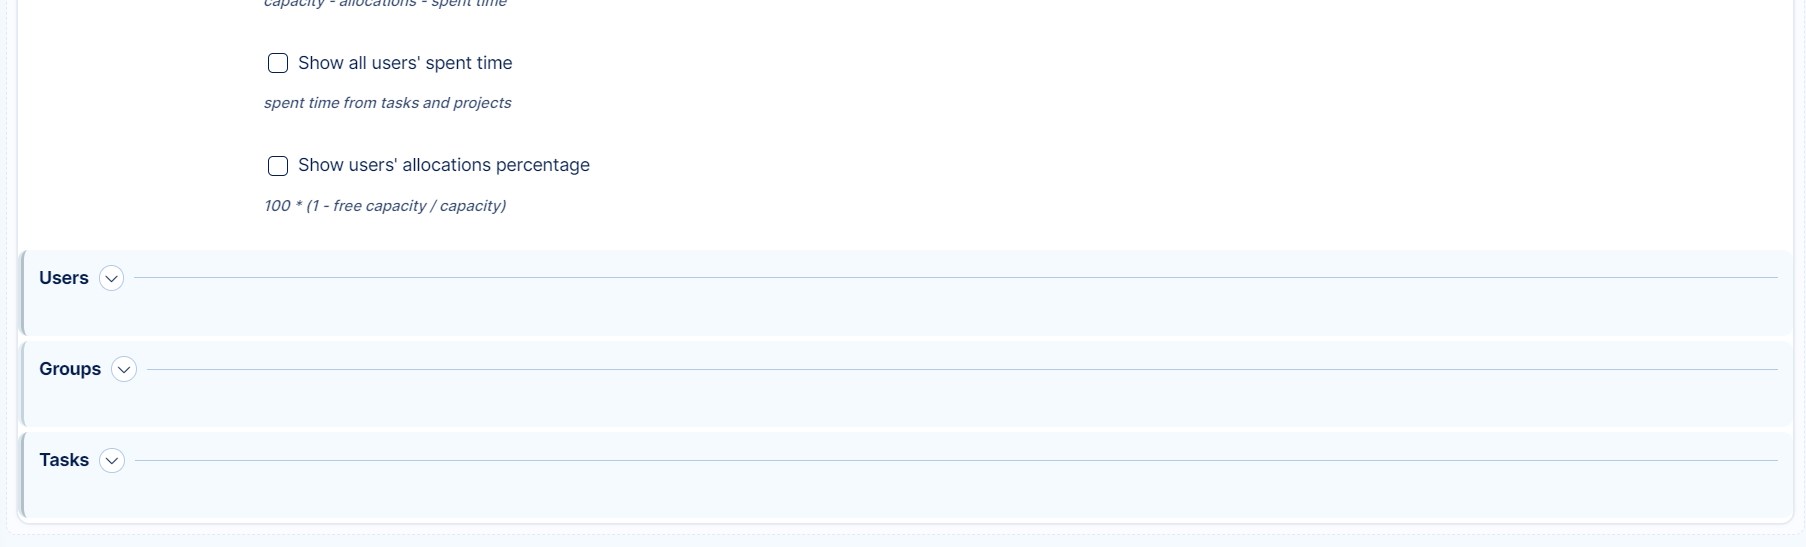
Below on the form, you can add your custom filters to Resource Report. The filtering is possible above users, groups, and tasks. If you do not set up a filter for groups, you will always see them. Filtering allows you to see only such entities you are interested in and omit all the rest. The same filtering is possible in Resource Management as well.
In a created Resource Report, you can display details in a pop-up window by moving the mouse cursor over any column (in the chart output type only). To edit, remove or collapse the Resource Report on a customized page, simply use the icons in the top right corner.
Tips and tricks
How to create skills management tool
Corner situations
- Cross-project relations cannot be visualized.
- The only types of relations that can be visualized are predecessor/follower (green line) and related/blocked-by (blue line).
- Start-to-start (SS) relation is correctly preserved only when the relation is created/changed in Easy Gantt, not from the task update window.
- It's not allowed to add a relation between a parent task and its subtask.
- Between two tasks can be no more than 2 relations (start-start, finish-finish).
- Any combinations of relations leading to a cyclic sequence of tasks (looping) are not allowed. This includes attempting to create a relation with any task that has a parent.
- A task on the timeline cannot be edited so that it starts or ends on the day of the public holiday according to the calendar of the currently logged-in user, even though the assignee of the given task does not have a holiday on that day.
- There can be only one Gantt widget on customizable pages (homepage, project overview, etc.). This includes widgets: Easy Gantt, Resource management, Personal Resource management - if one of these is active, no other will be shown on the same page. This is due to page loading speed. A workaround is to put these widgets on different tabs of customizable pages.
- If a task contains custom allocations, these will get lost after the task is closed and reopened. The new allocations are calculated according to the default allocator.
- When editing a task using the Quick task editor in Resource Management, the changes will not be saved unless the user clicks on the Save button in the top right corner of the timeline window.
- The edit option of the estimated time for a specific project in Resource Management is disabled if the Spent time module is not activated for that particular project.
- The default filters setting for Resource Management on the project level is taken over from Gantt's default filters setting on the project level. Therefore, the default filters on the project level are always the same for both Gantt and Resource Management.
- Task edit using the context menu (right mouse click on a task in the list) in Resource Management is only possible when the user has the permission "Edit tasks". This feature is not related to permissions "Edit tasks where the user is the author" and "Edit tasks assigned to user".
- While editing Estimated time via Quick task editor, you will be enabled to use a comma, but a comma is not compatible with Resource management. We reccomend using a period in order to get correct behavior of allocations.
- Meetings imported via ical from external calendars will not appear in Resource management.