Key features:
- Customizable graphs and charts for all the listings
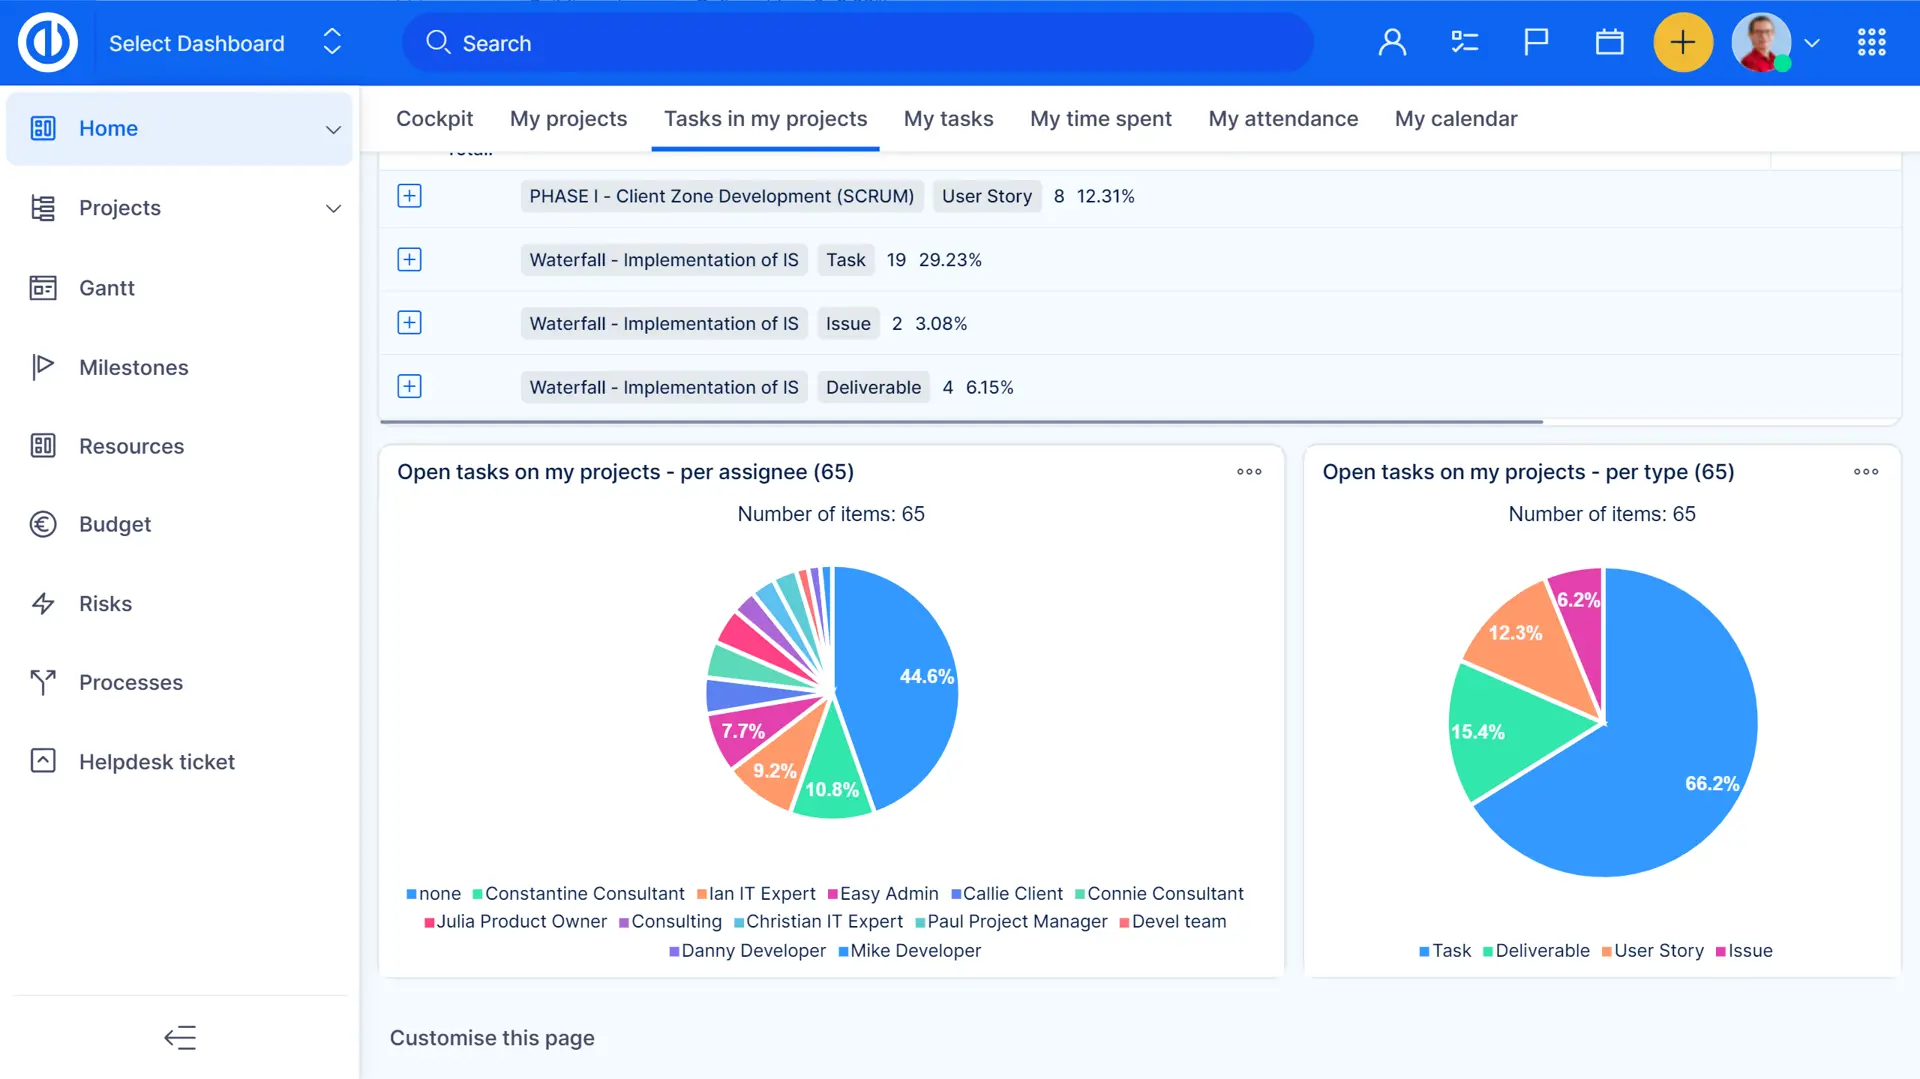
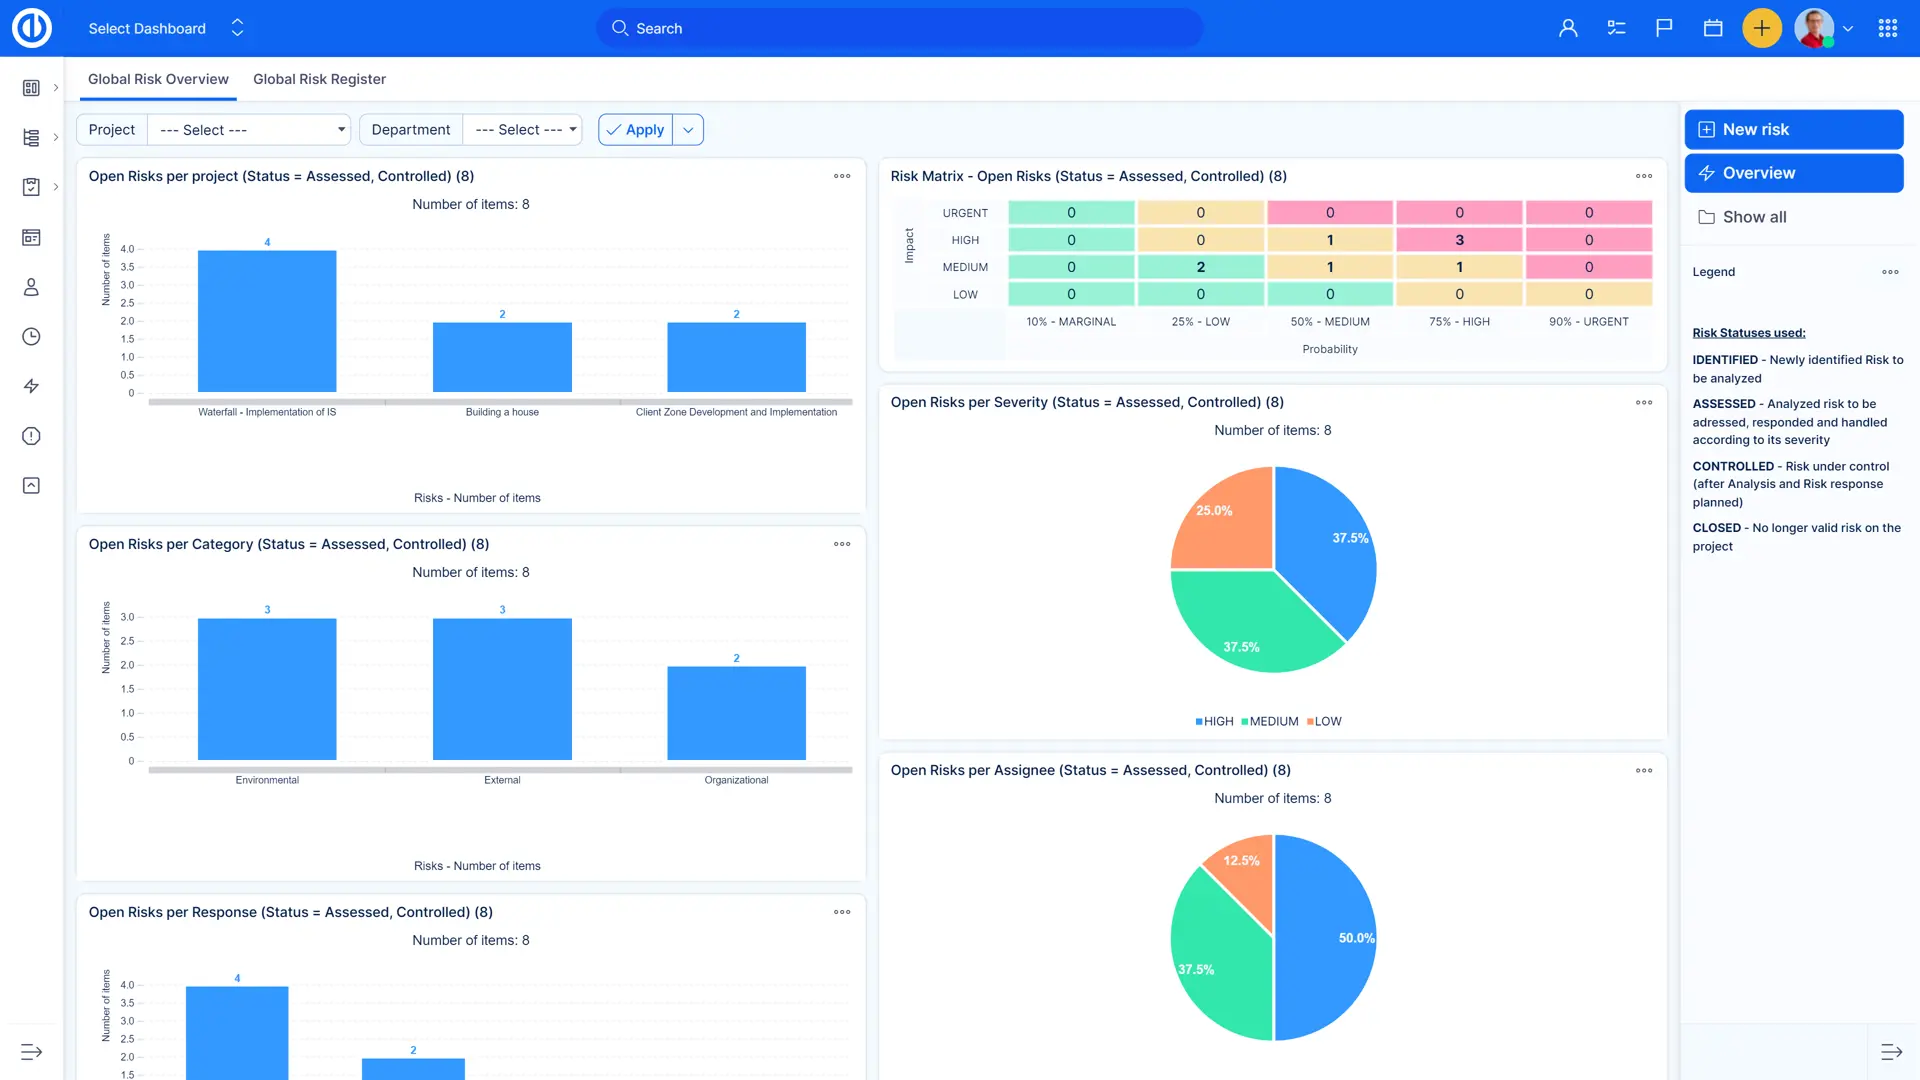
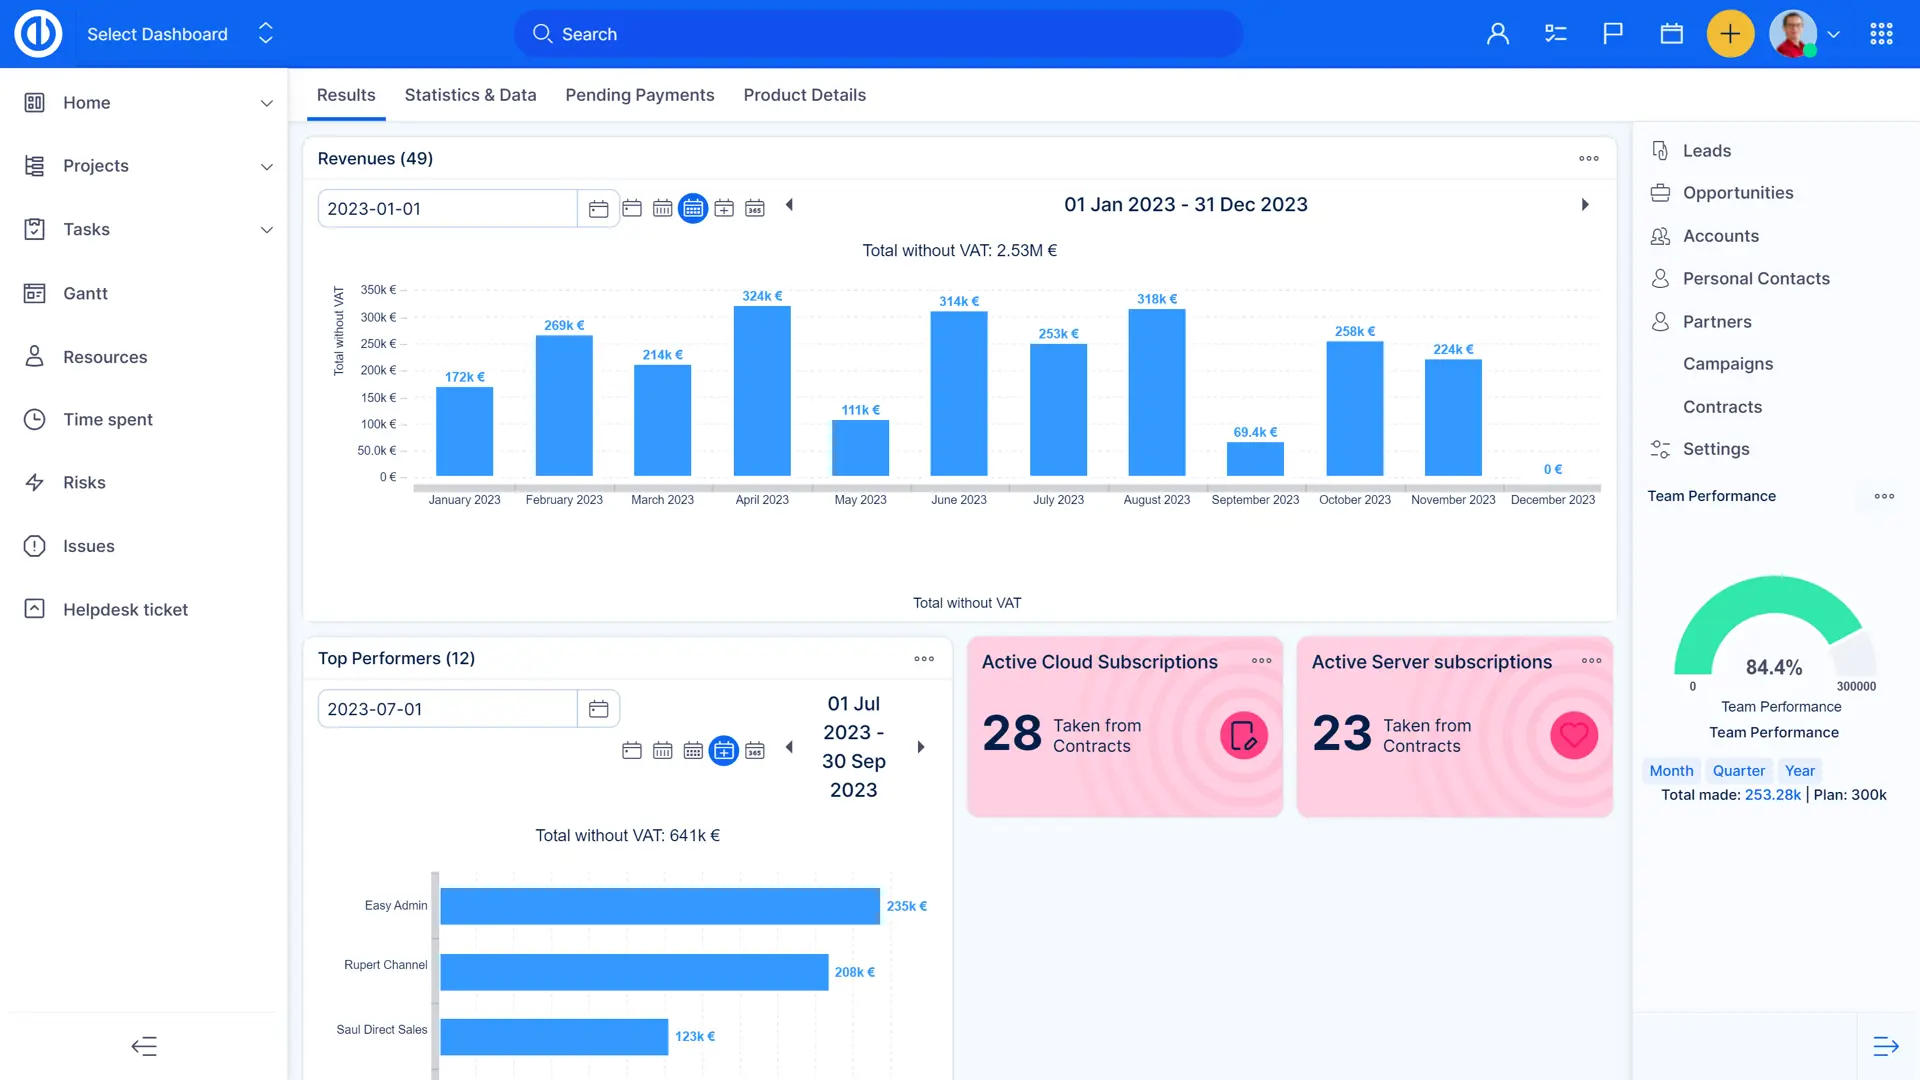
- Pie, bar and line charts and gauge diagrams with legends
- Available on all personalized pages
- User-friendly settings
- A broad variety of supported formats
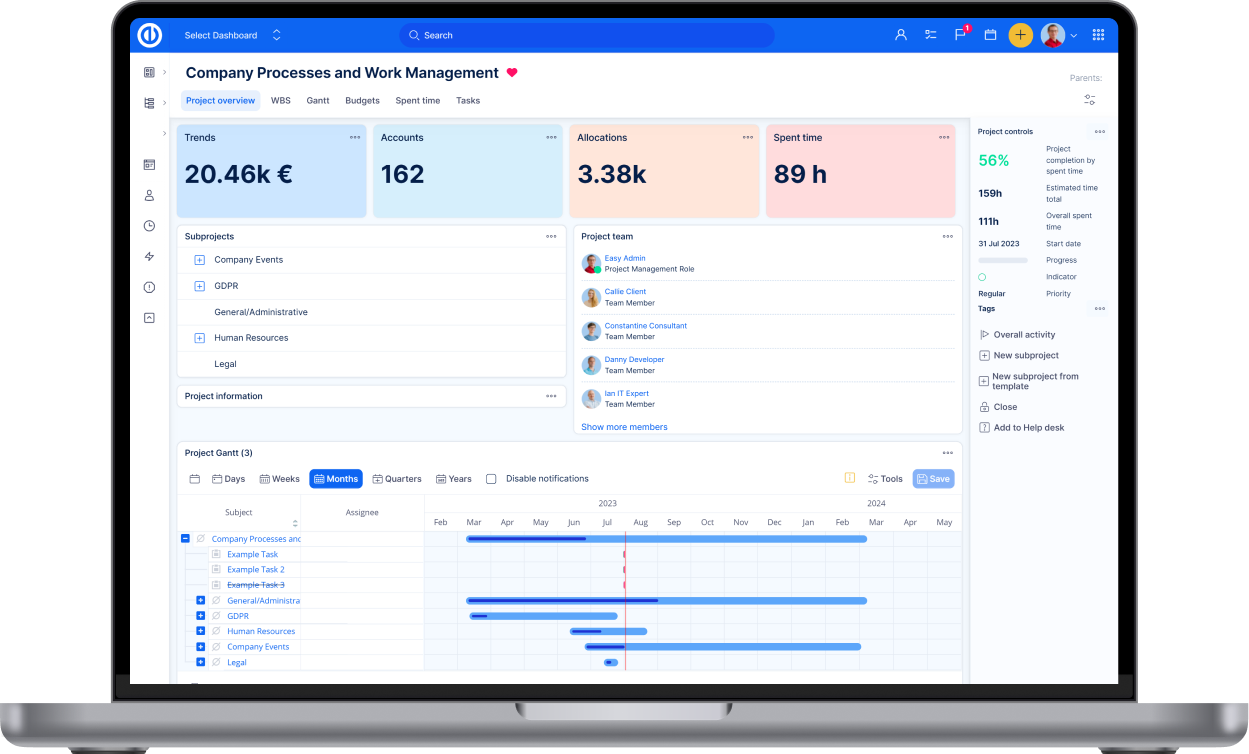
Visualize available statistics using pie, bar, and line graphs. Create charts from any list of entries, and in just a couple clicks, prepare a report on your project’s performance and demonstrate what needs to be improved.

Combine project management, tasks, ITSM, and source code management in a single unified software.
Enhance productivity with secure, on-site AI that summarises, and transforms notes into actionable tasks.
Choose on-premises deployment or utilise an ISO-certified cloud. Open-source code audits guarantee exceptional security for your intellectual property.
Use Easy Project's real-time, flexible reporting tools to make informed decisions.
Product

Features


Access all features, SSL protected, no credit card required.