How Easy Project Helps You Manage Project Finances in a Visual Way
The good news for you is that Easy Project can provide a lot of help in order to visually manage the project's finances so that you always have a clear picture of how much money is involved. Here we present some Easy Project finance features and tools you might use if you want a visual representation of your project's finances as you manage them.

Easy Project contributes significantly to increasing project profitability through the projection of portfolio financial statements and project budgets, which are very easy to use.
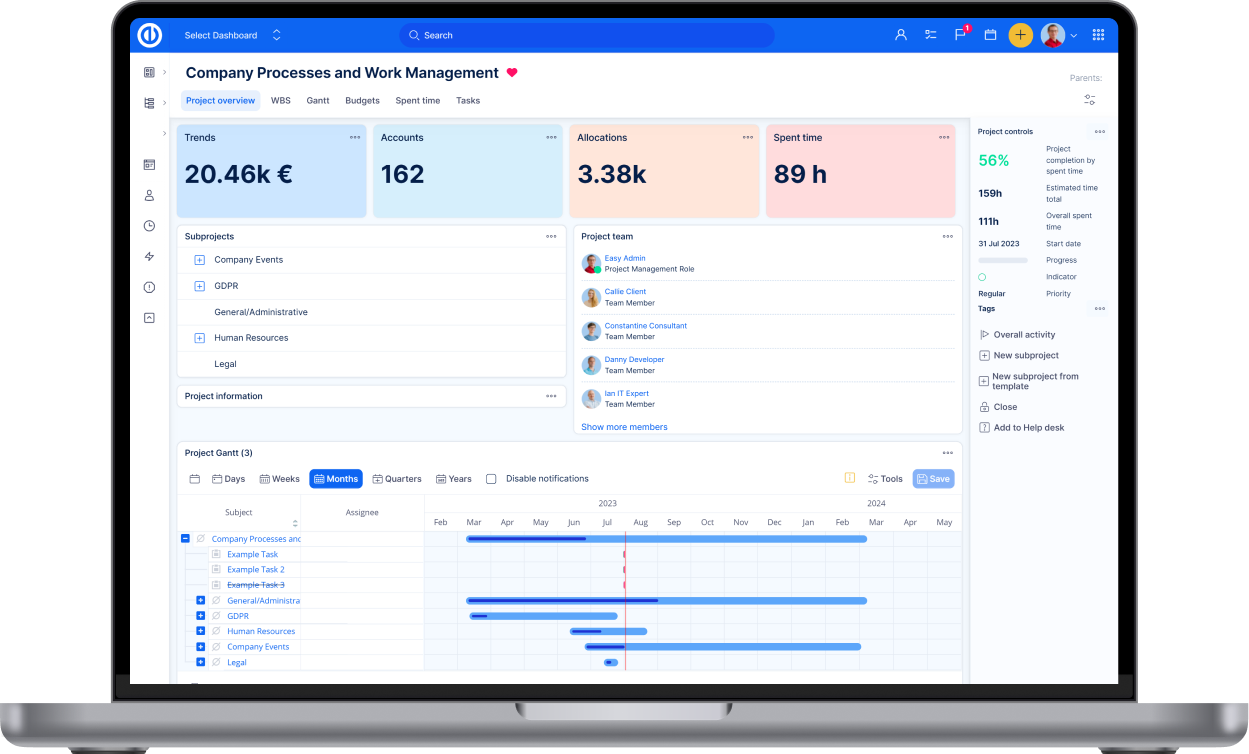
Work Breakdown Structure (WBS)
A basic project management technique in Easy Project, Work Breakdown Structure (WBS), manages the decomposition of the project into parts that are deliverable. What the WBS plug does is visualize all tasks of a project in mind map view and allows you to create project structure easily – project’s decomposition. In Work Breakdown Structure, you may create new project tasks while you see the entire project’s structure.
There is no doubt that the Work Breakdown Structure helps to make Easy Project project planning and project finance management very easy and visual as well!
In addition, the Work Breakdown Structure Feature also lets you visualize the Easy Project project according to tasks’ status, assignee, % done (percentage), tracker, and priority.
You should definitely give the Easy Project Work Breakdown Structure feature a try! It is the best tool for project management, finances, and planning in Easy Project.
Important Features:
- Drop and drag sorting of projects and issues
- Mind map visualization of the issues, projects, and sub-issues
- Creation of issues from the mind map
- Recognizable keyboard shortcuts from other tools of a mind map
- Color visualization of trackers and issues completion
- Zoom in and zoom out
- Step Back Button
Cost Breakdown Structure (CBS)
As stated before, you can manage project finances visually in an Easy Project's project. In order to have a Cost Breakdown Structure, you should activate both Budgets and WBS (Work Breakdown Structure) features on your projects. All WBS finances are based on the data of project budgets where you have costs/incomes and personnel expenses in reality and plan. This feature happens to be most useful and practical during the budget setting phase in the project planning stage and continuing project finance monitoring.
Important Features:
- No requirement to switch between cost breakdown structure and work breakdown structure
- The swift and easy visual insight into all project-related finances
- The creation of new expense/income from mind map
- Print the mind map and include budgets for every task and project
- Clear color visualization of a negative, positive and neutral balance of your project budgets
Project Budgets
It is an immensely useful feature that visually monitors costs, revenues, payroll expenses, costs, and the project’s final profit. In addition, it also enables you to monitor real cash entries in context with the established plan and provides projects’ loss/profit statements.
Important Features:
- Monitoring of costs, revenues, payroll profits and costs, reimbursements, and travel expenses
- Project budget reality versus budget plan
- Payroll expenses are determined from the time each worker spends multiplied by hourly rates
- Internal and External hourly rates
- Definition of work hourly rates by members, activities, and roles of the project team
Gantt Chart Cash Flow
Your Gantt Chart’s cash flows are a very valuable Easy Project tool that is most practical for an immediate outline of project profitability over the passage of time, improved balancing of cash flows across Easy Project projects, and for comparison of actual and planned flows of cash.
Important features:
- Illustrates all the cash flow balances right in the Gantt chart
- Illustration of Balances / individual projects in respective project bars
- The Money module is needed to edit and see these balances
- Shows details and information per subprojects
Finance Management Dashboard
Predefined dashboard (personal) appropriate for the role of a Finance Manager is designed specifically to offer an awareness of existing performance pertinent to finance management.
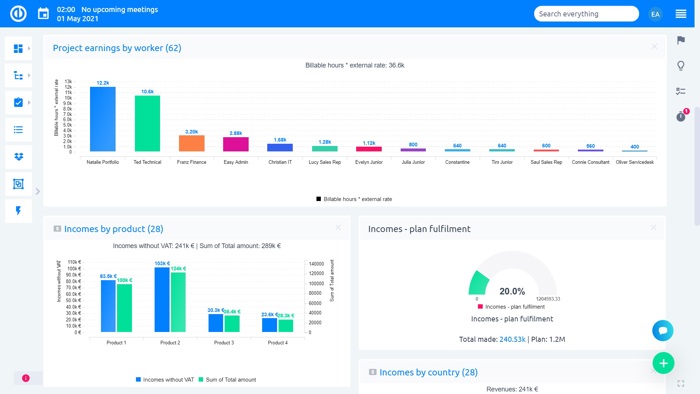
Finance Dashboard in Easy Project
Important Features:
- Continuous tracking of all aspects of financial performance over a time period
- Common financial KPIs like incomes, earnings, costs, expenses, etc.
- Shows the difference between the total charges and total costs for a defined time period
- The heads-up information, right at your fingertips, can be further utilized to reveal trends over a time period
- May serve as your central workspace for finance management
Bottom Line
Managing project finances visually in Easy Project is doable with the aforementioned features and tools. Use them together to keep track of all your margins and stay ahead in your business.

Visual finance management? Easy.
Get all powerful tools for perfect project planning, management, and control in one software.