Webinar Recording: Gantt Chart 2019 for Easy Project Management

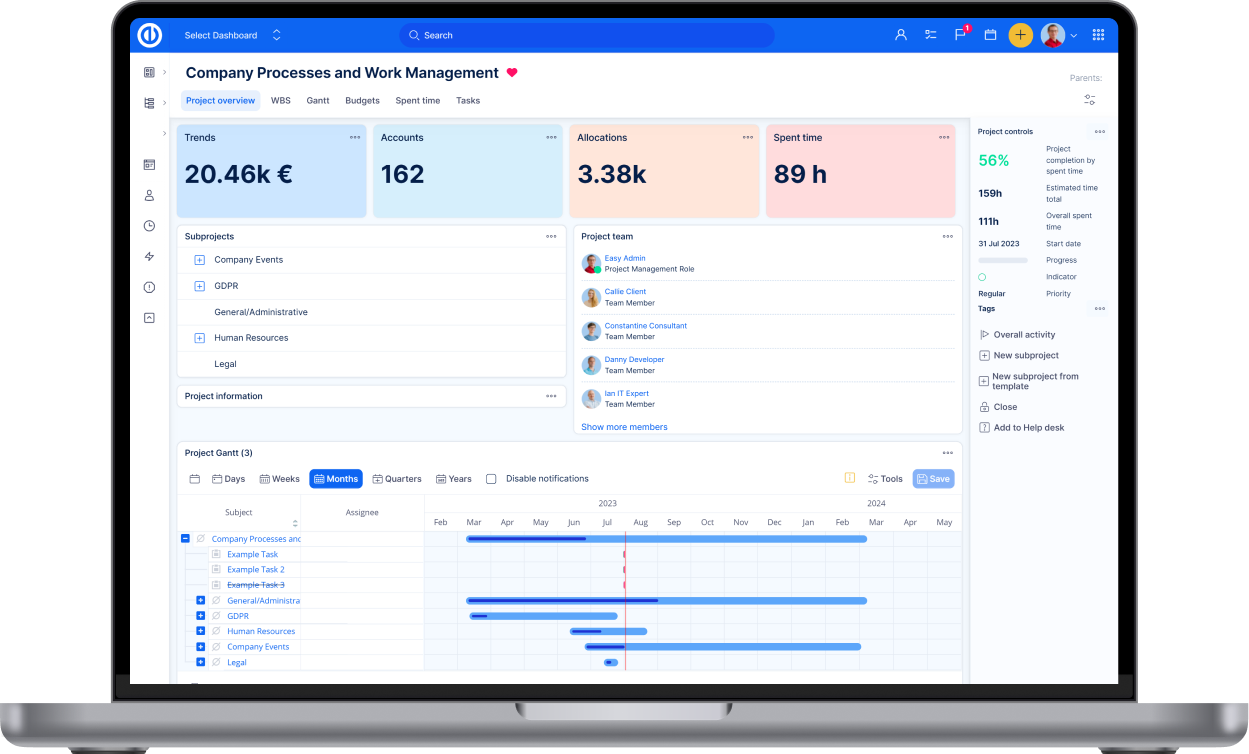
Easy Project Gantt chart represents a graph with rectangular stripes and additional symbols that indicate work elements (tasks, projects, milestones, etc.) and their interdependencies (relations). The length of each column is proportional to the time value required to complete individual tasks or projects in the Work Breakdown Structure (WBS). In the Gantt diagram, you can compare the duration of two or more tasks very easily and quickly.
The resulting constellation illustrates the project plan. Gantt chart fully complies with IPMA and PMI standards. Especially useful and important is this tool for project managers and human resources departments that gain a clear overview of the sequence of events (tasks) while reducing the likelihood of overloading team members.
Why you need Easy Gant chart
Gantt chart is important because everything that forms the internal structure of the project is clearly displayed on it. In addition, it shows the dependence of different tasks within the project. Teams can use the Gantt chart to replace appointments over project status updates because everything essential can be found on one screen. A clear positioning in the chart allows simple visual control to help team members understand progress in tasks and entire projects.
With Gantt chart, work teams can tactically plan projects so that the main workload is focused closer to the scheduled start date, due date or evenly throughout the project timeline. No matter which of these tactics you choose, all team members will always find useful overviews to help them integrate their own work habits into the overall project plan.
The way to create a Gantt chart as you need it begins by defining and integrating the required tasks (issues). Then you can customize specific columns with the information you are interested in, timeline units (days, weeks, months), filters, etc. Thereafter, you select which items depend on others and when what tasks (issues) occur. For each activity (task), specify how many hours it will take (estimated time) and who is responsible for it (assigned user).
Finally, specify the time during which the task will be processed (start date, due date). The main advantage of this technique is its good visual overview, which is easily understood by virtually all project participants and third parties too. Learn more about the Gantt chart on the landing page.

All-in-one software for a modern project manager? Easy.
Get all powerful tools for perfect project planning, management, and control in one software.