Project Controlling & Reporting
The project control and reporting process should run throughout the project. Effectively setting up a project control process will enable you to keep an eye on cost and schedule as things shift and evolve throughout the project. It’s the key to navigating your project through rough waters—and it will save your project from going off the rails.

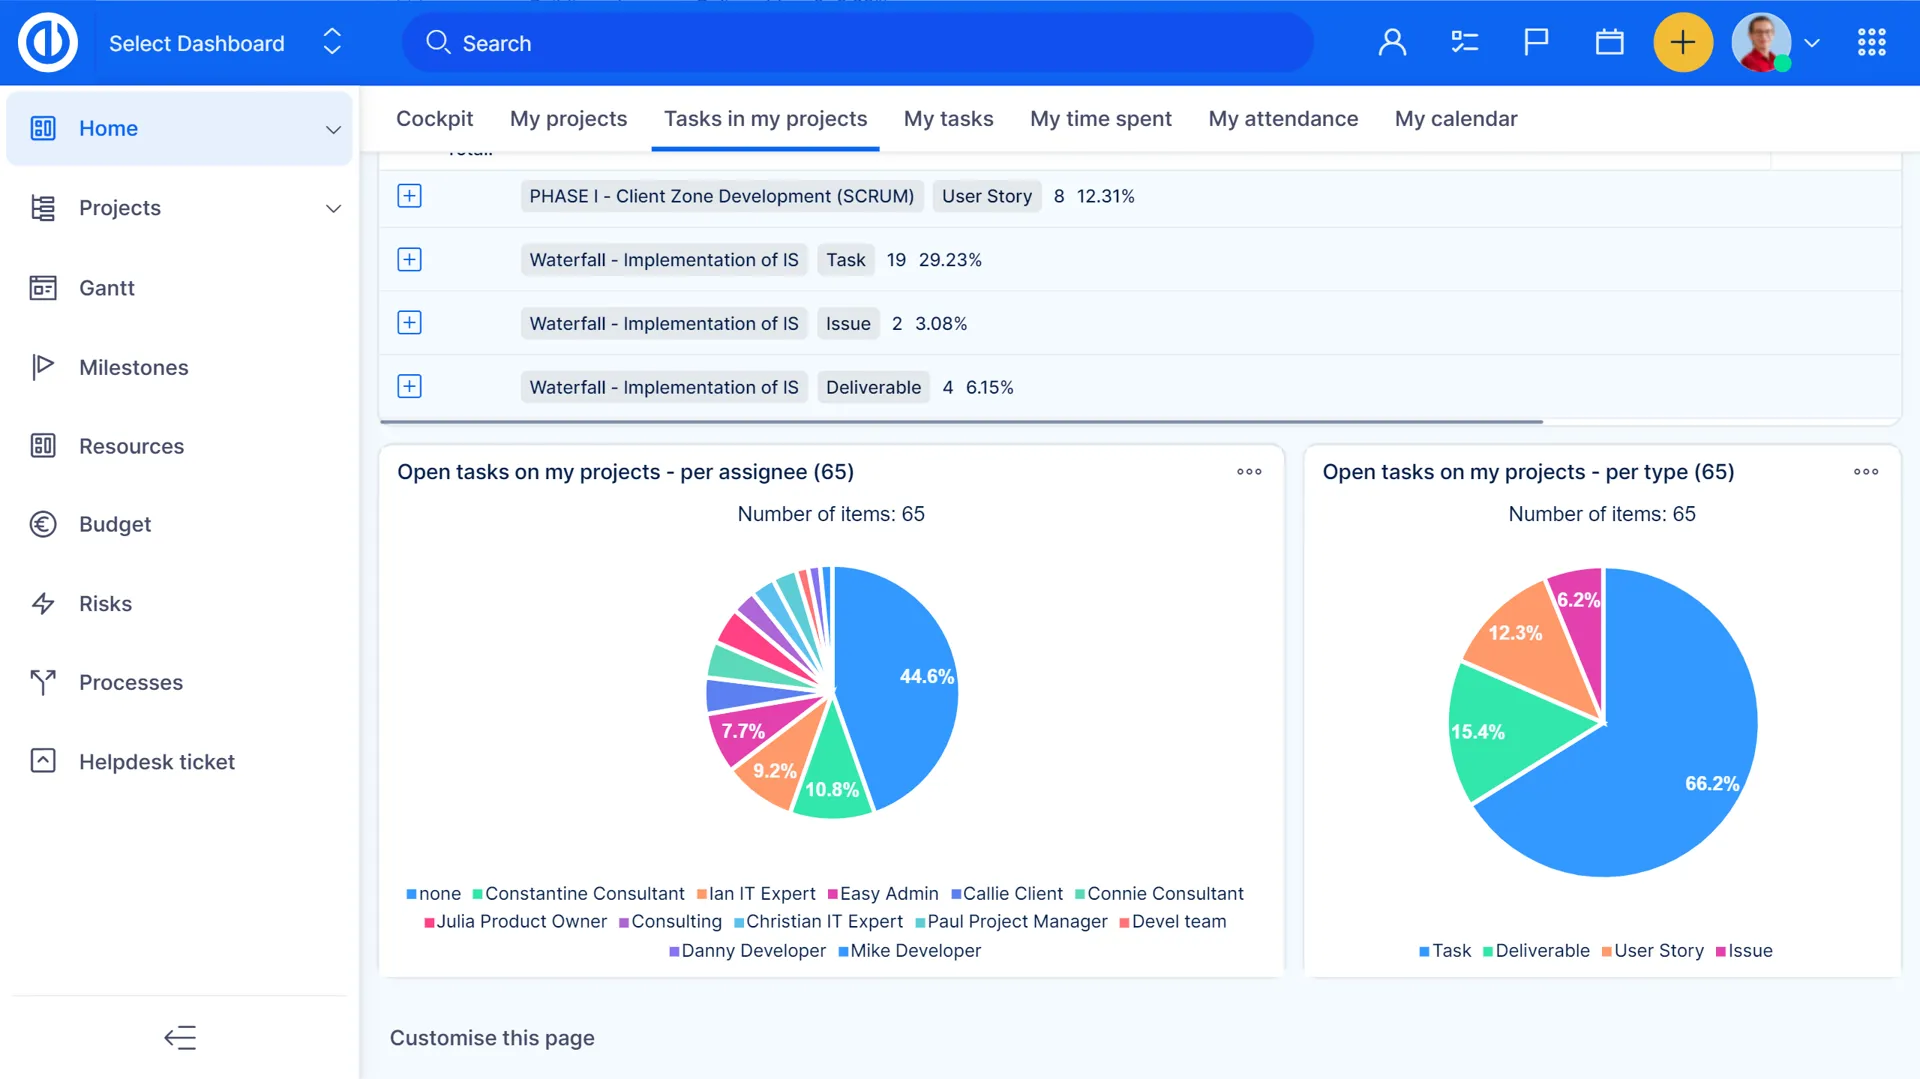
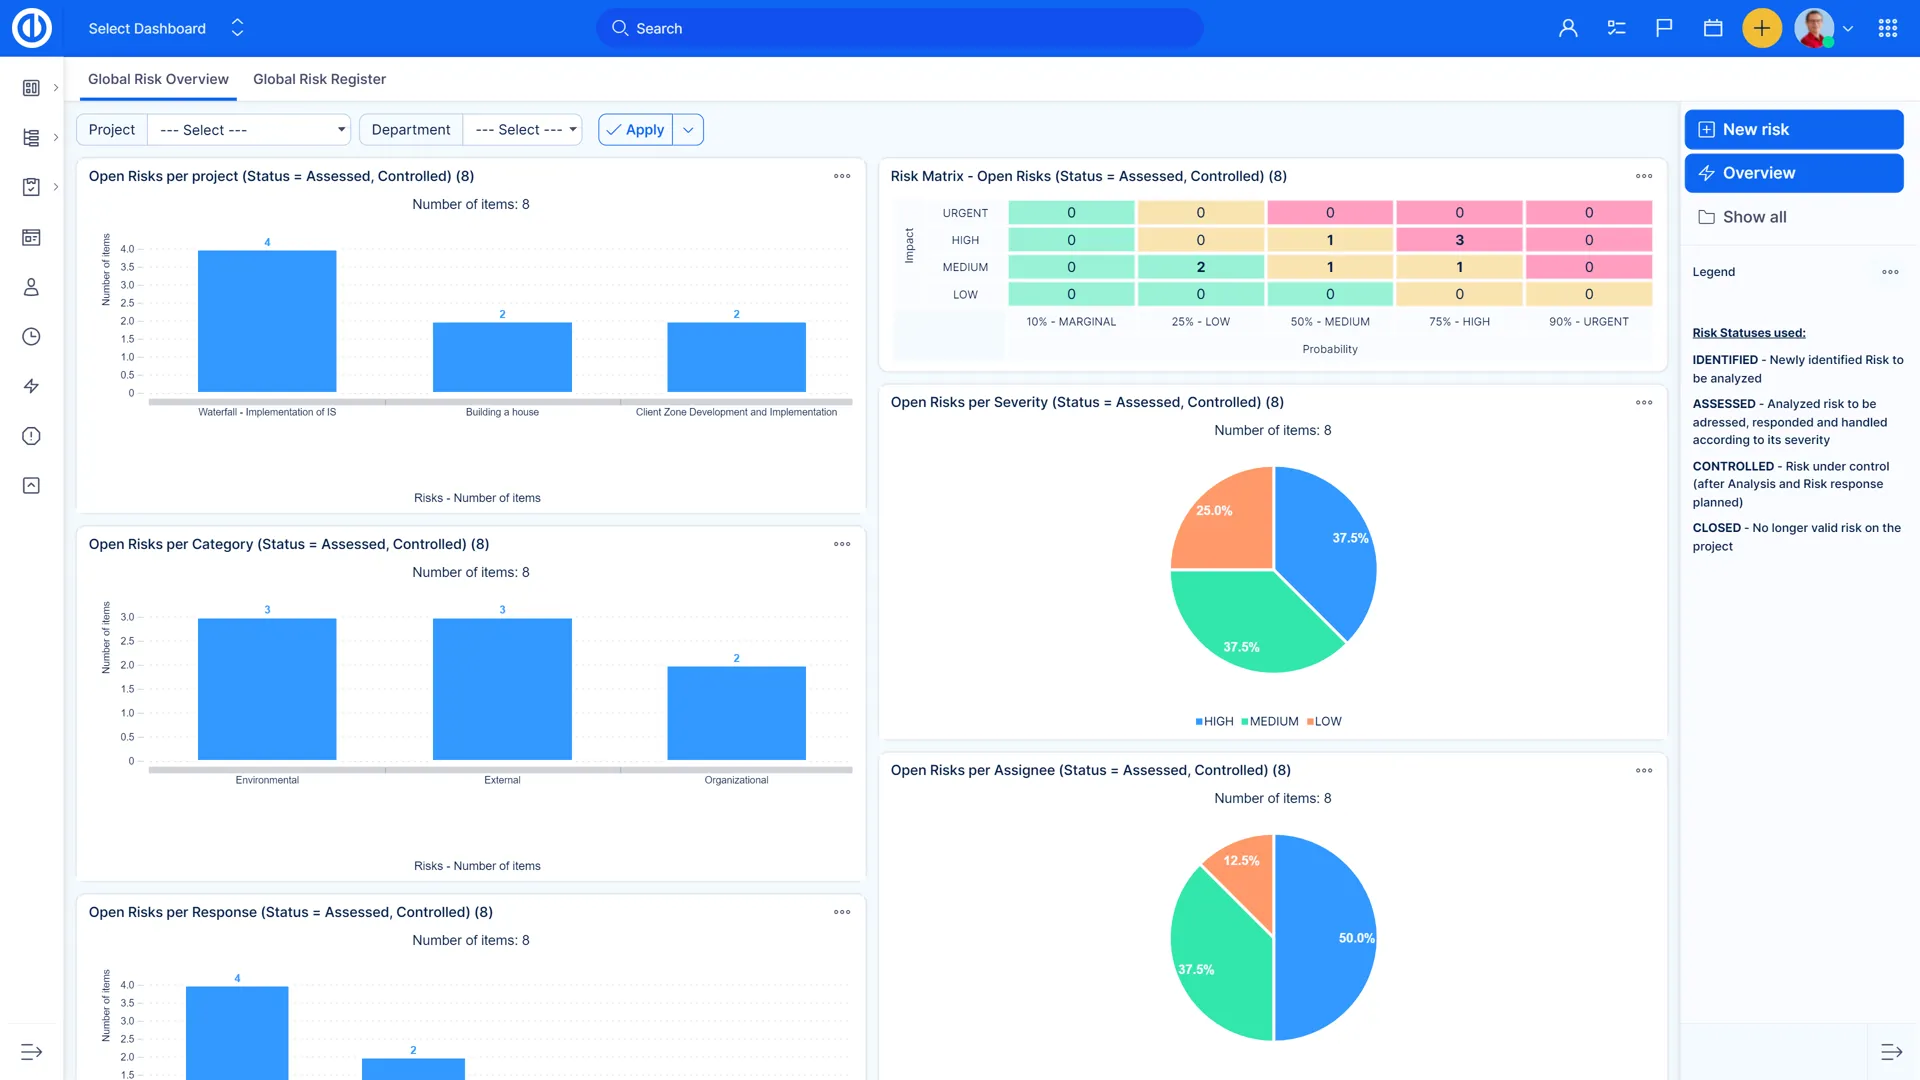
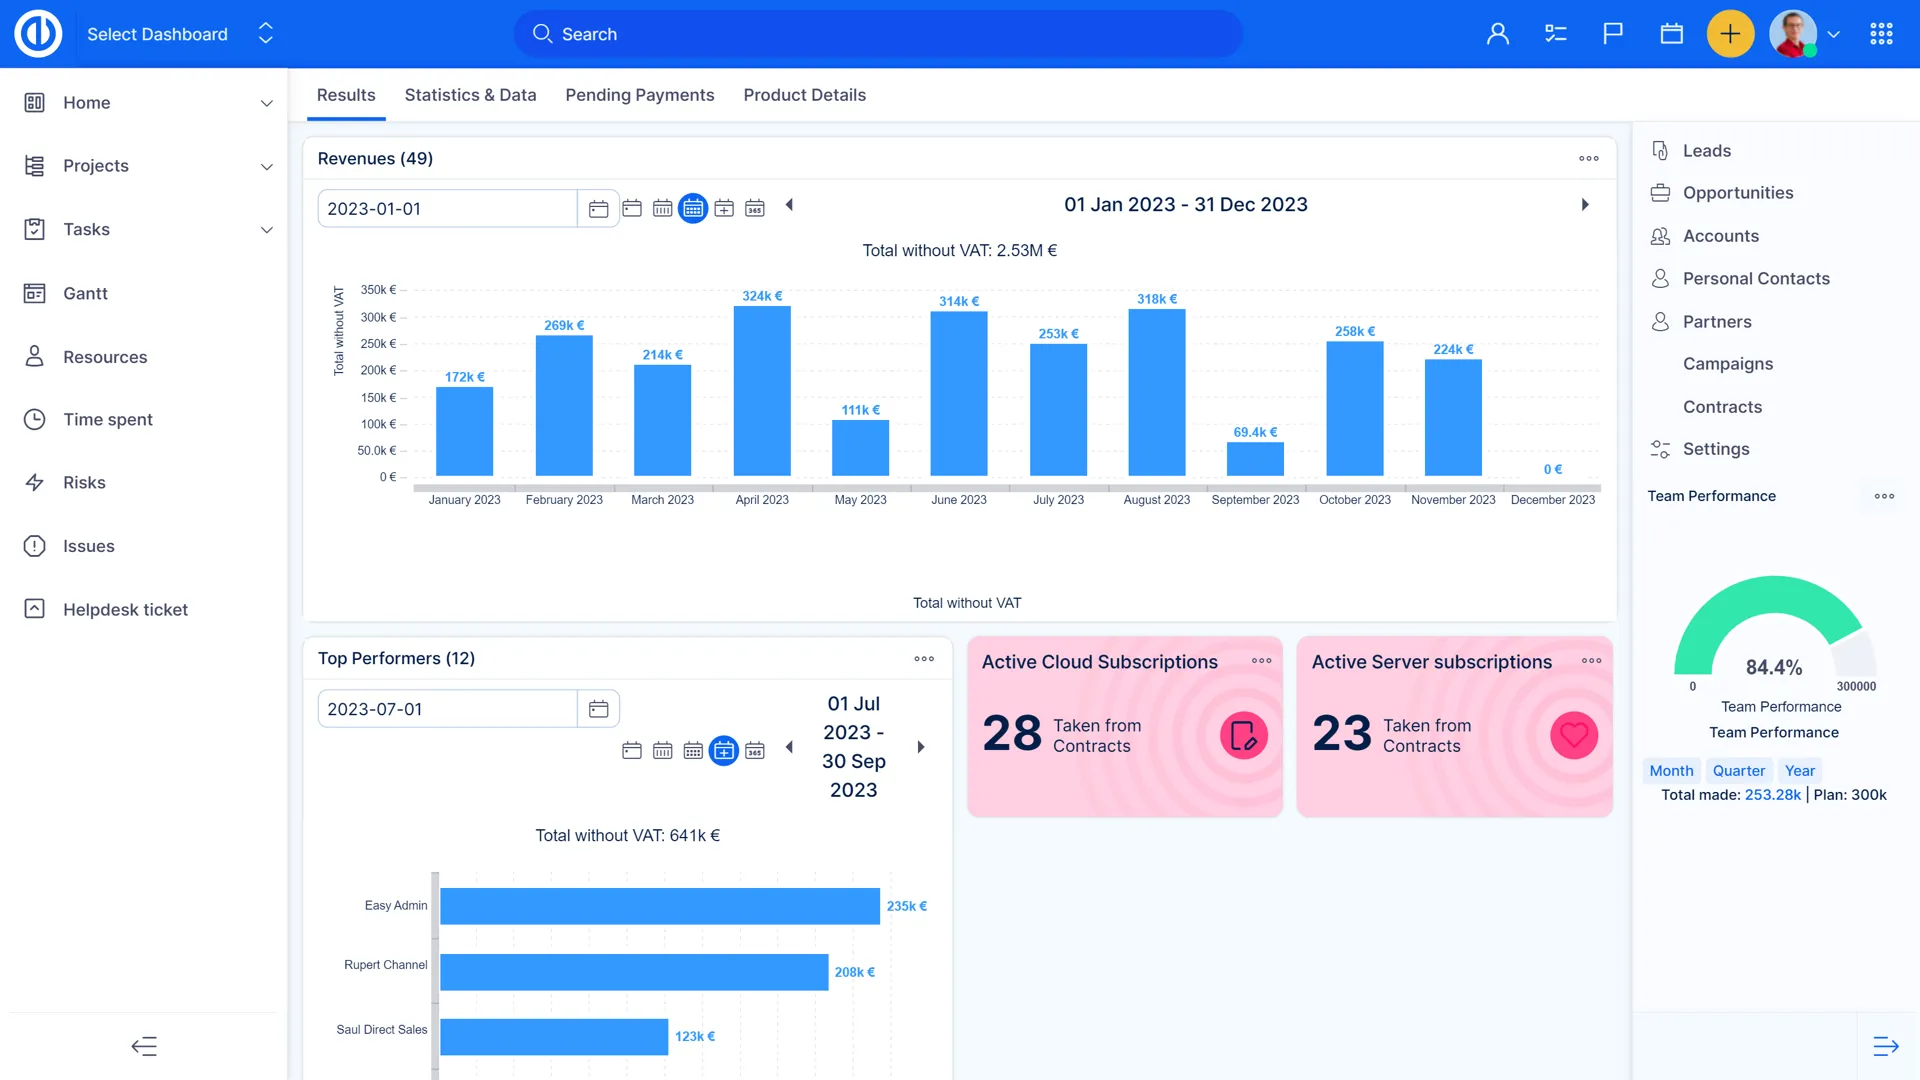
Reporting tools – graphs & charts
Visualize available statistics using pie, bar, and line graphs. Create charts from any list of entries, and in just a couple clicks, prepare a report on your project’s performance and demonstrate what needs to be improved.

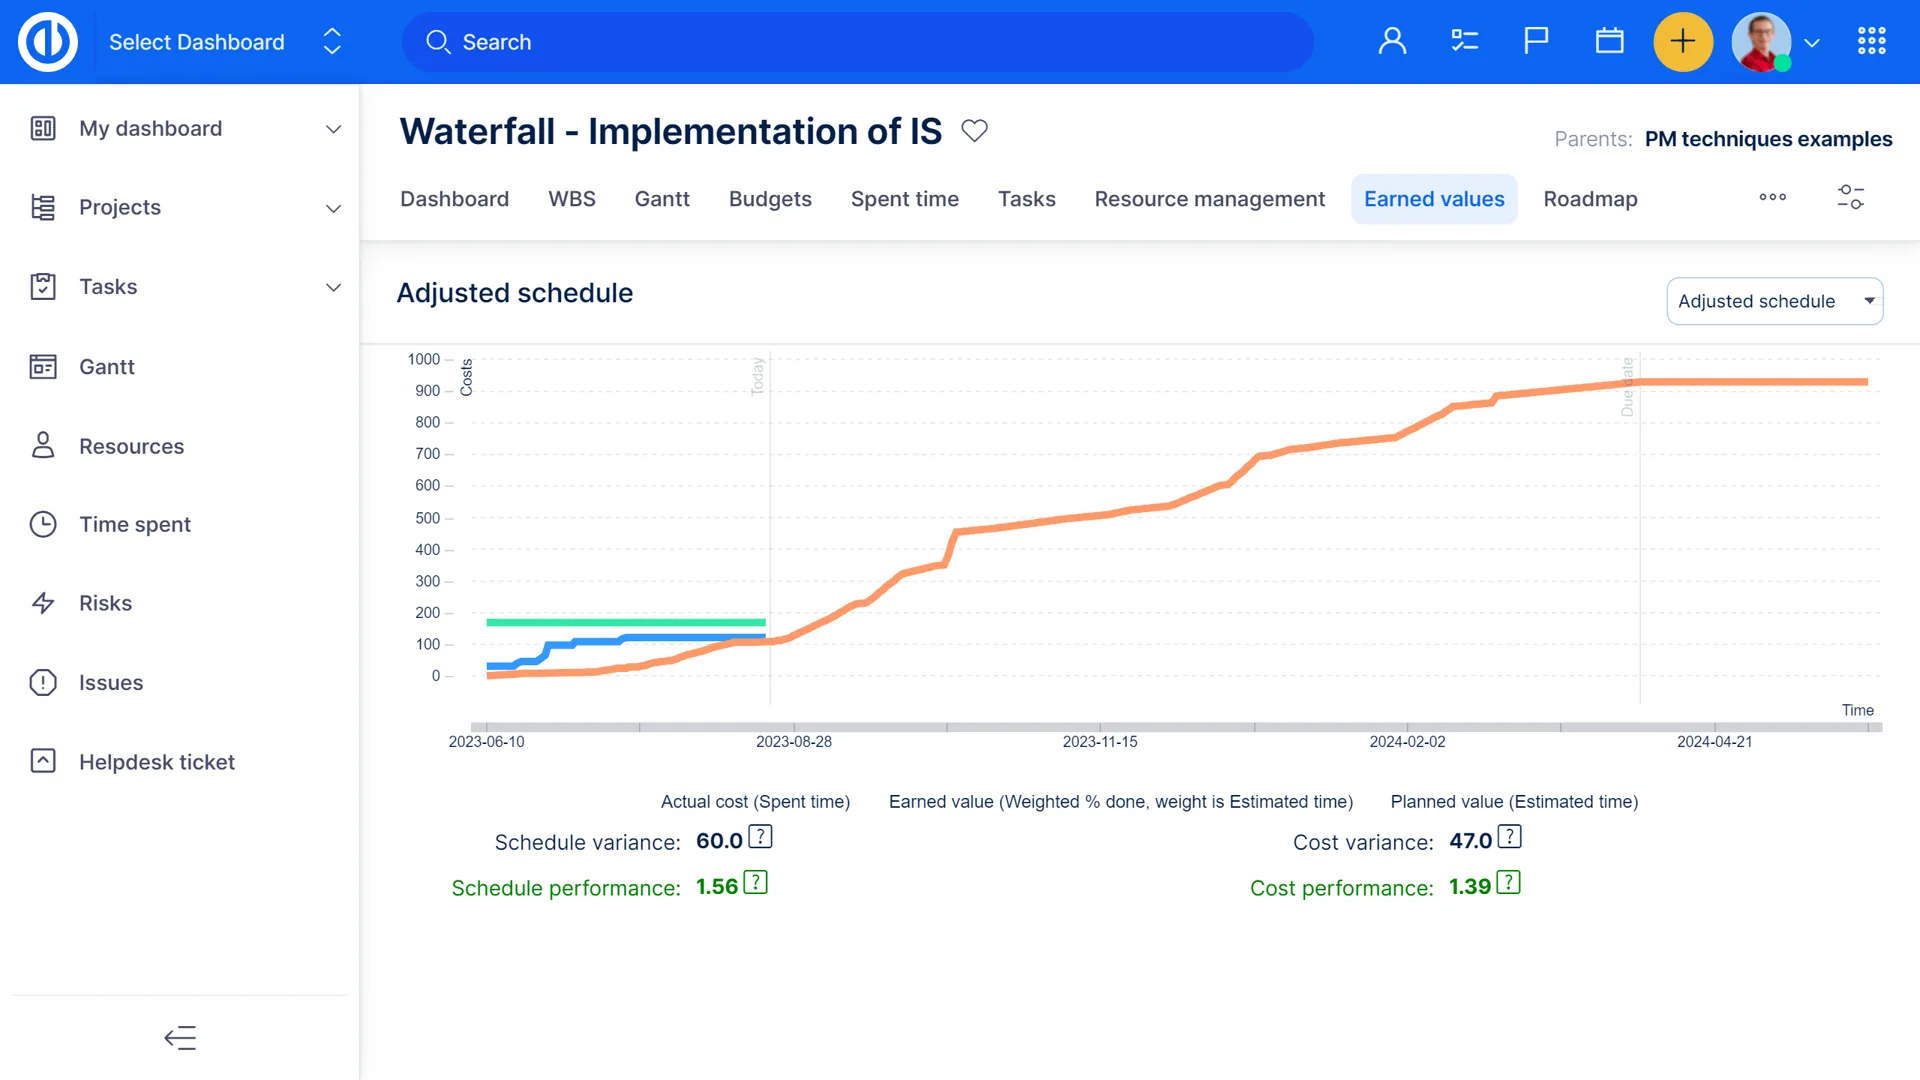
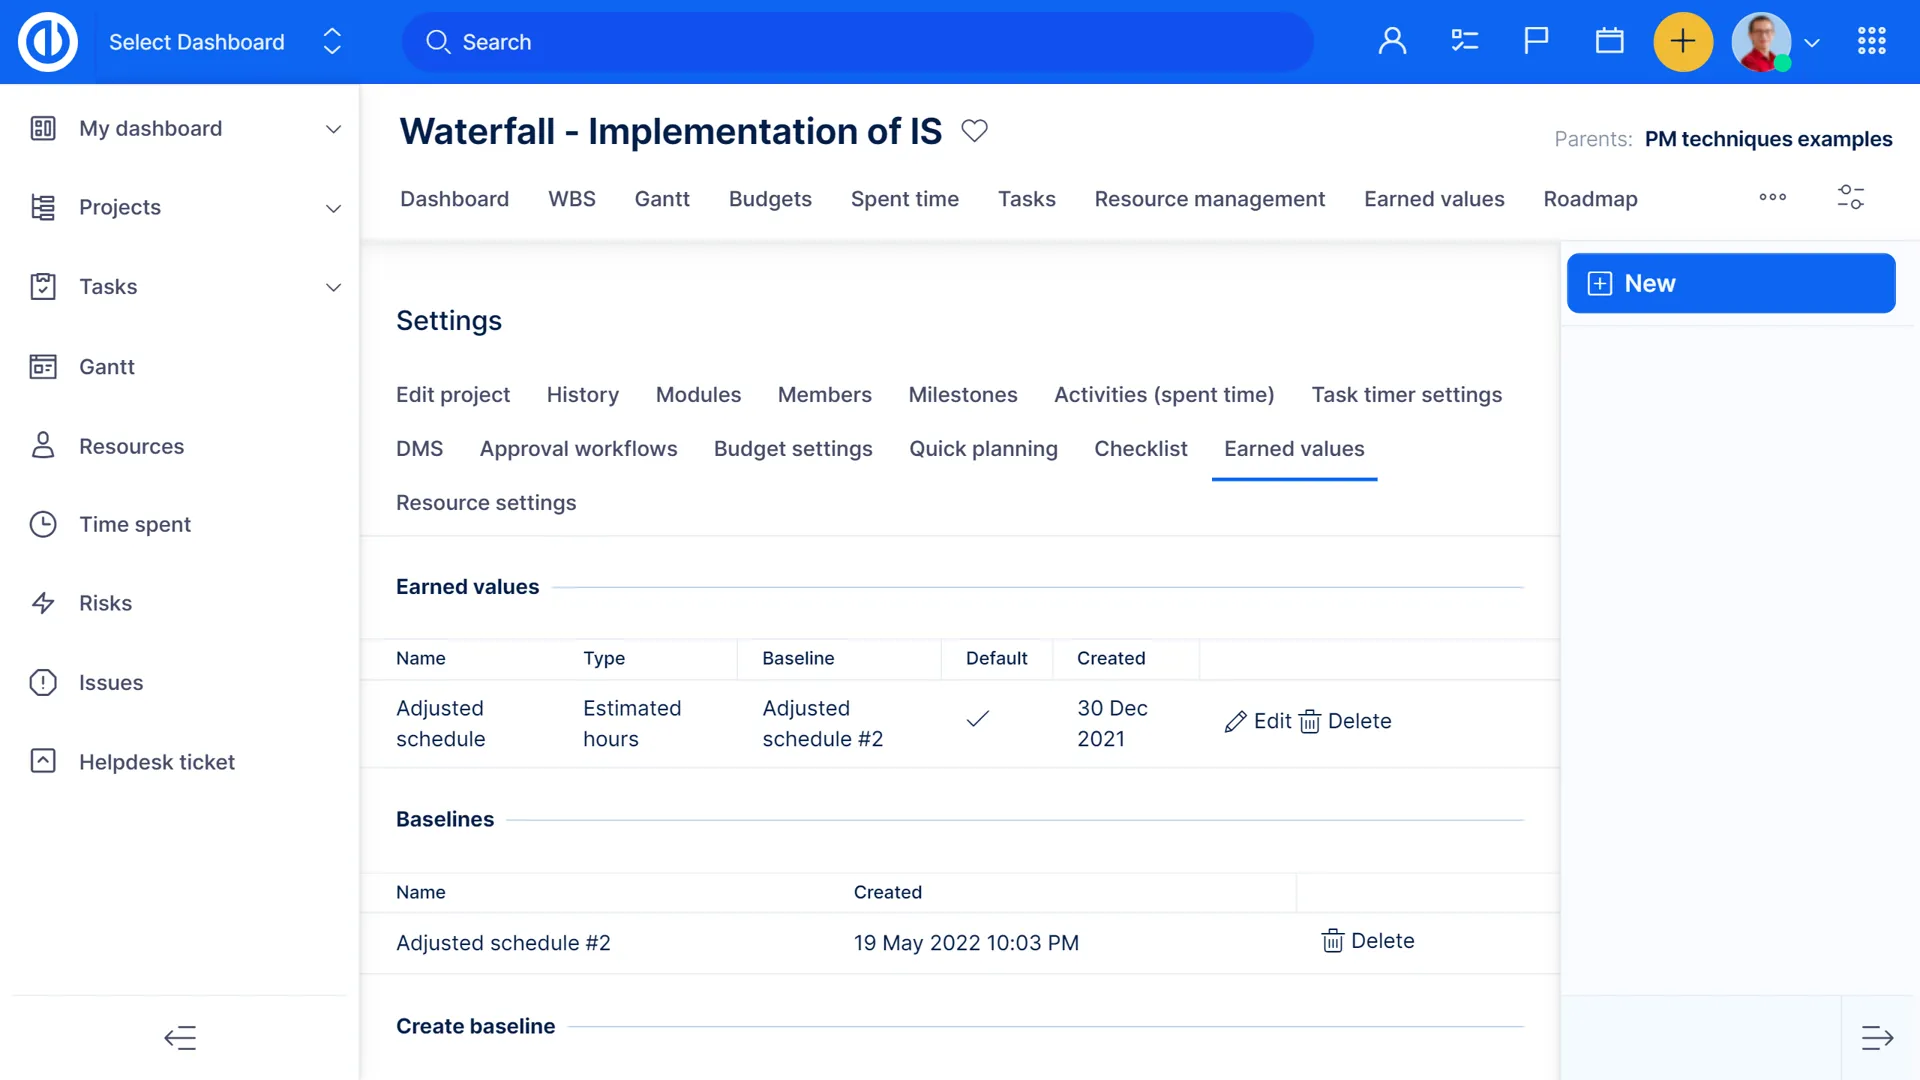
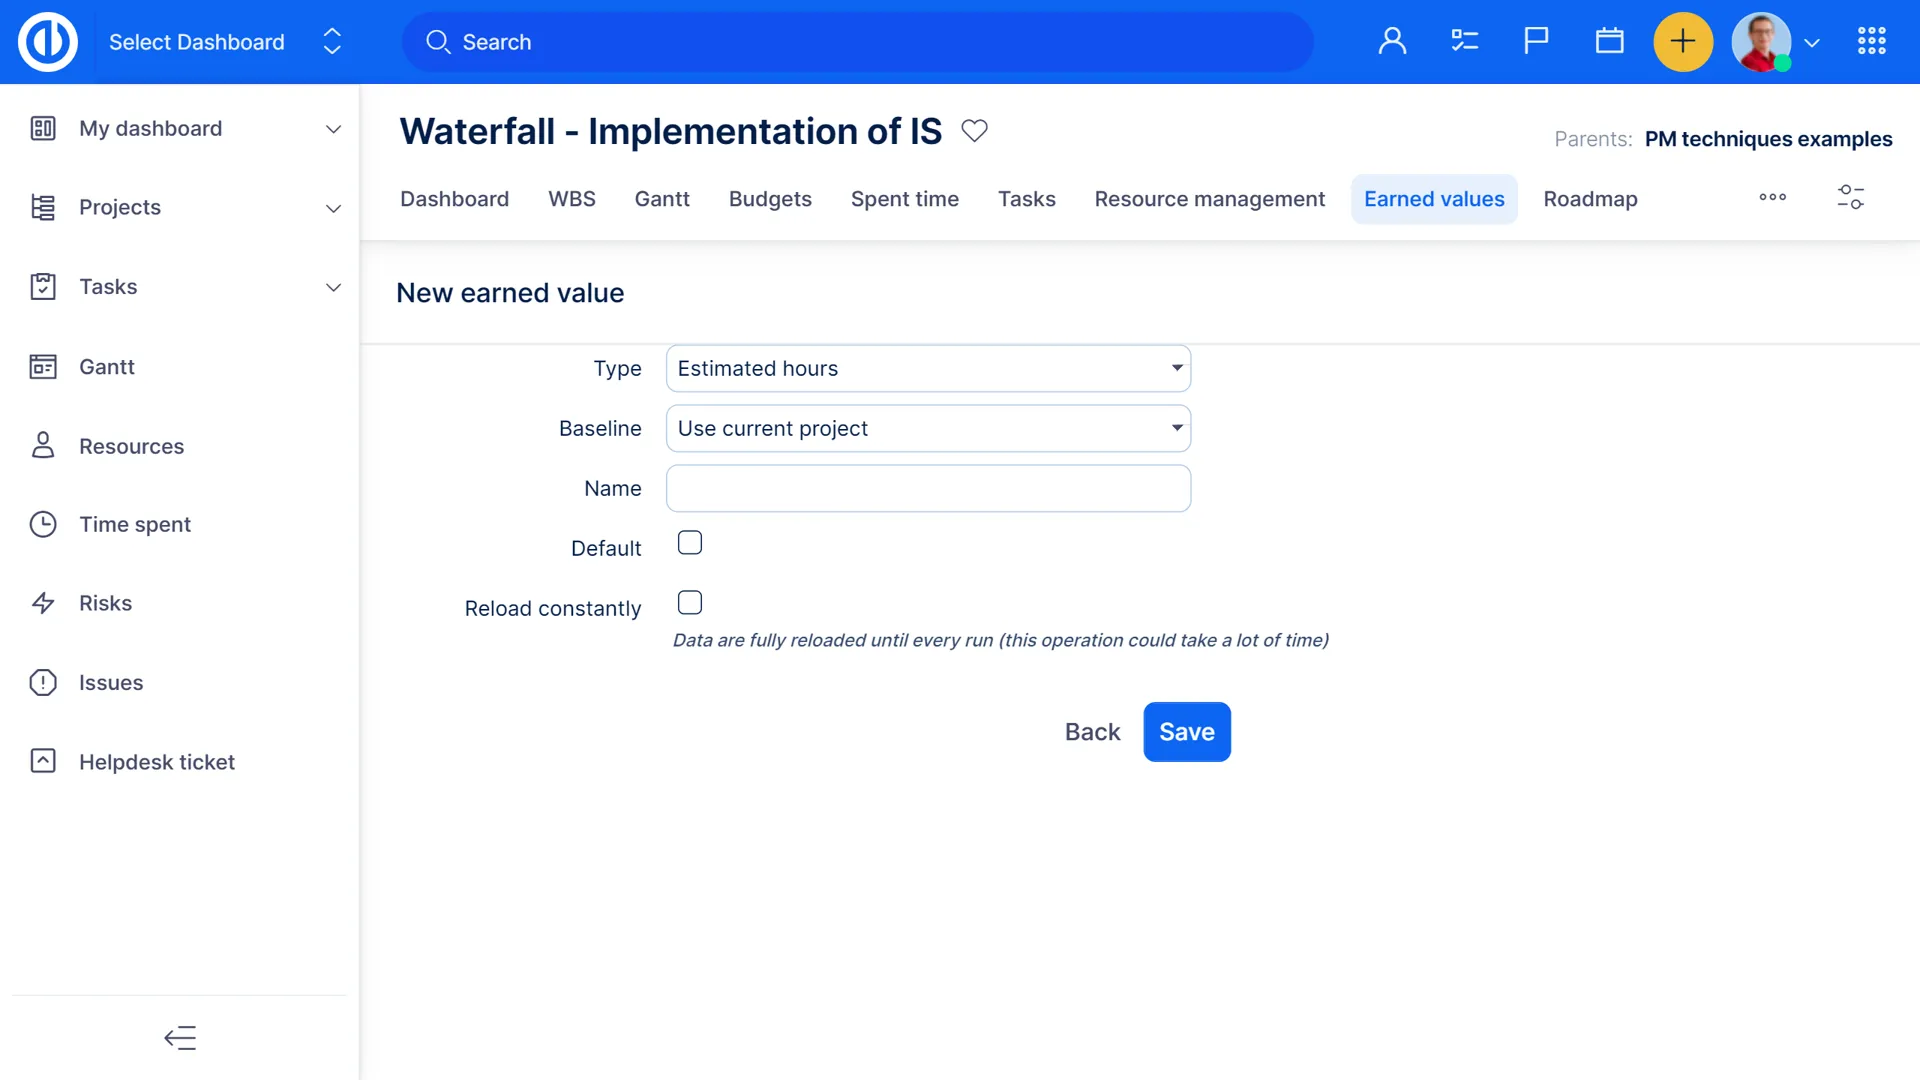
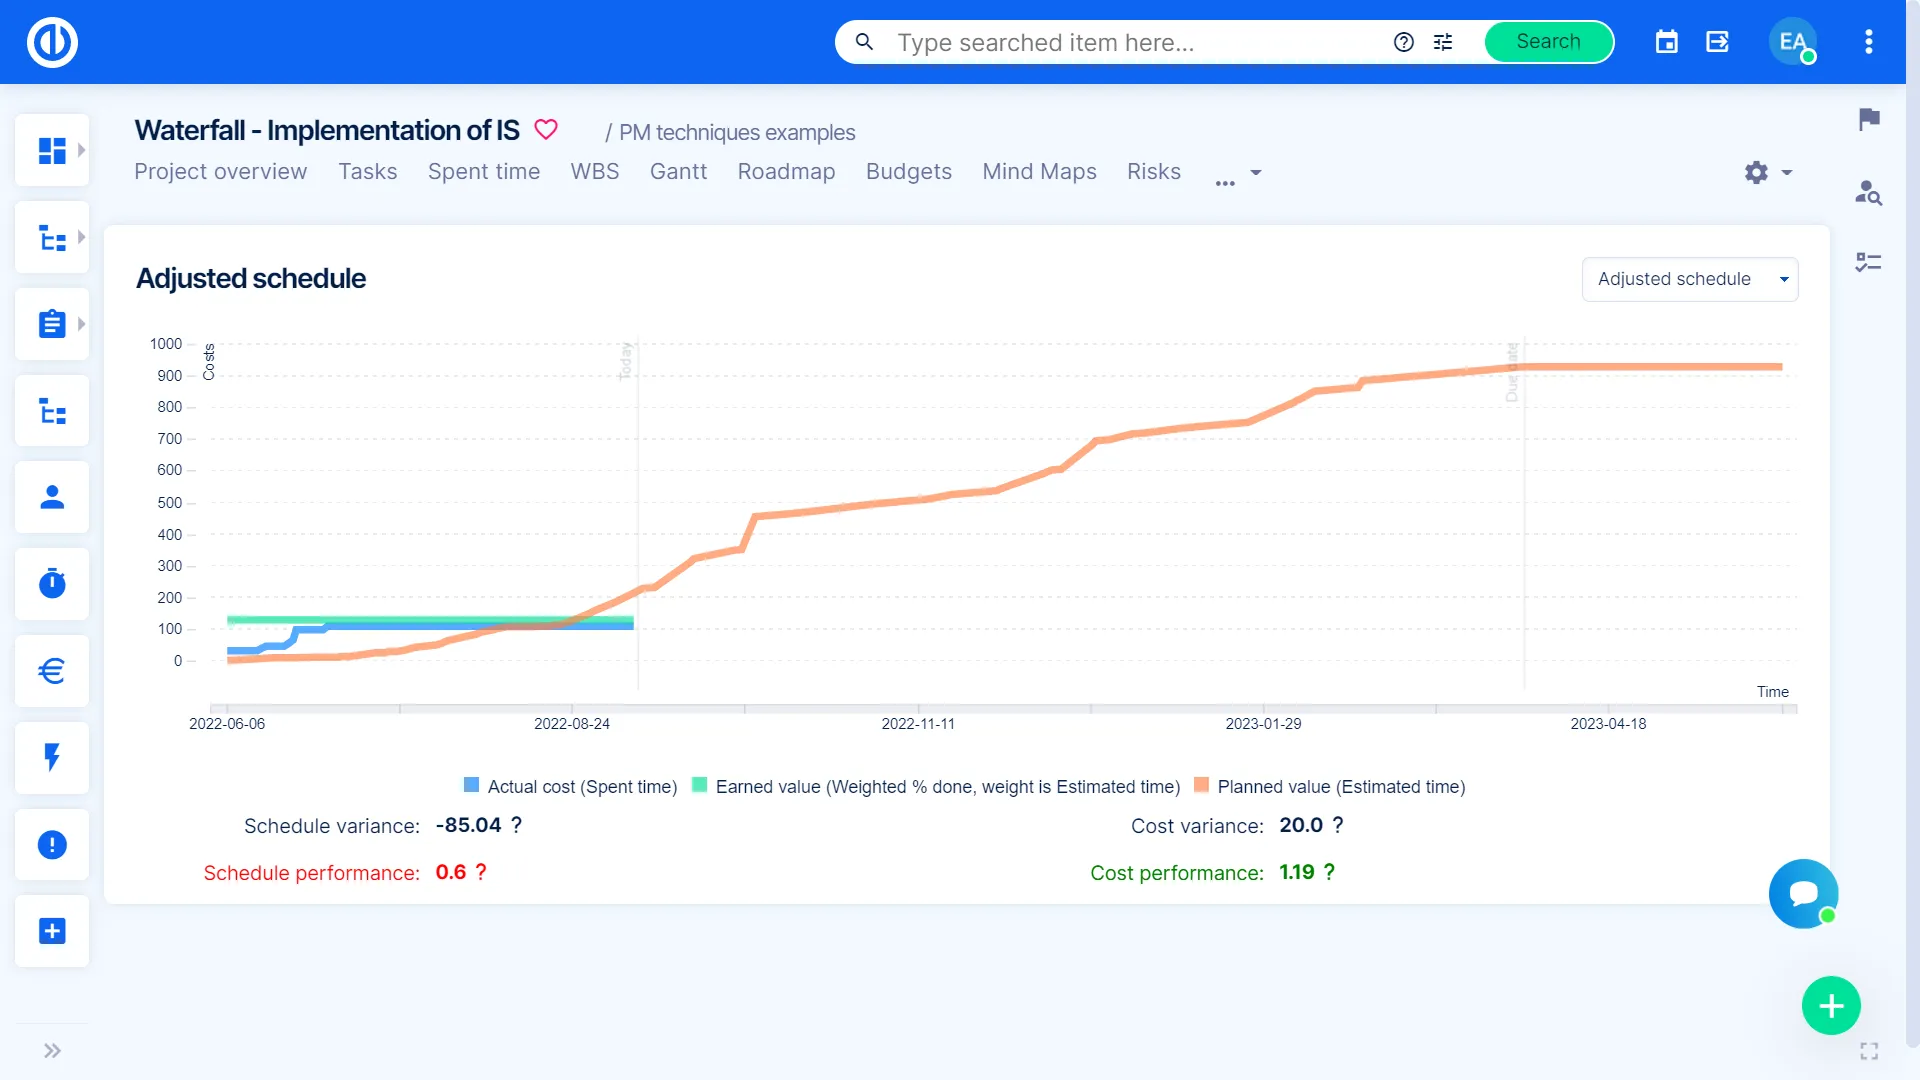
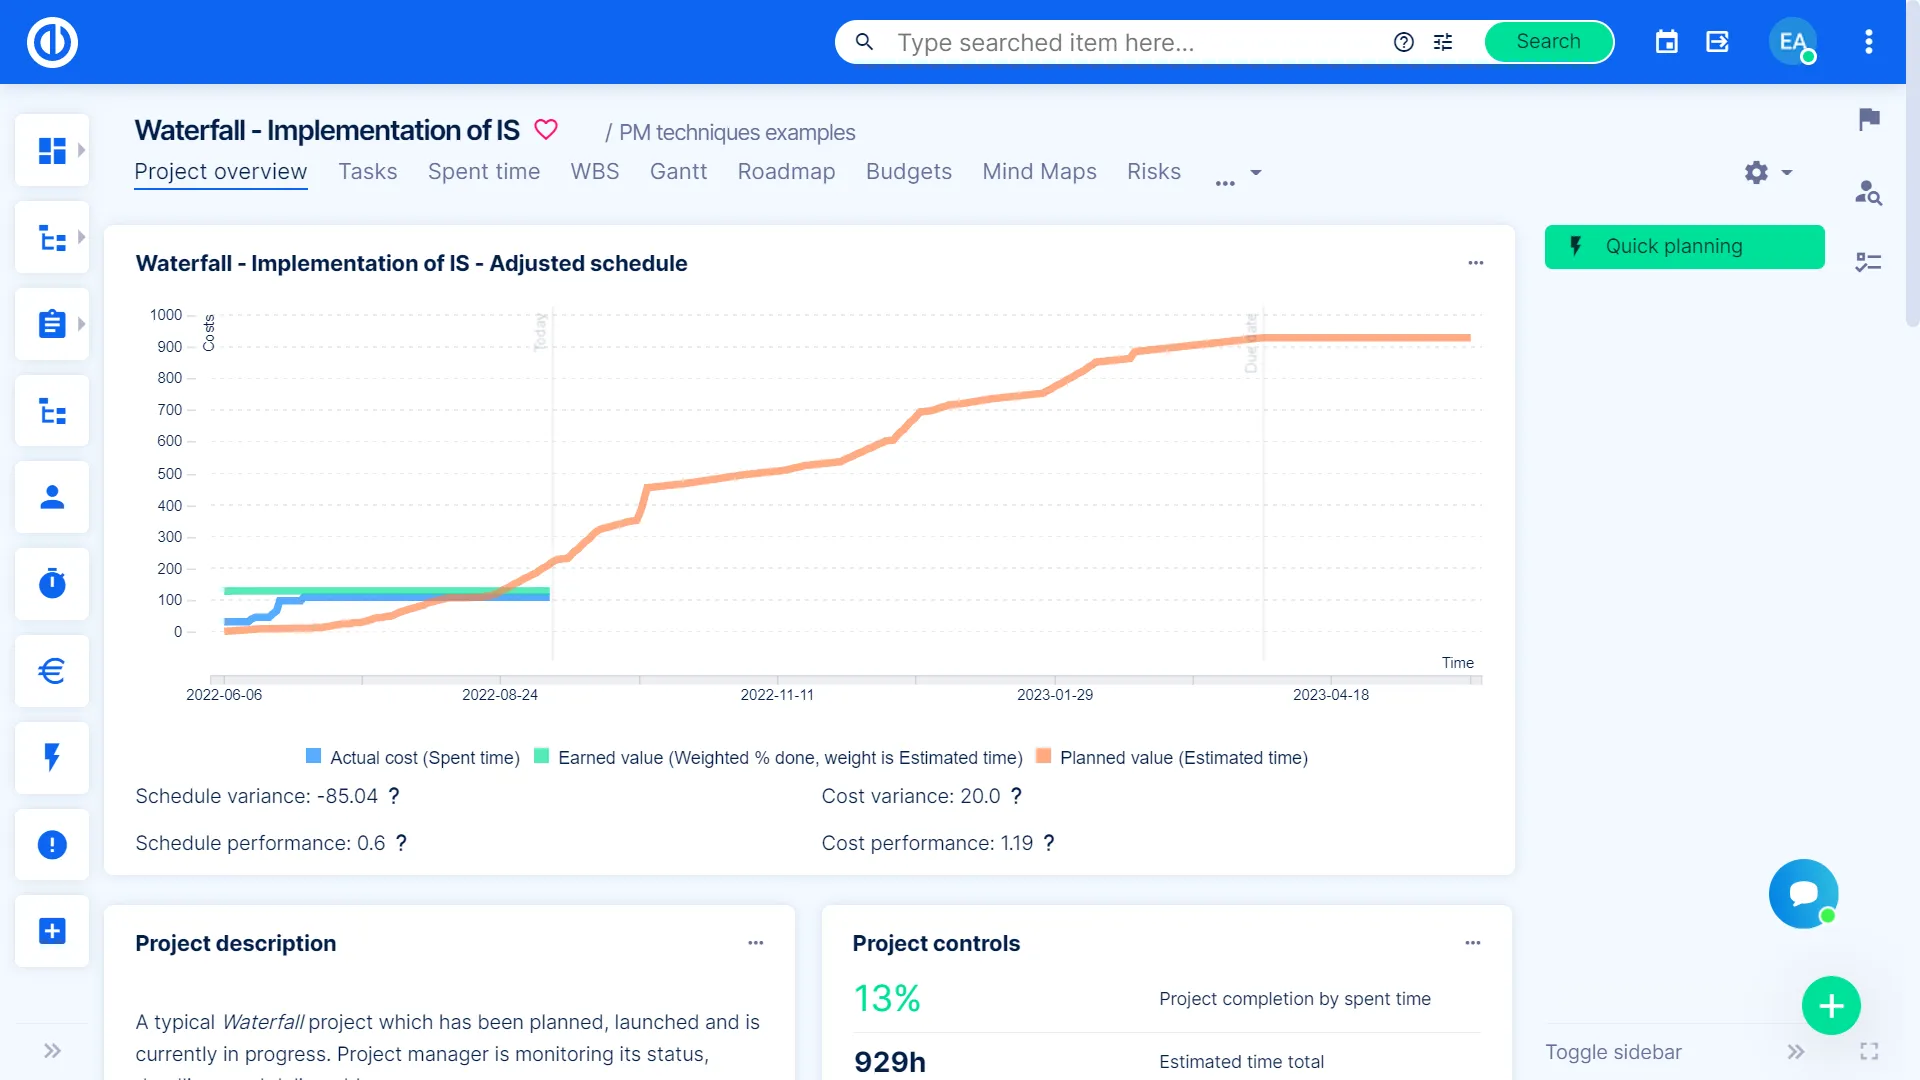
dEarned Value Management
Define the scope and analyze project’s overall performance with Earned Value Management (EVM), a research-proven methodology for determining project success.

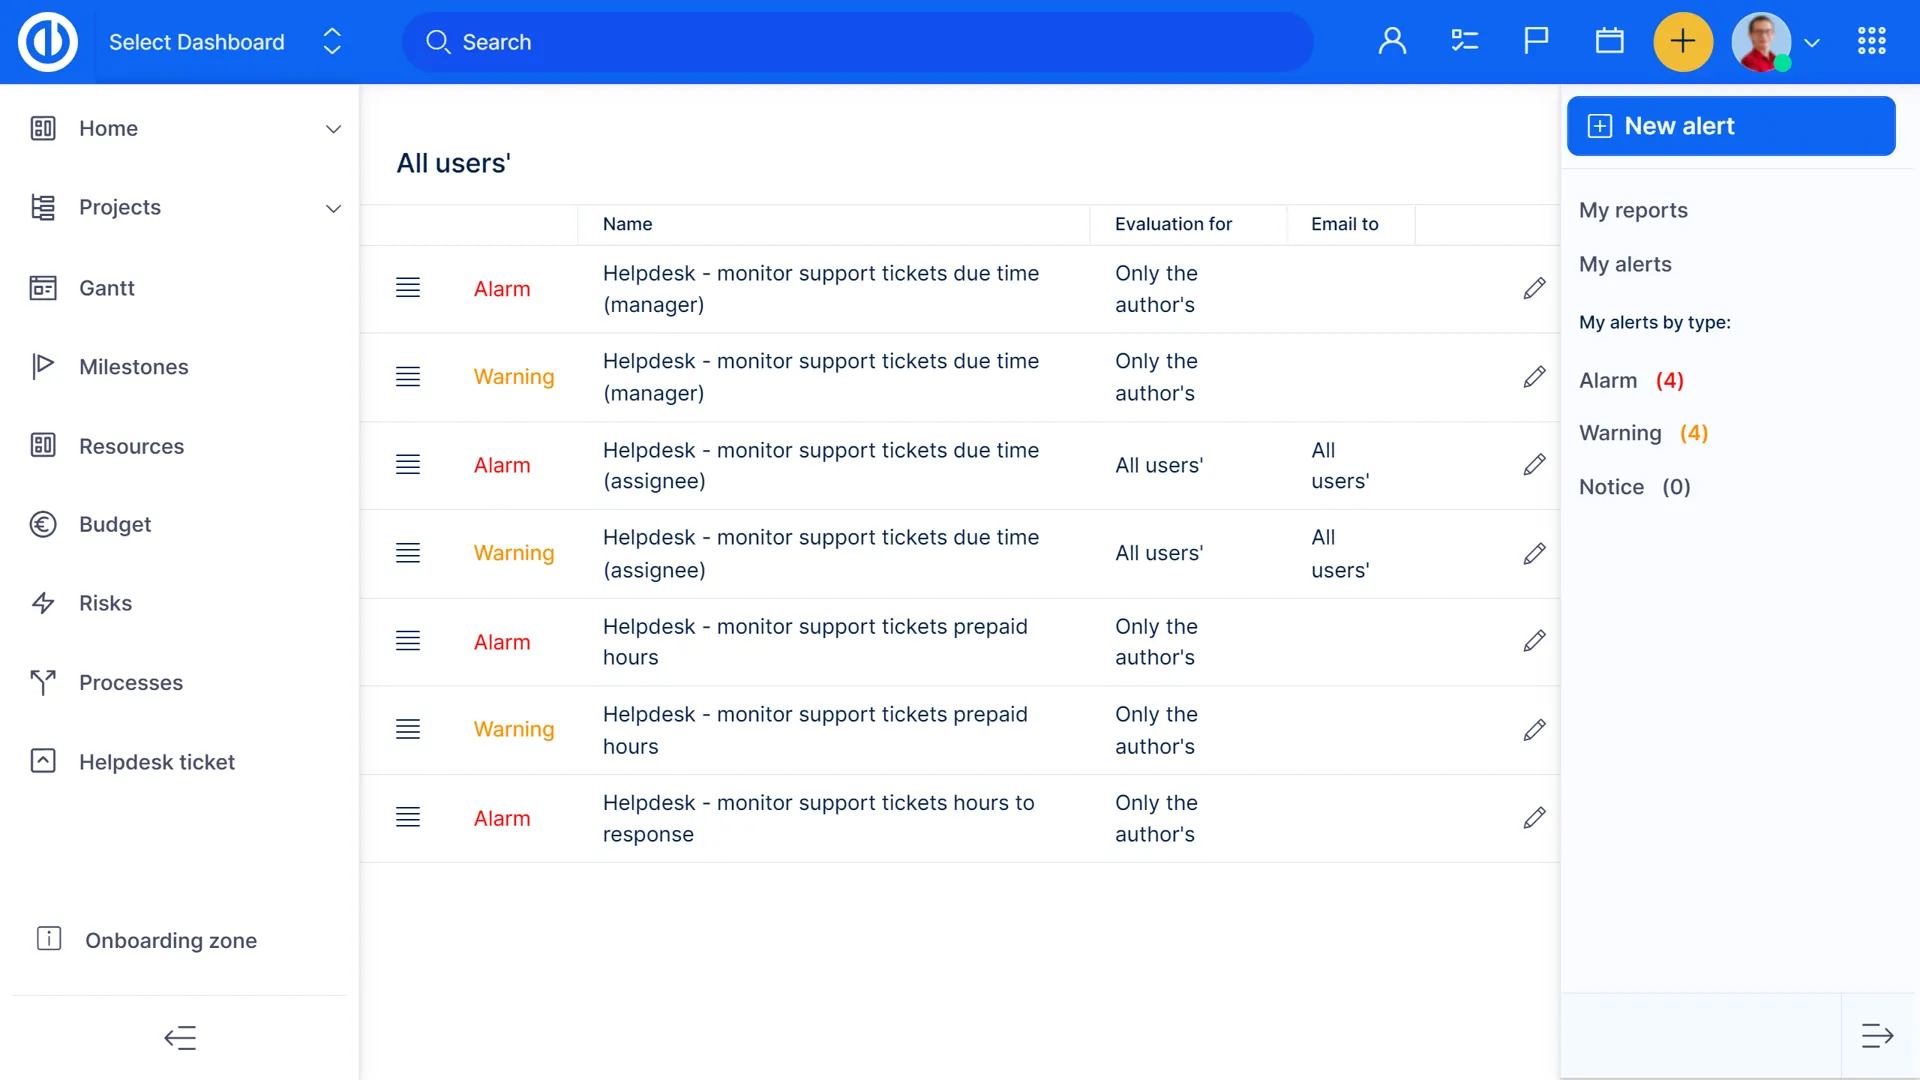
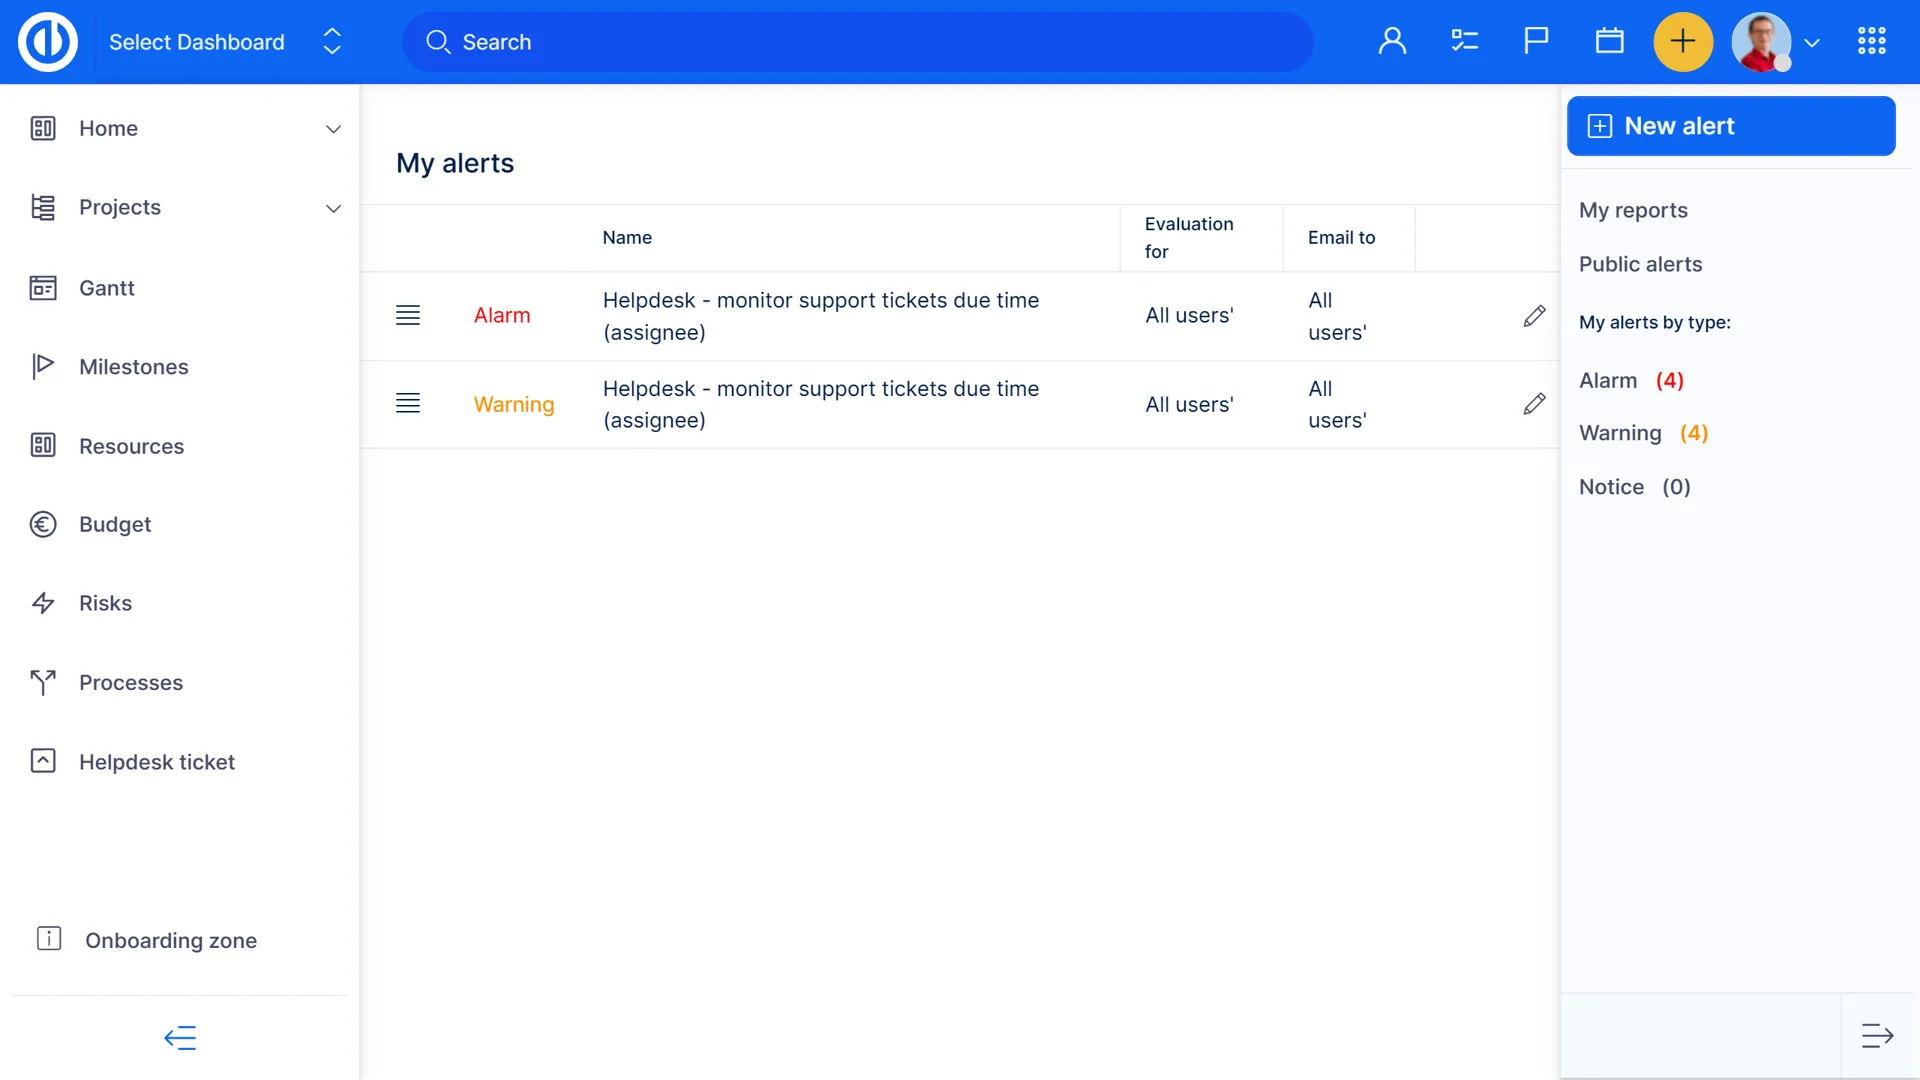
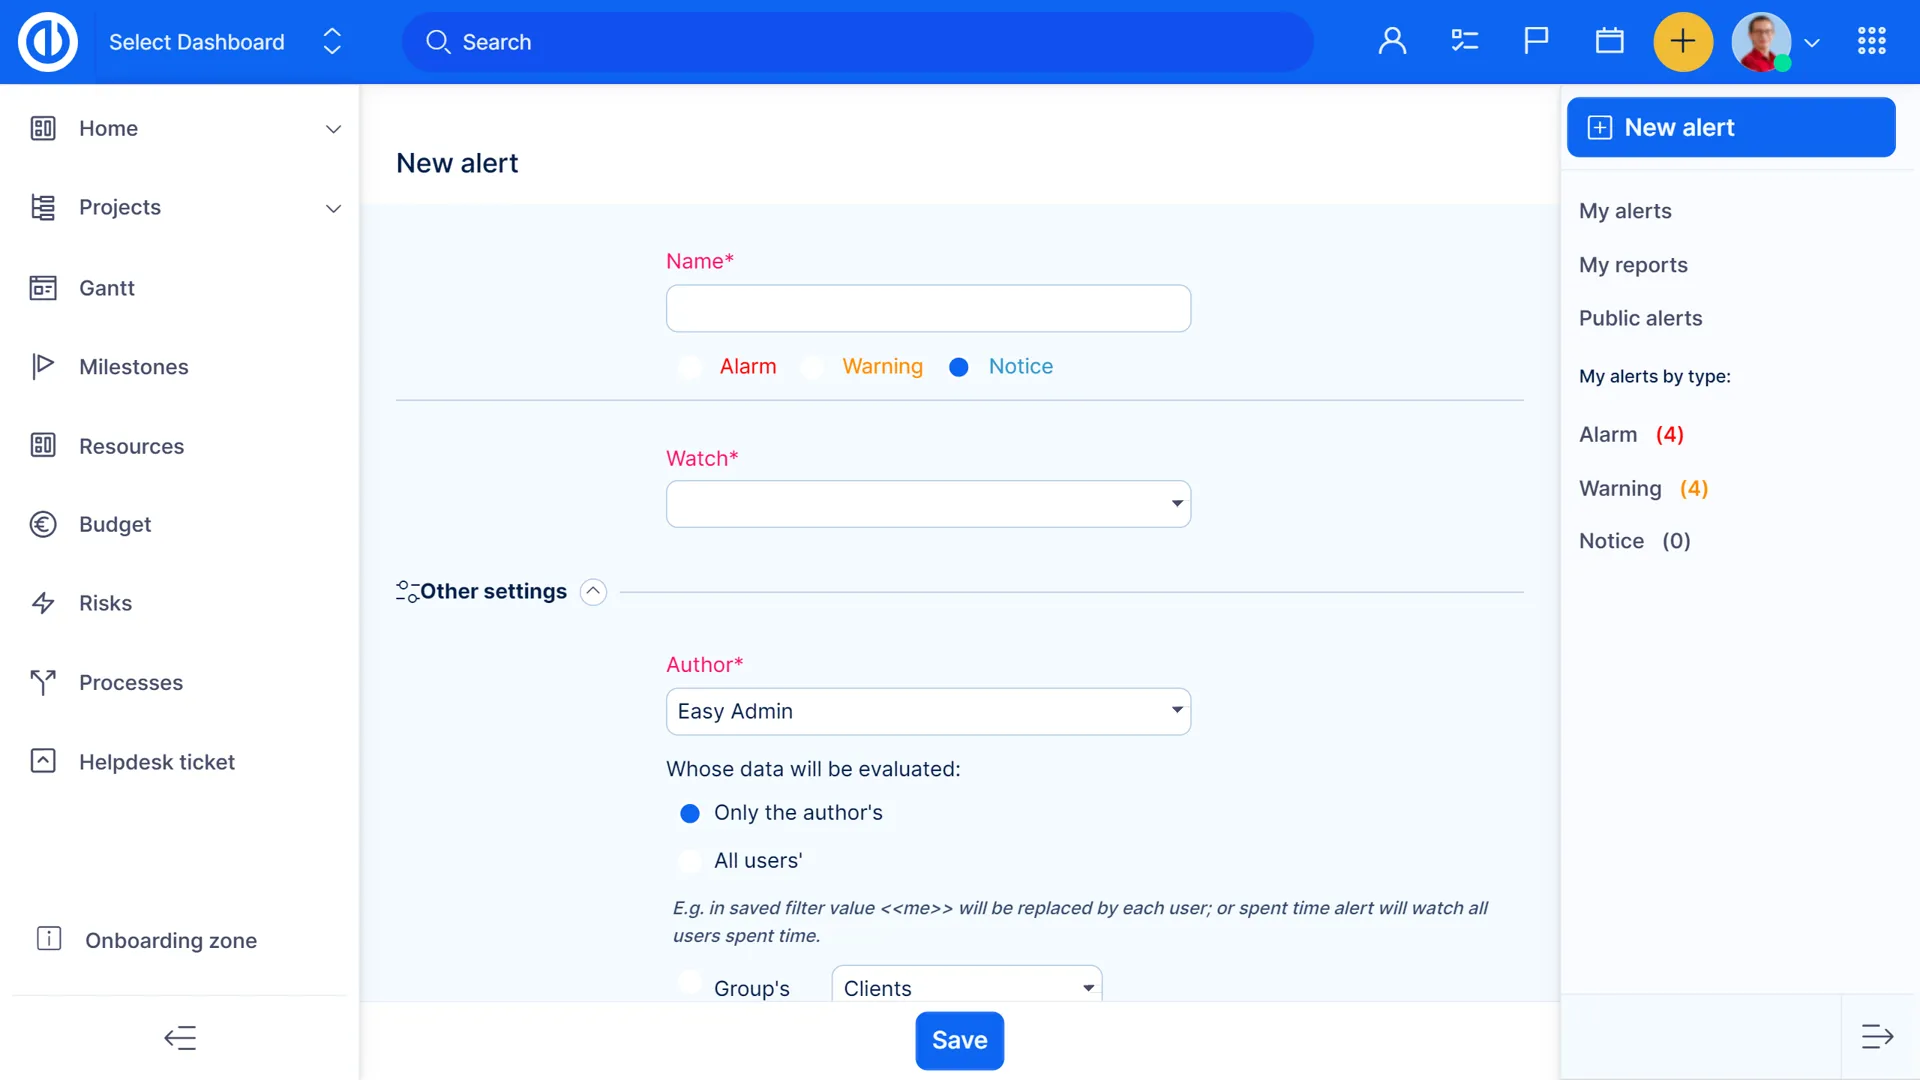
Alerts – Early Warning System
You set about what and when you want to be notified, and you will receive an e-mail notification at the right time. For example: a milestone deadline is approaching, a project/task budget is exceeded, tasks are past due.

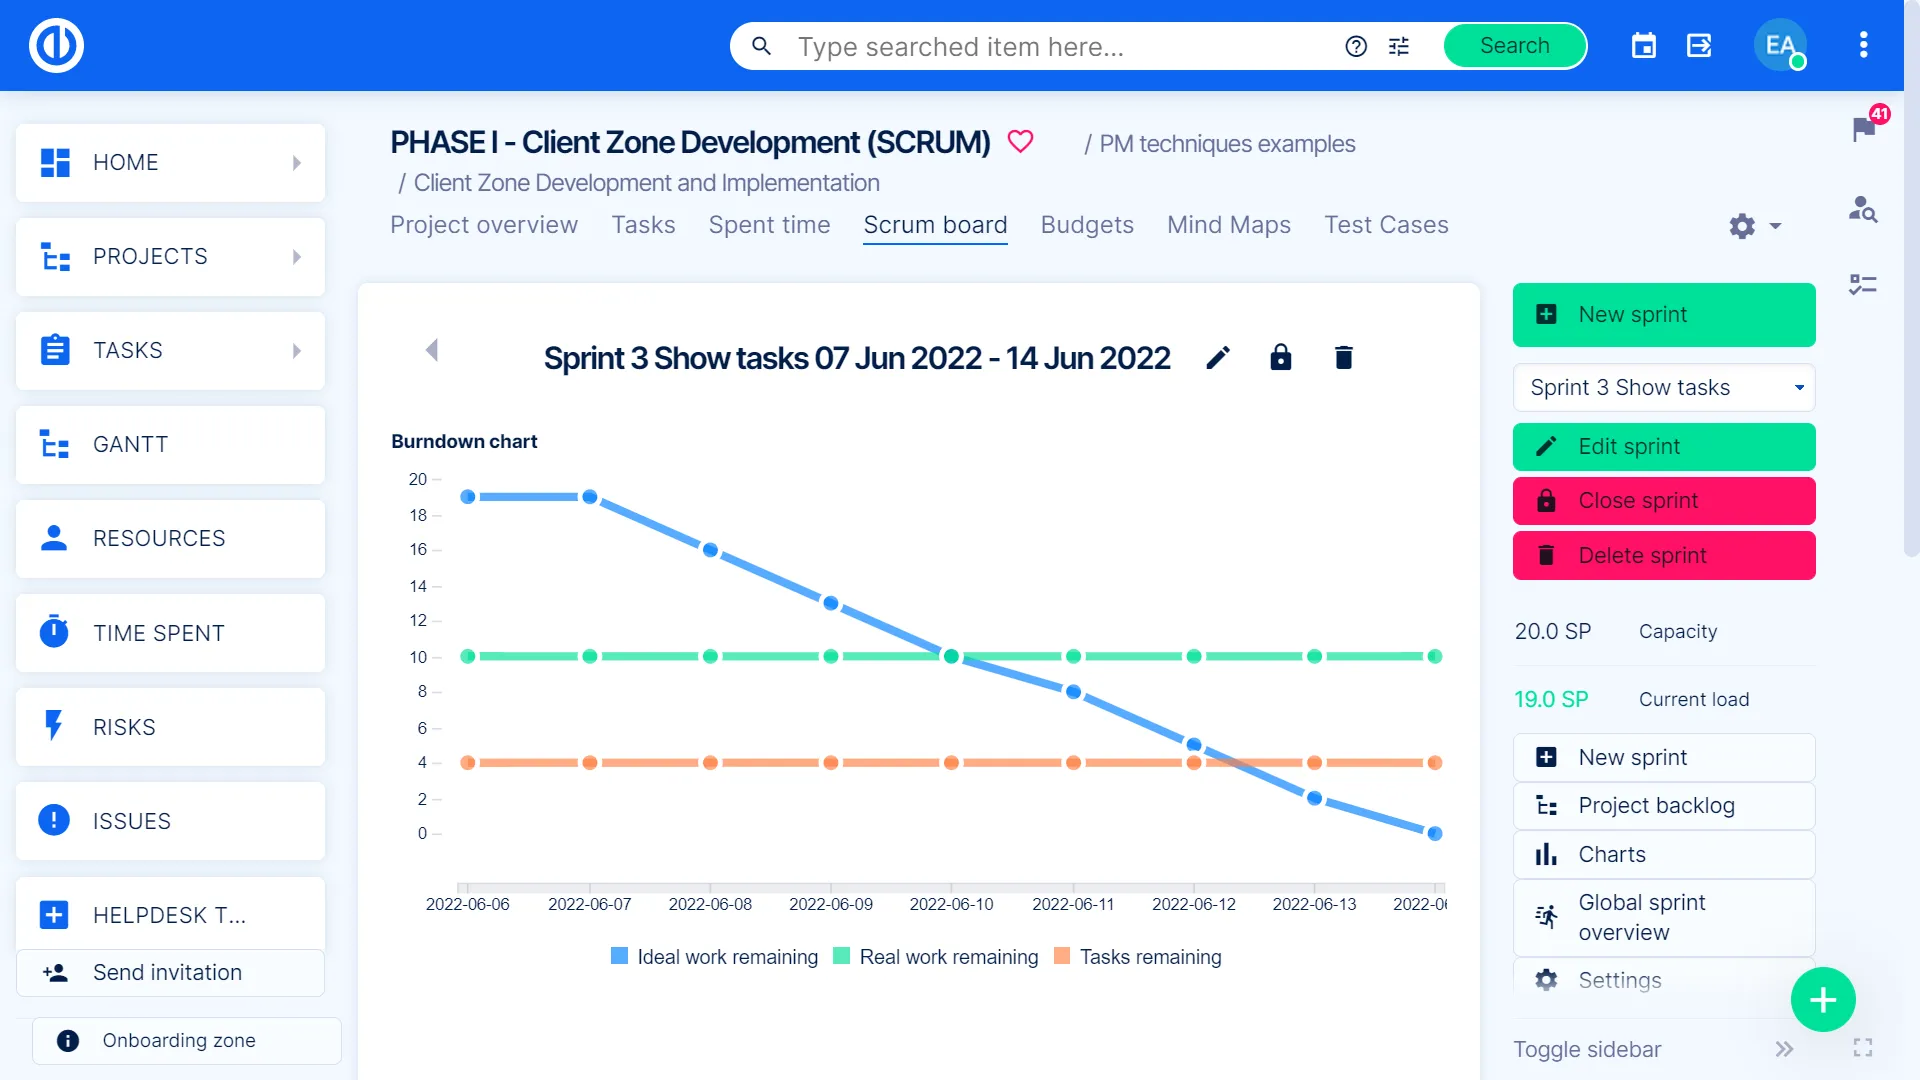
Burndown Chart for smooth sprint commitment
Perform in-depth analysis of progress patterns for timely sprint completion with Burndown Chart. Compare ideal versus real work remaining, identify a working pattern and make sure that sprint commitment is met without a hitch.

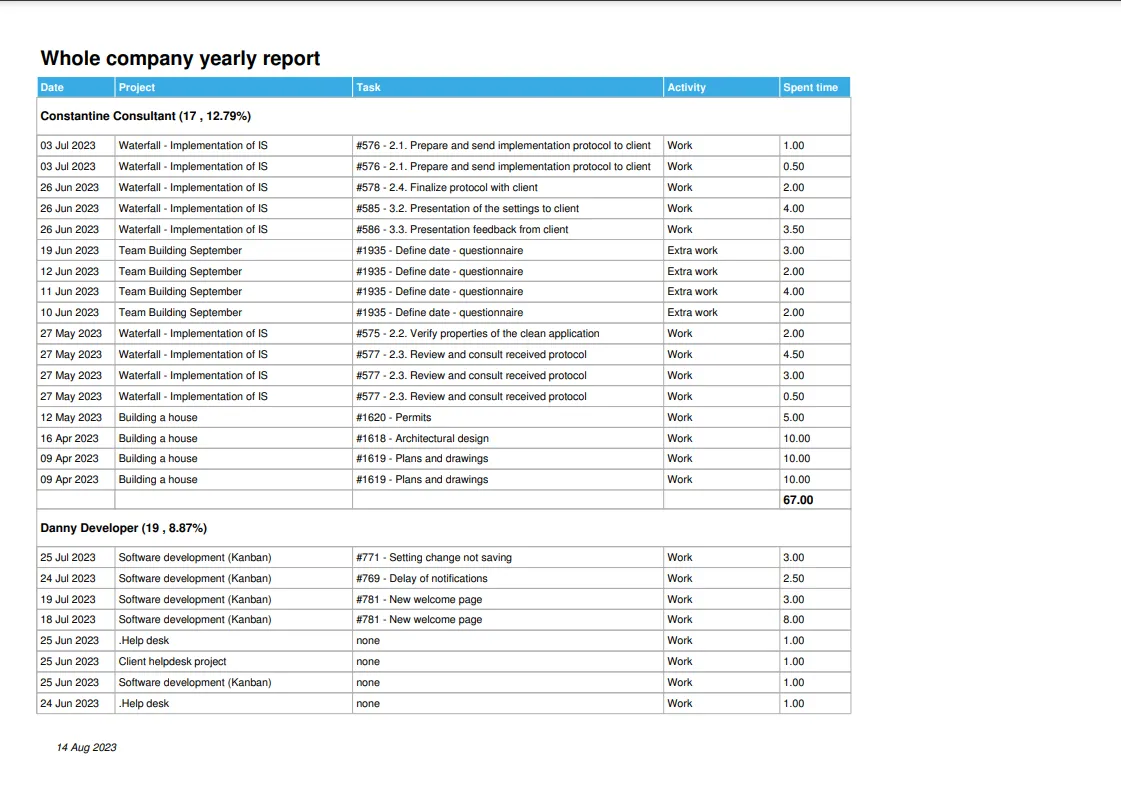
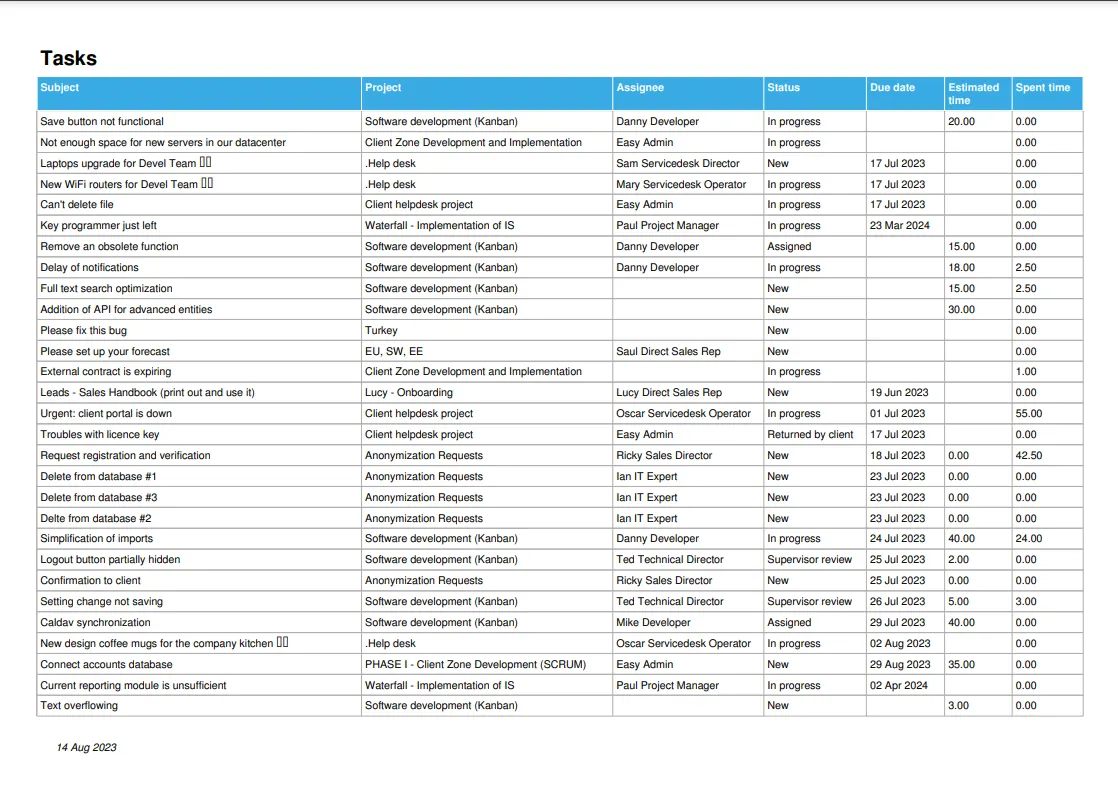
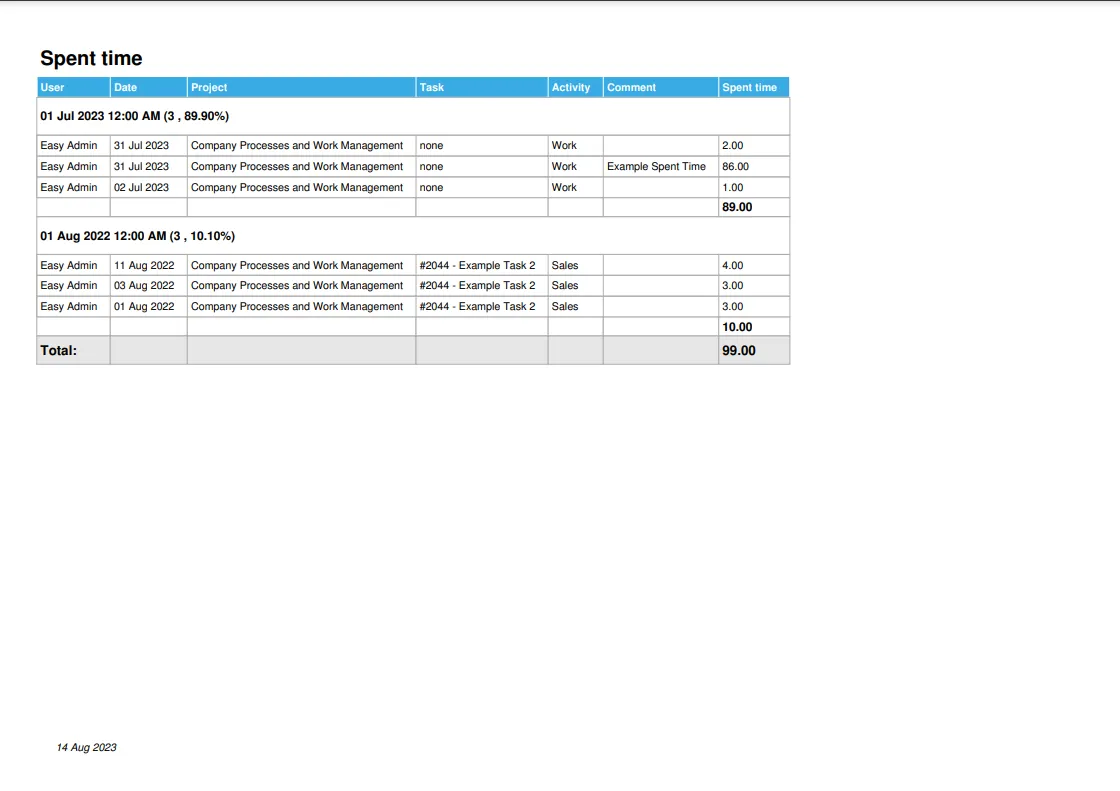
Branded Exports
All data listings from the system can be exported into a PDF file with your logo and company colors. Example of exports: any task list, project list, spent time entries, task detail export, etc.

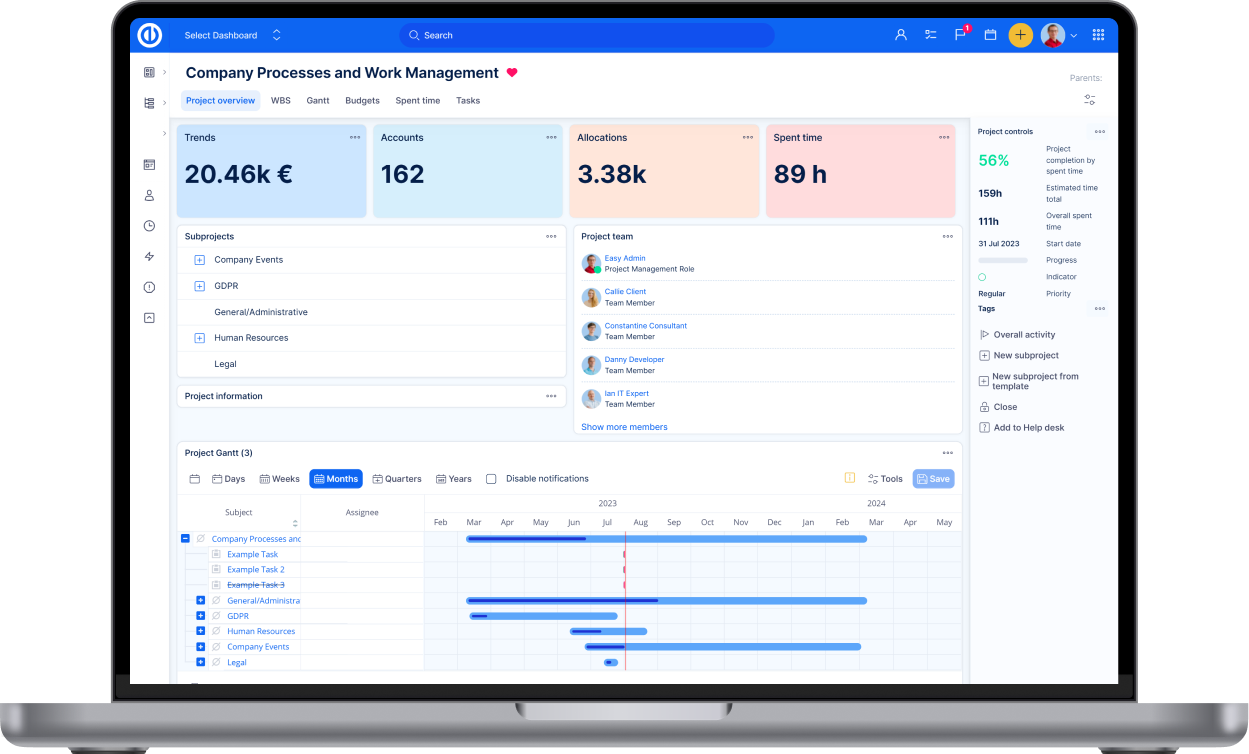
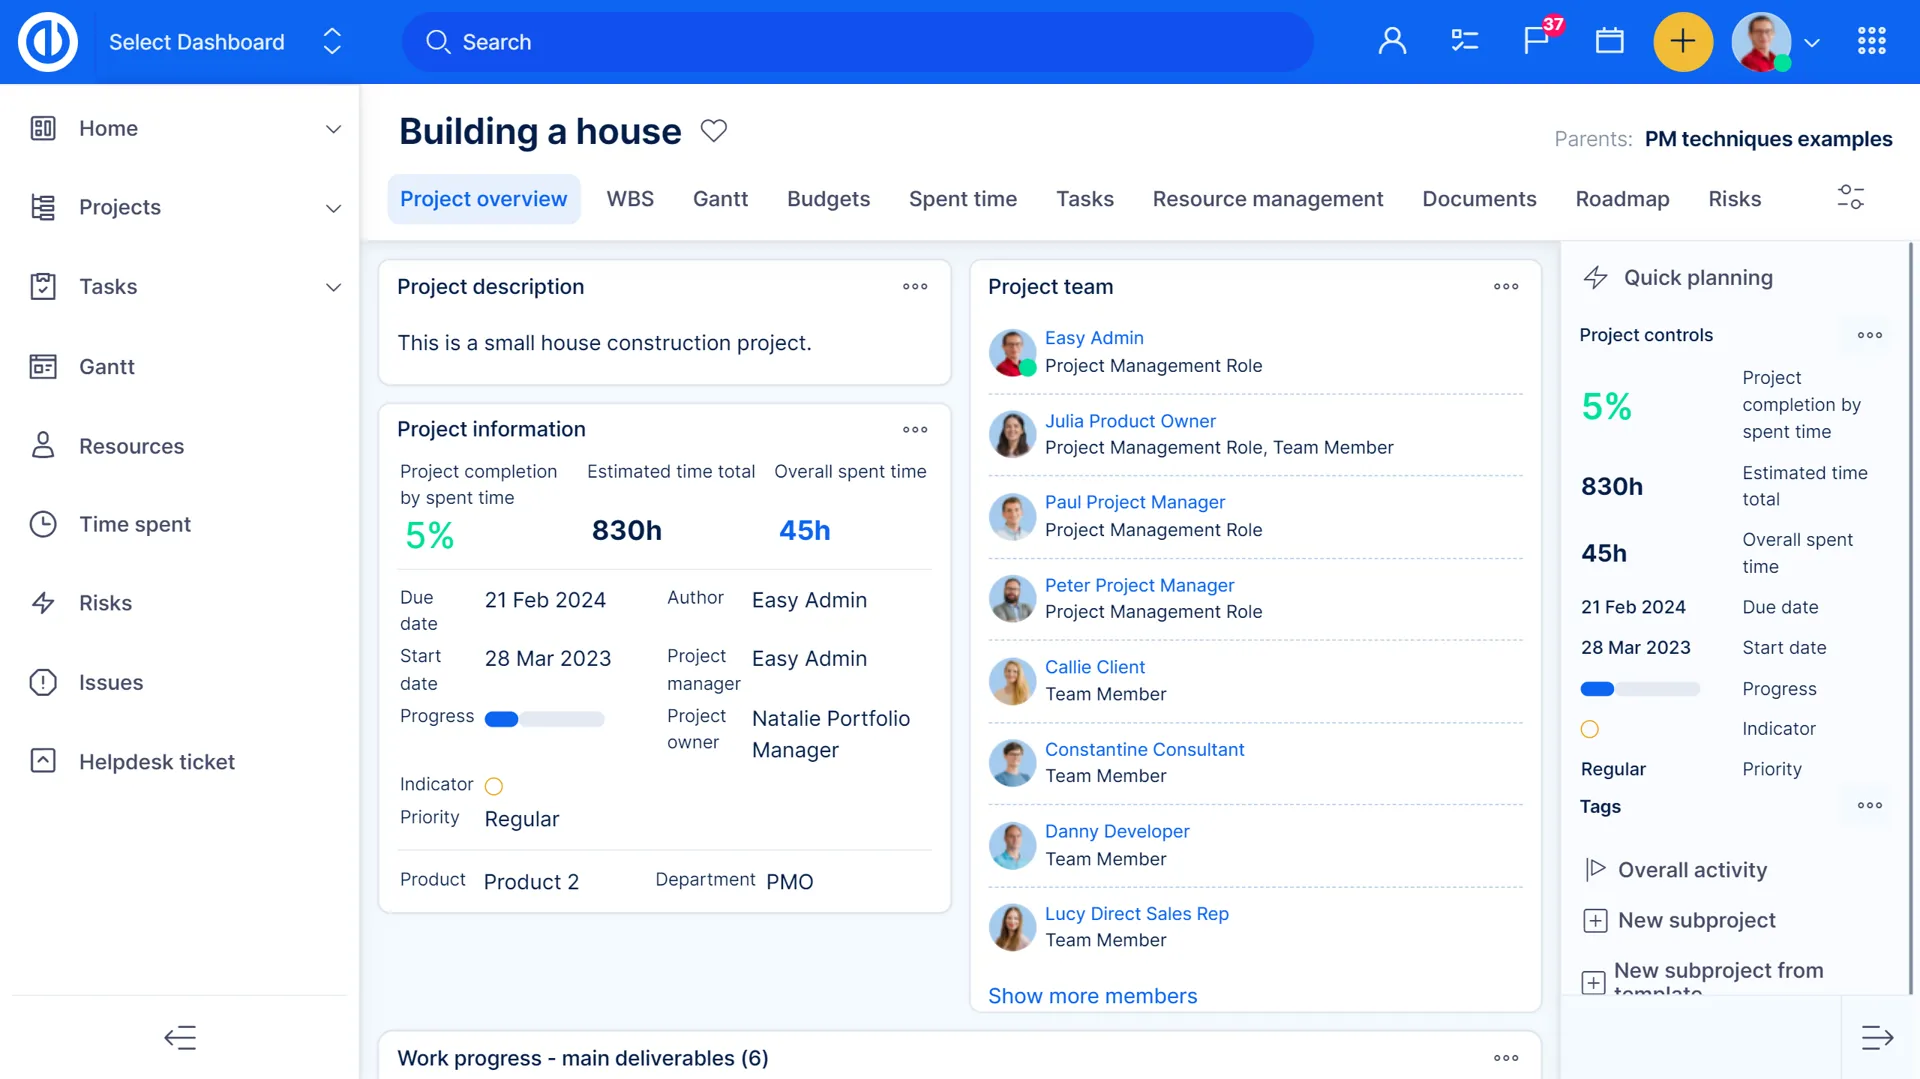
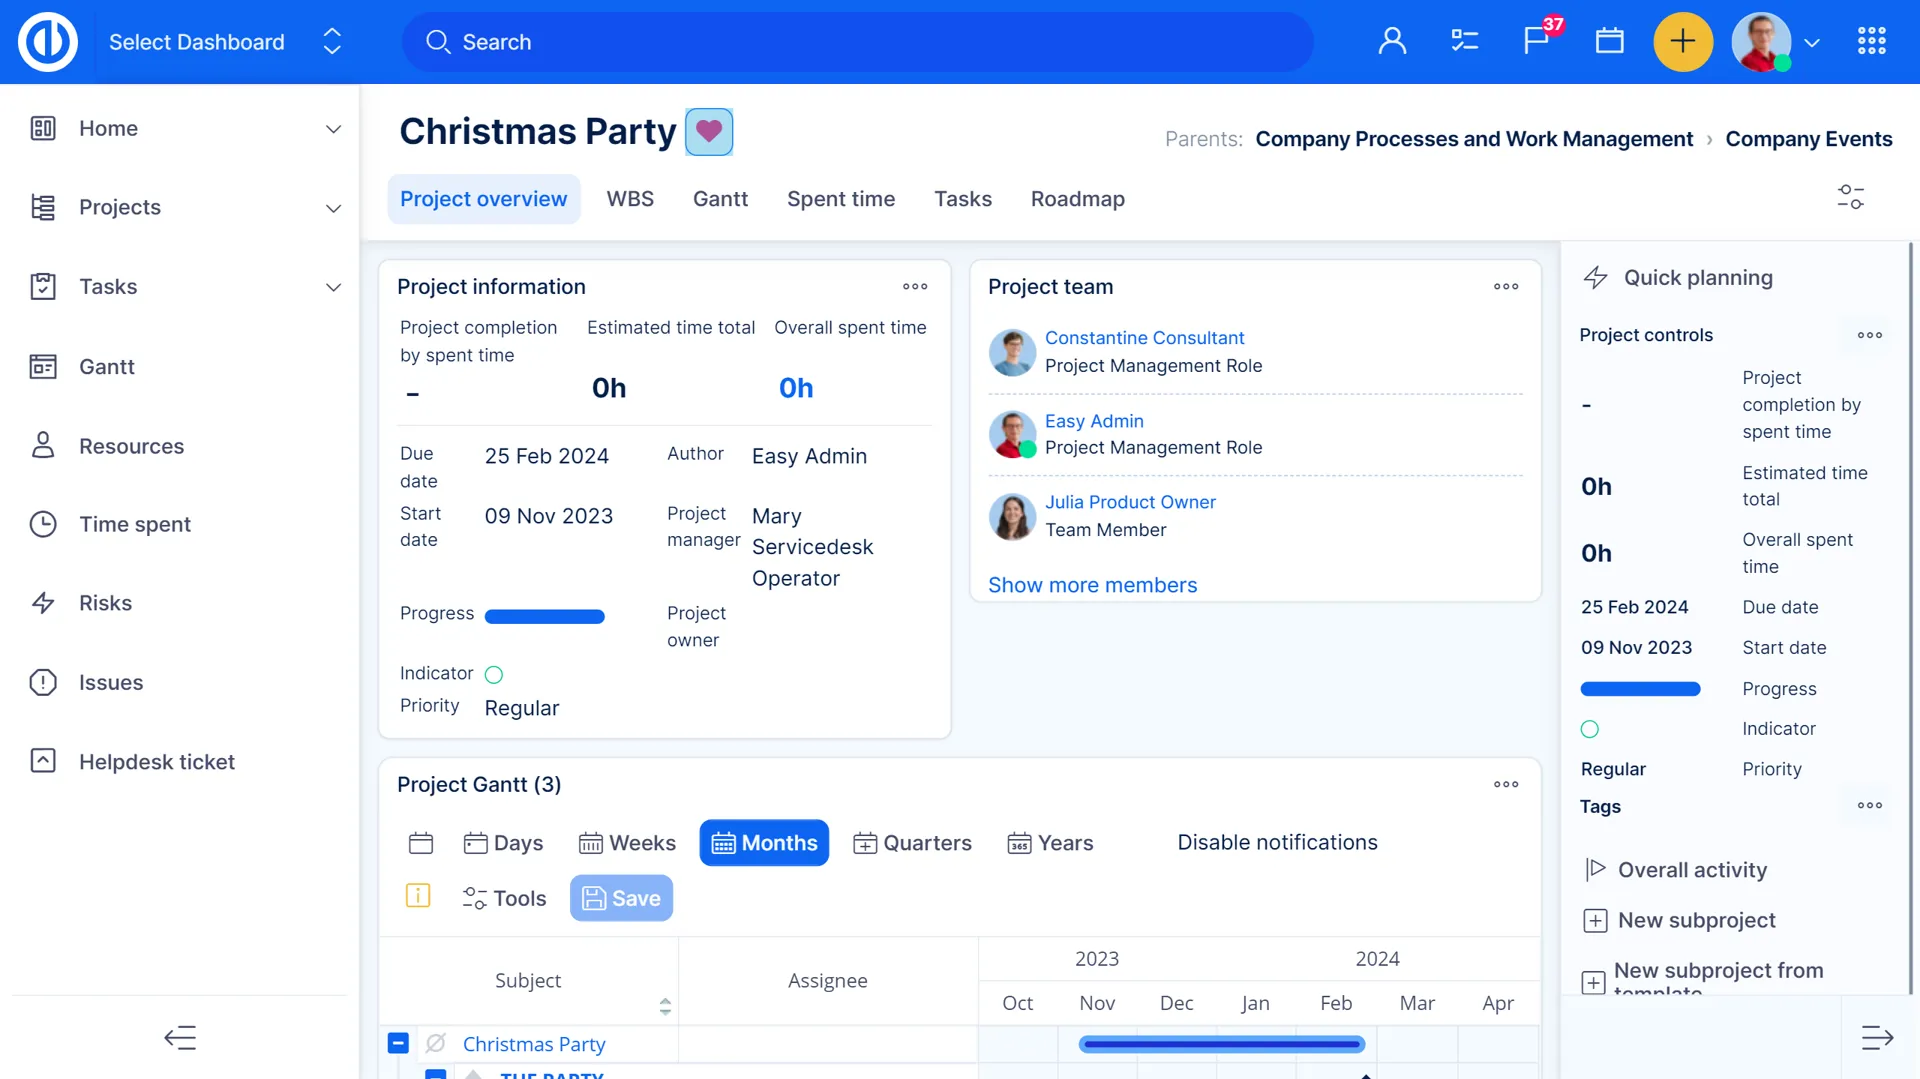
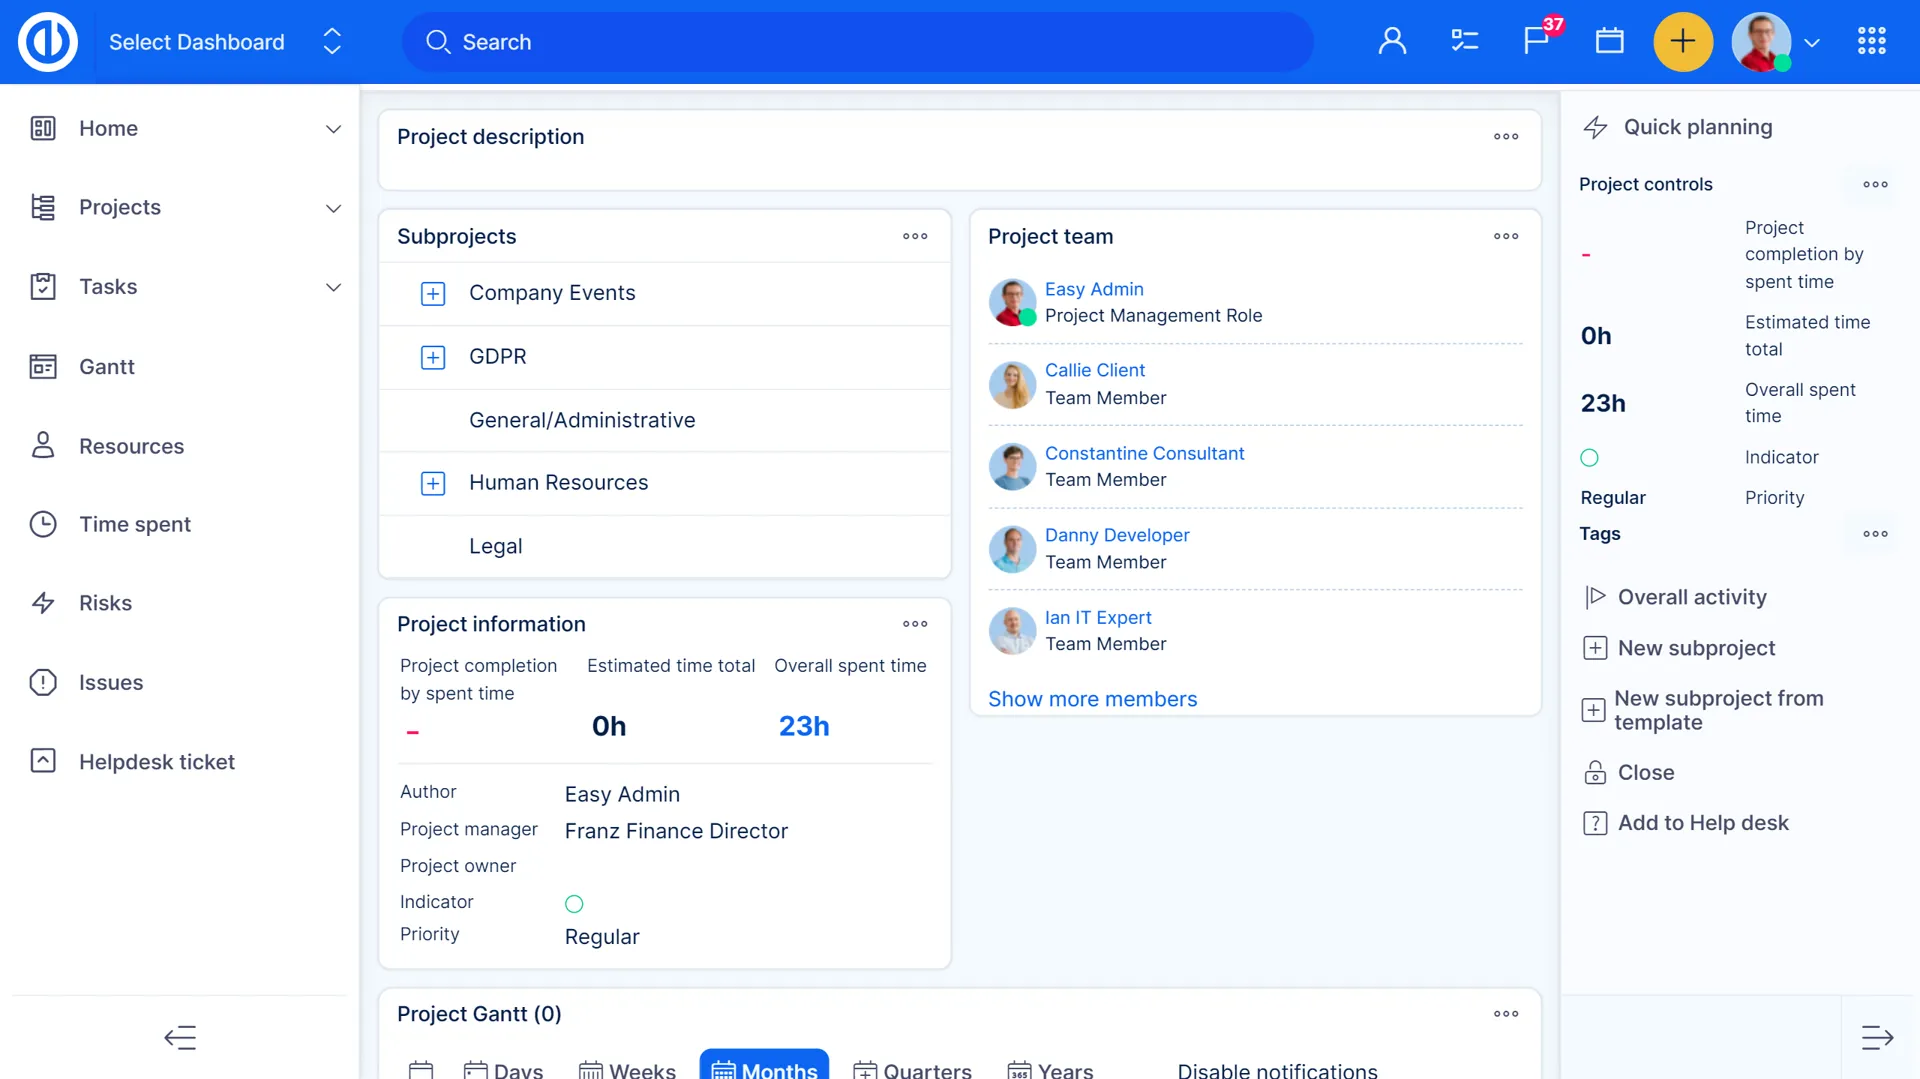
Project Dashboard
In order to keep your business on the right track, project managers and teams need any help they can get. One of the proven ways of tracking and measuring ongoing progress is by using a project dashboard, which makes it simple to visualize real-time data and customize the page to the needs of the team and projects.

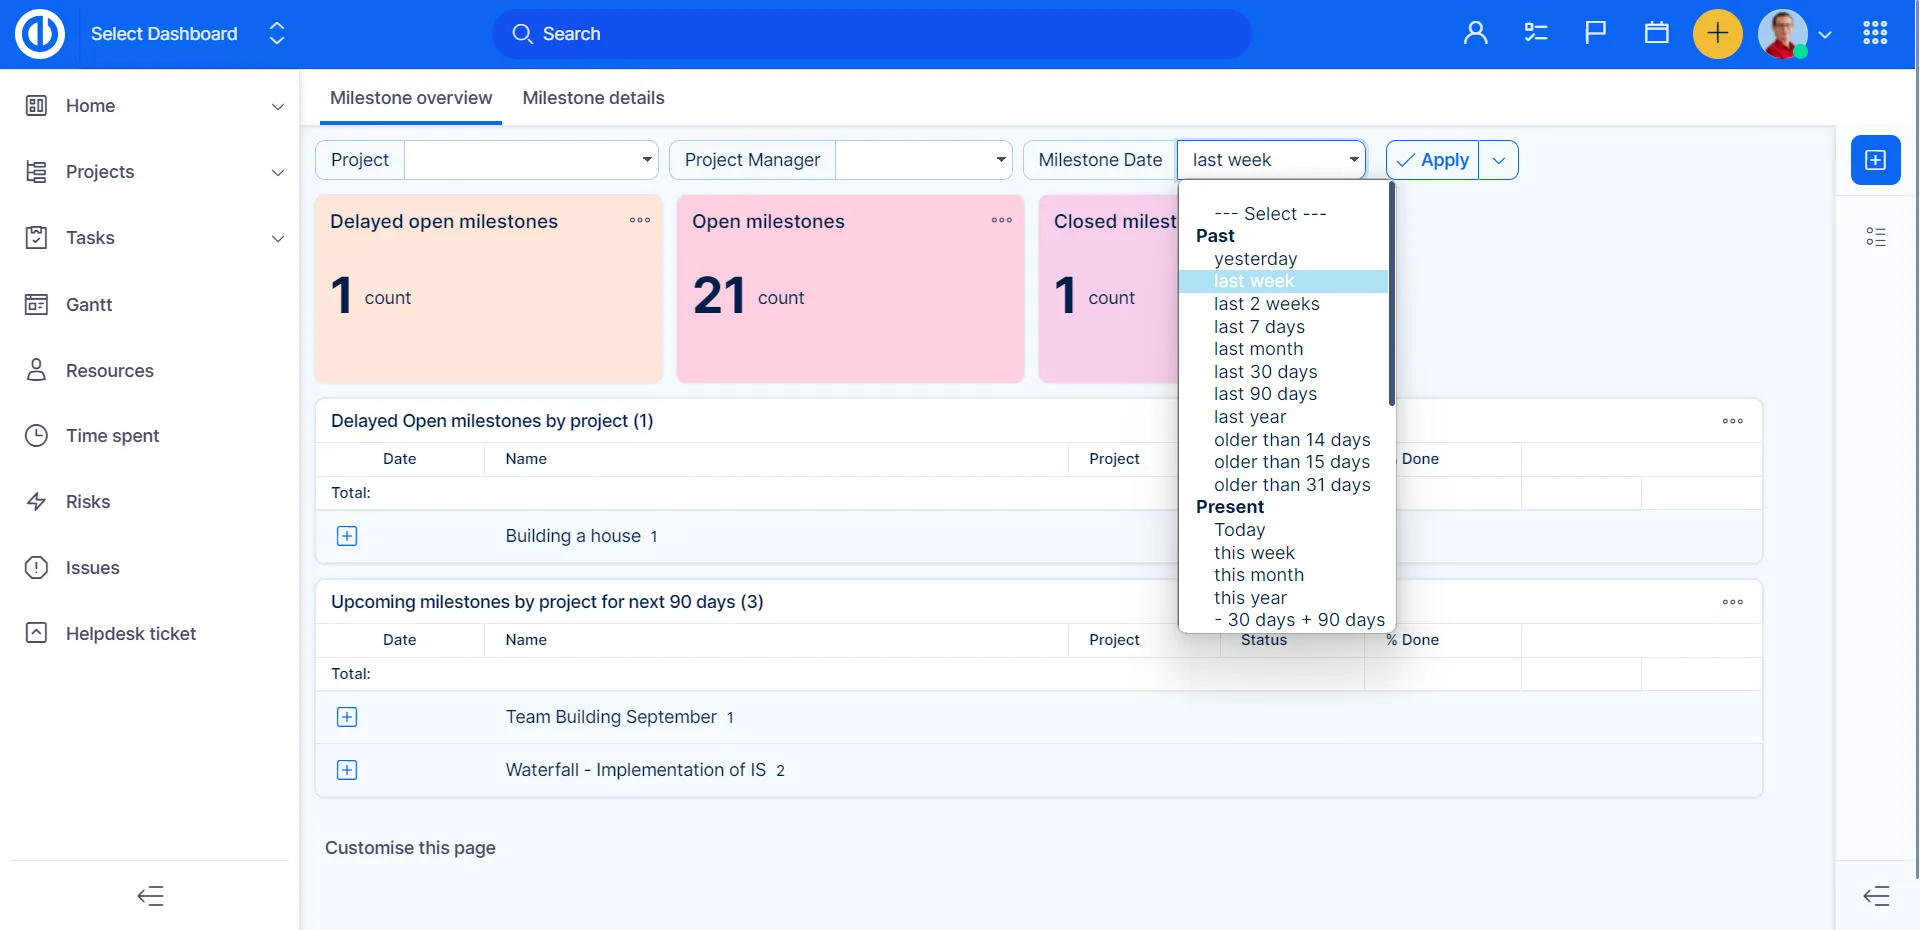
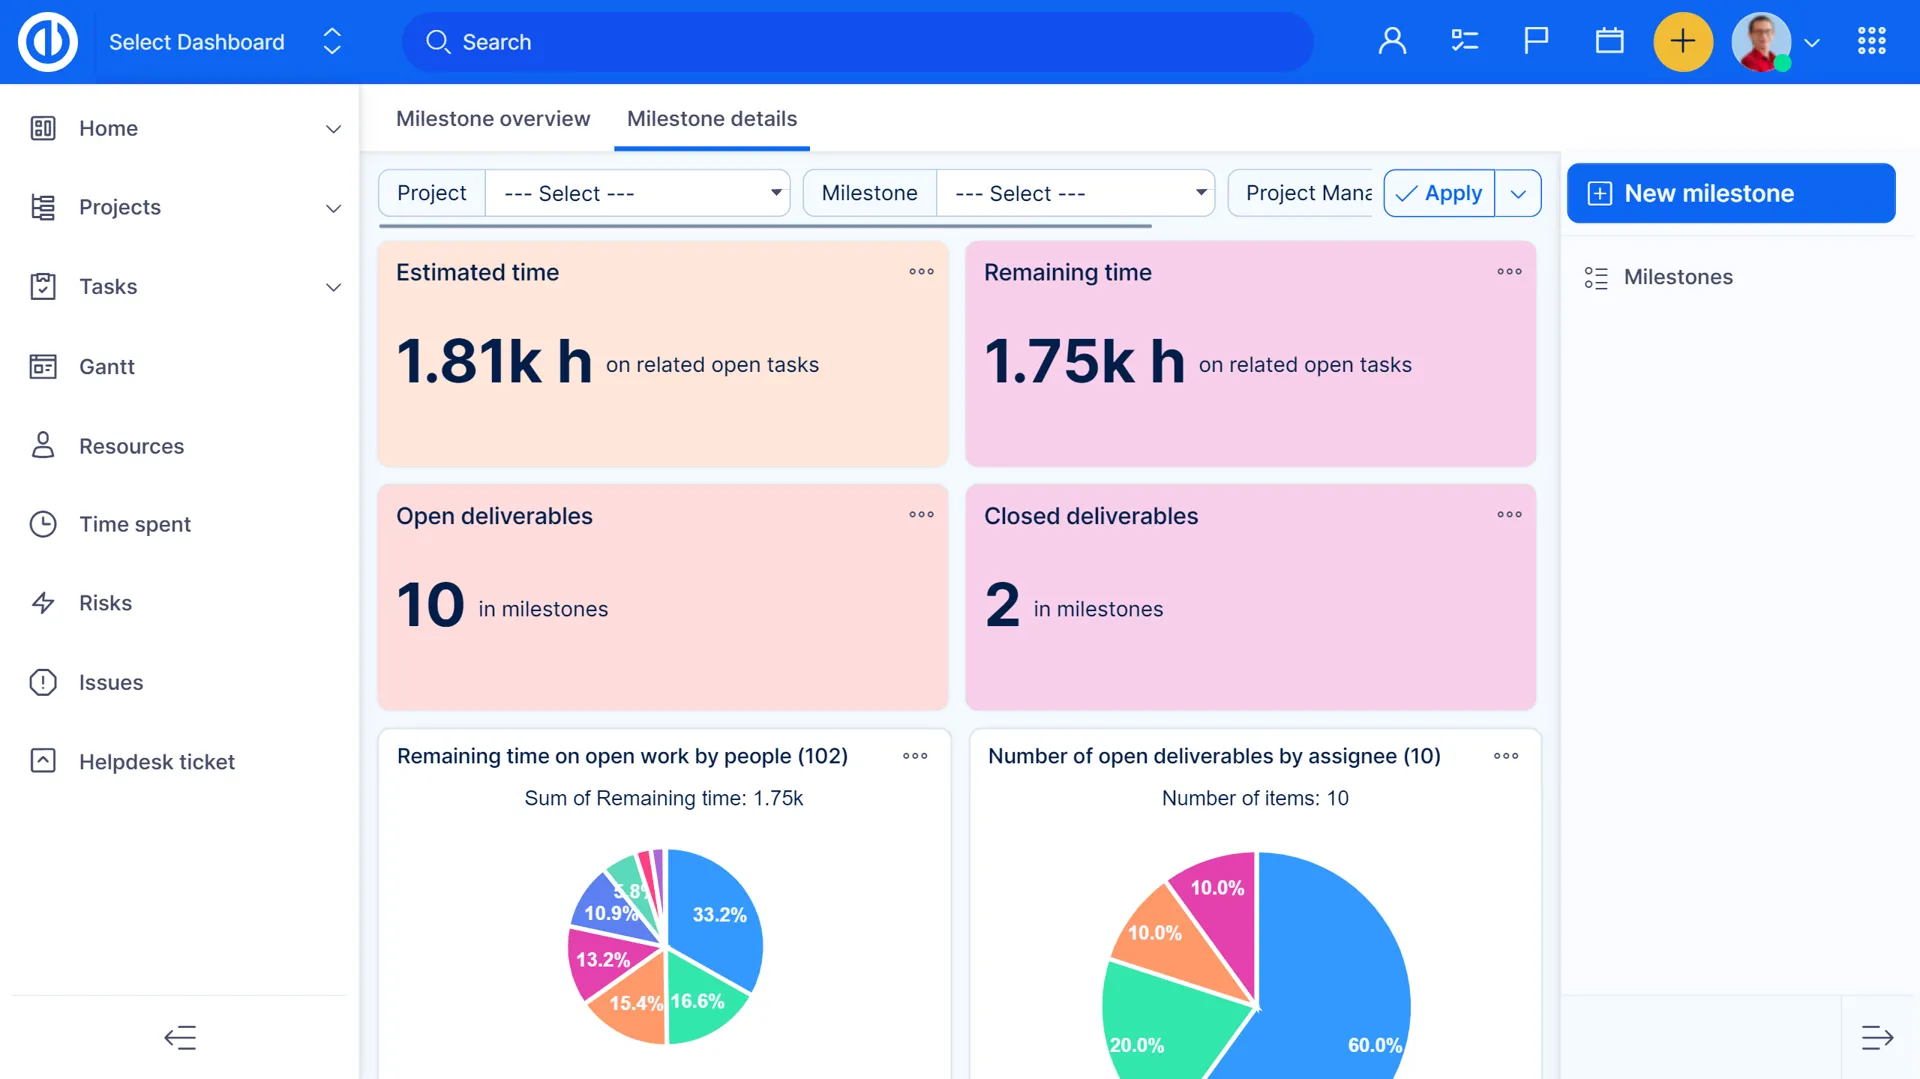
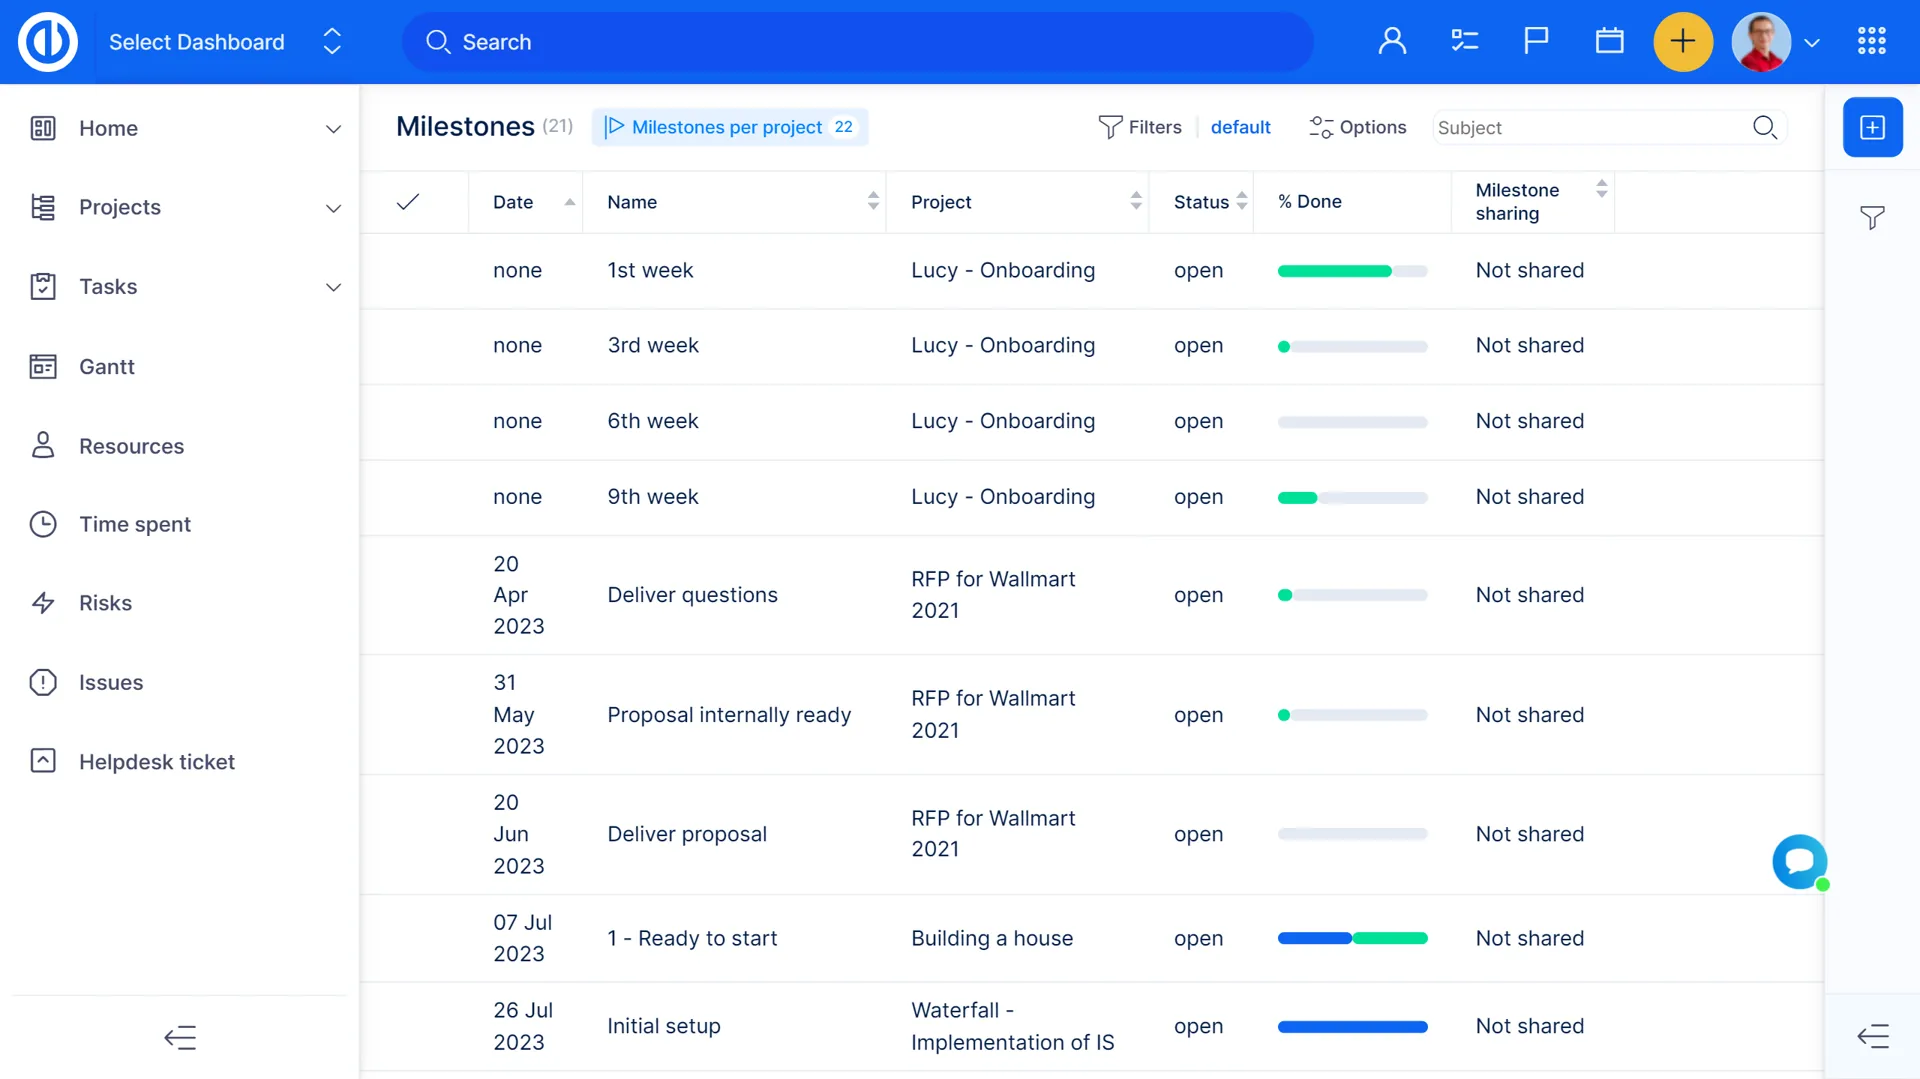
Milestone Dashboard
Track open/closed milestones by projects just like estimated and spent time for individual milestones. This dashboard helps project and portfolio managers see if progress on projects is compliant with an original project plan/schedule.