Easy Project features
The Easy Project includes all the basic project management tools such as Work Management, Agile Management, Time tracking, Portfolio Management, Project controlling & reporting, Project templates and Personal dashboards.
Project Management

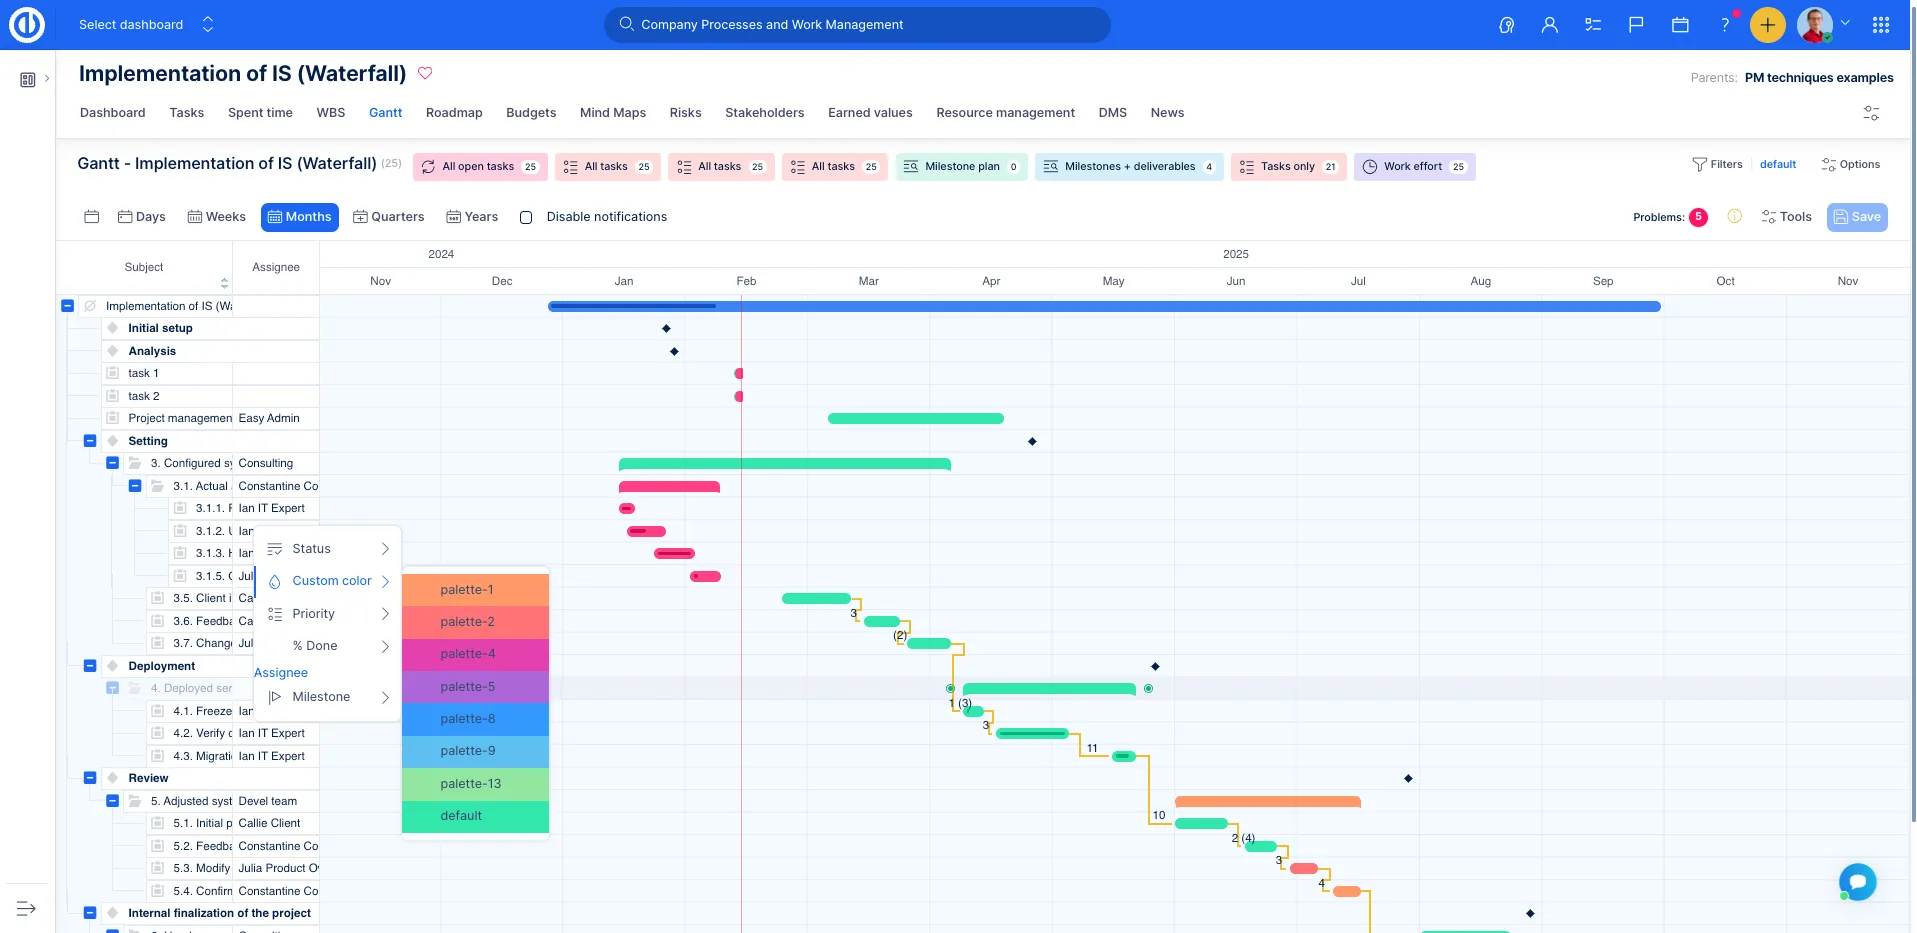
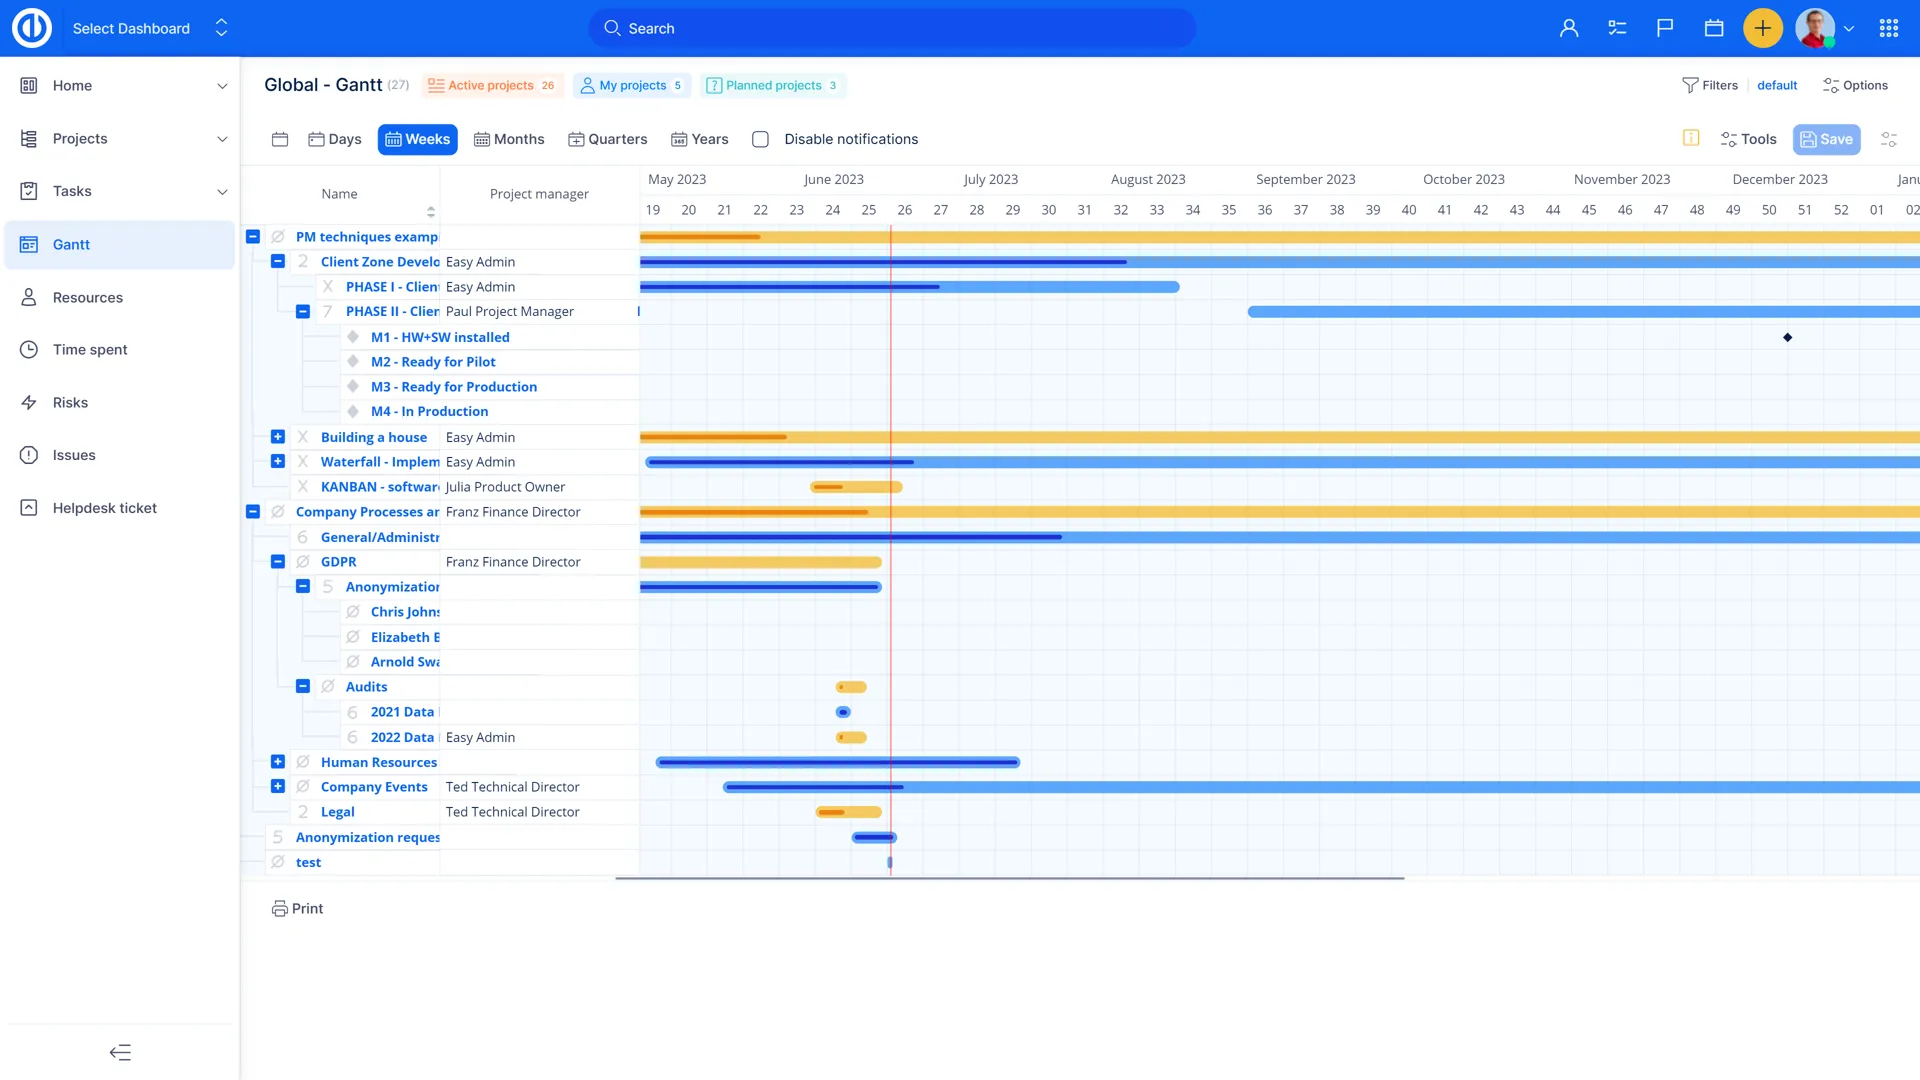
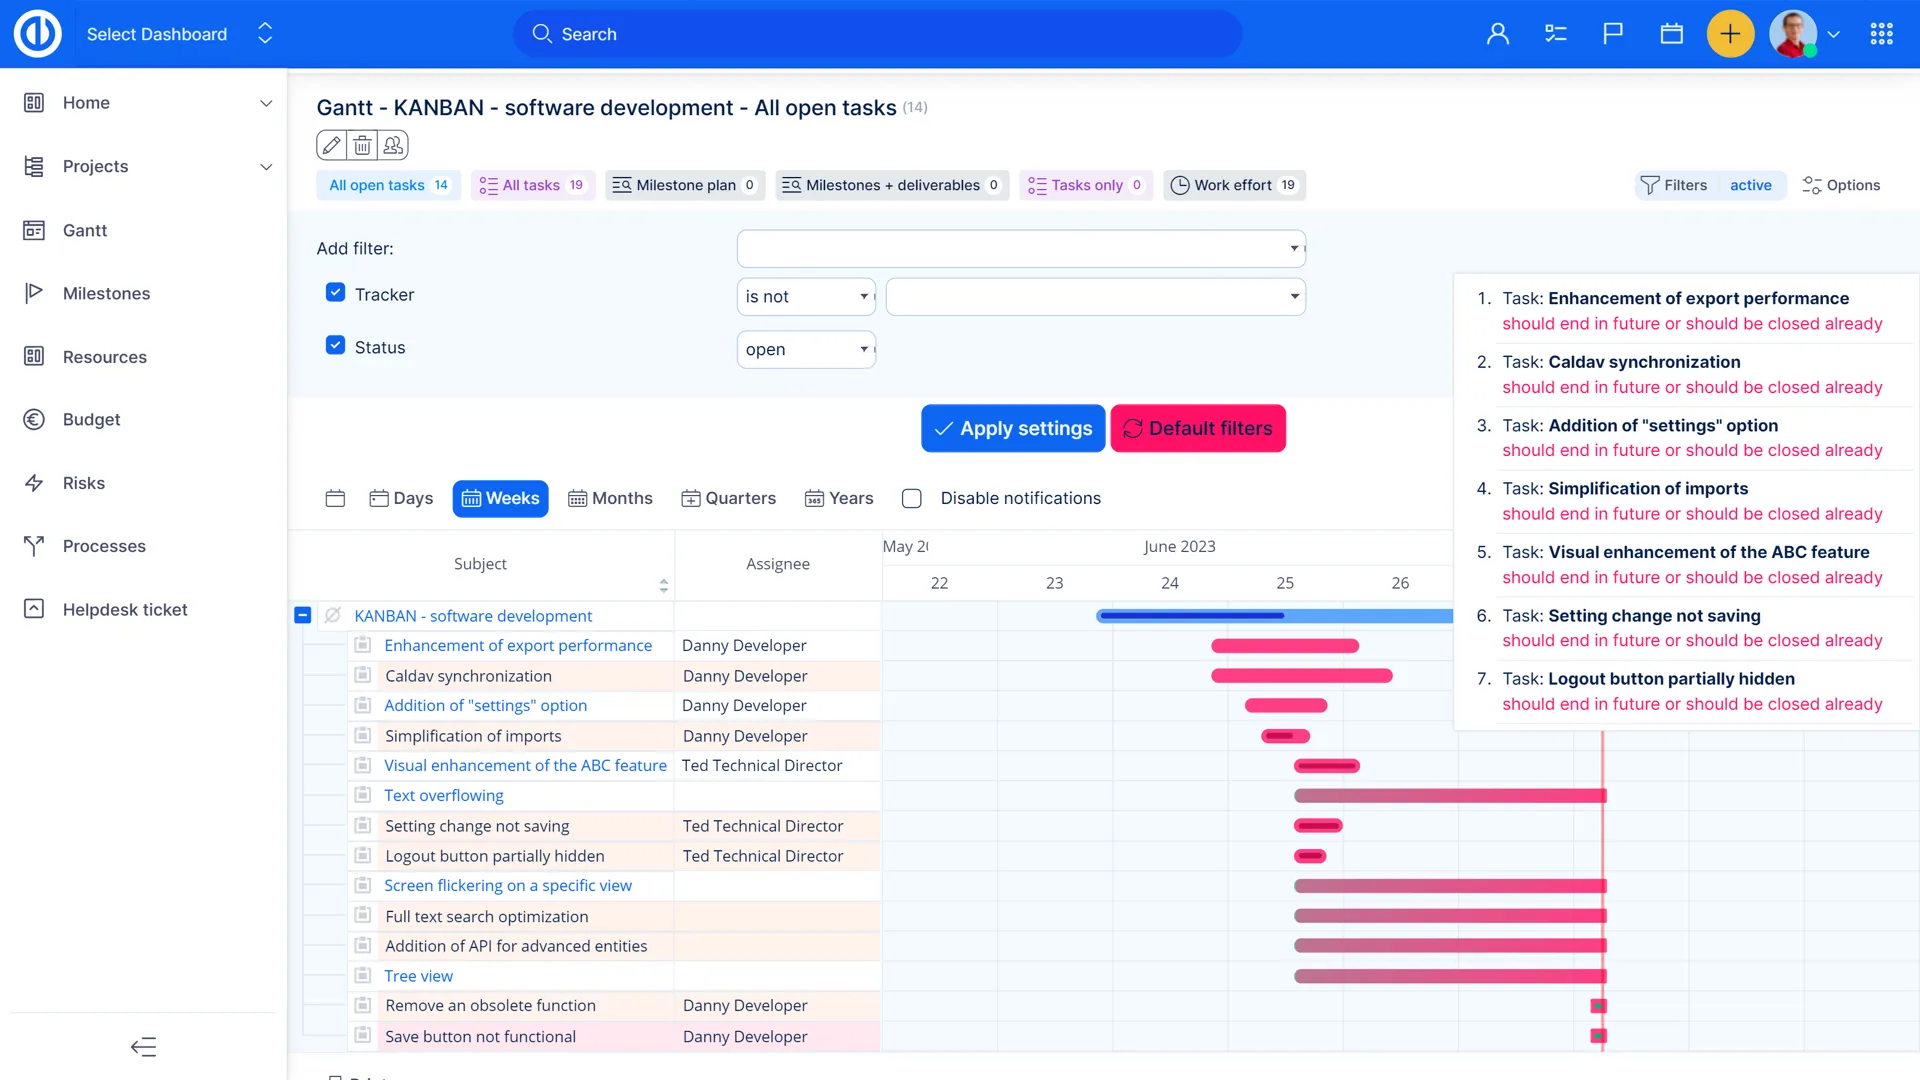
Gantt chart for easy project planning
Visualise, stategise, and oversee your project effortlessly
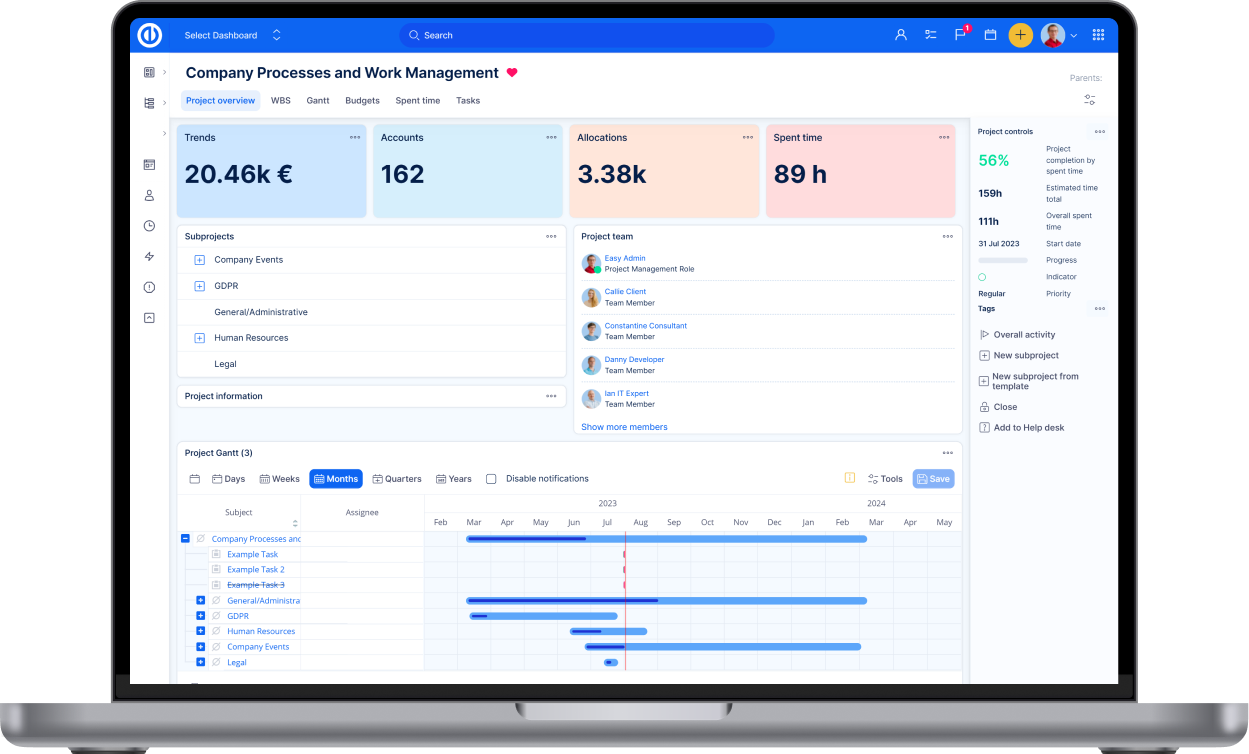
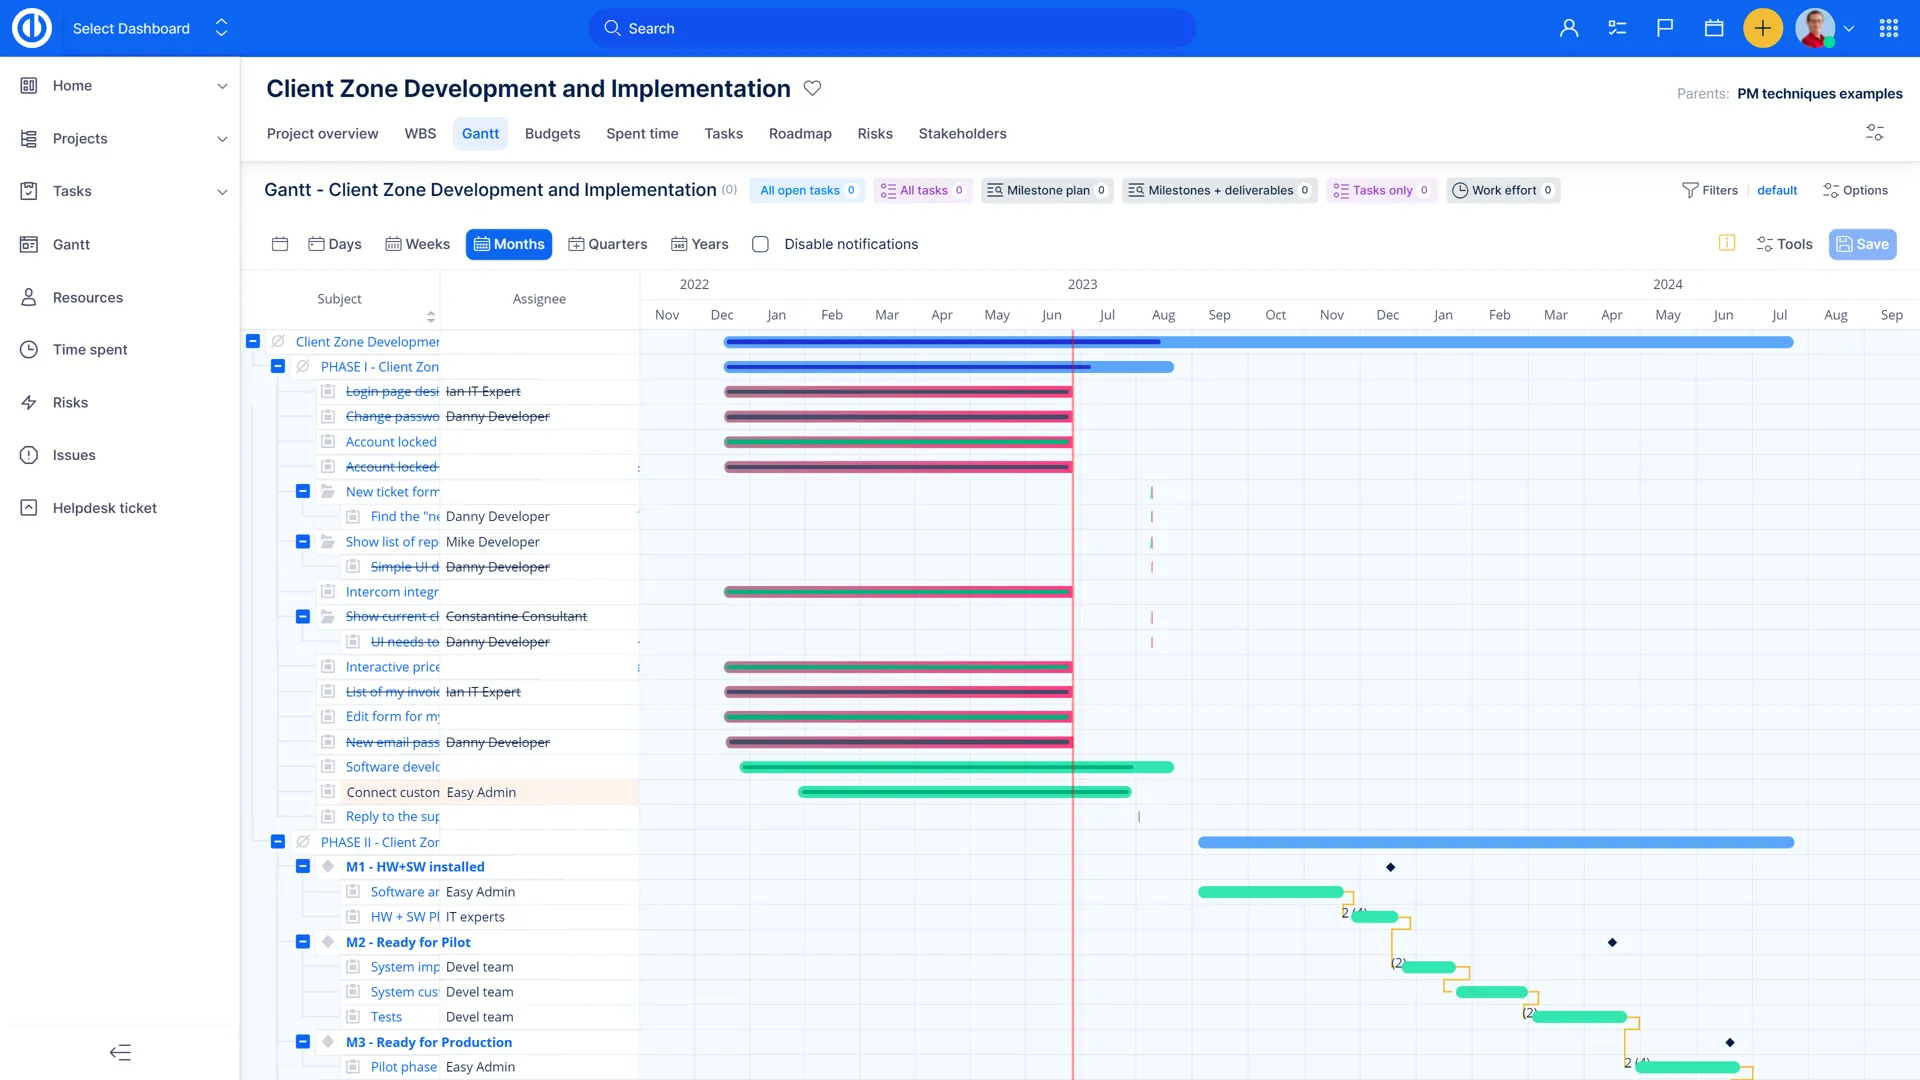
Gain a comprehensive view of your project's progress with Easy Project’s Gantt Chart.
Construct precise timelines, define dependencies, and fine-tune milestones with ease. Our advanced Gantt Chart capabilities optimise your project workflow, enabling structured scheduling, seamless timeline modifications, and a clear perspective on the entire project lifecycle.

WBS – Work Breakdown Structure
Eliminate undefined tasks and delays by using WBS. Clearly parse out projects and define all the deliverables. Quick personal planning and collaborative development of a project’s scope are easy with WBS.
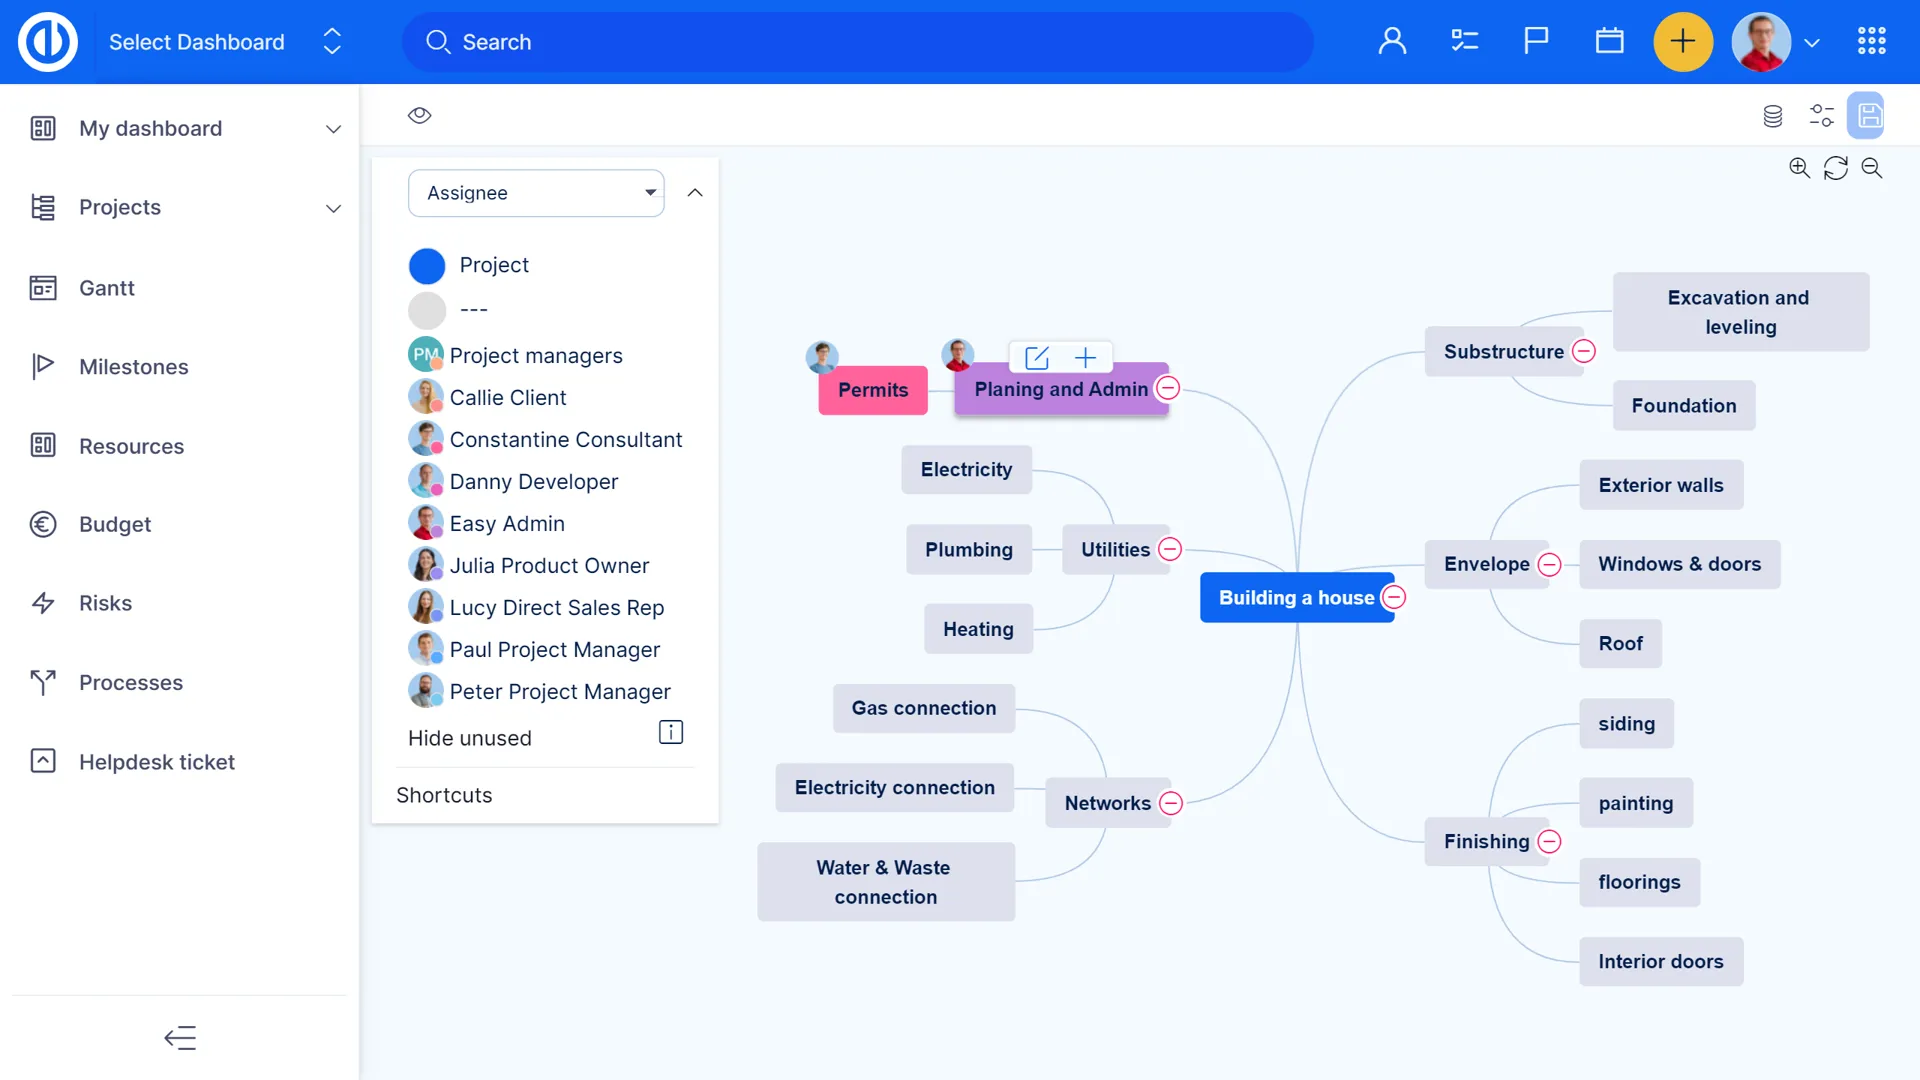
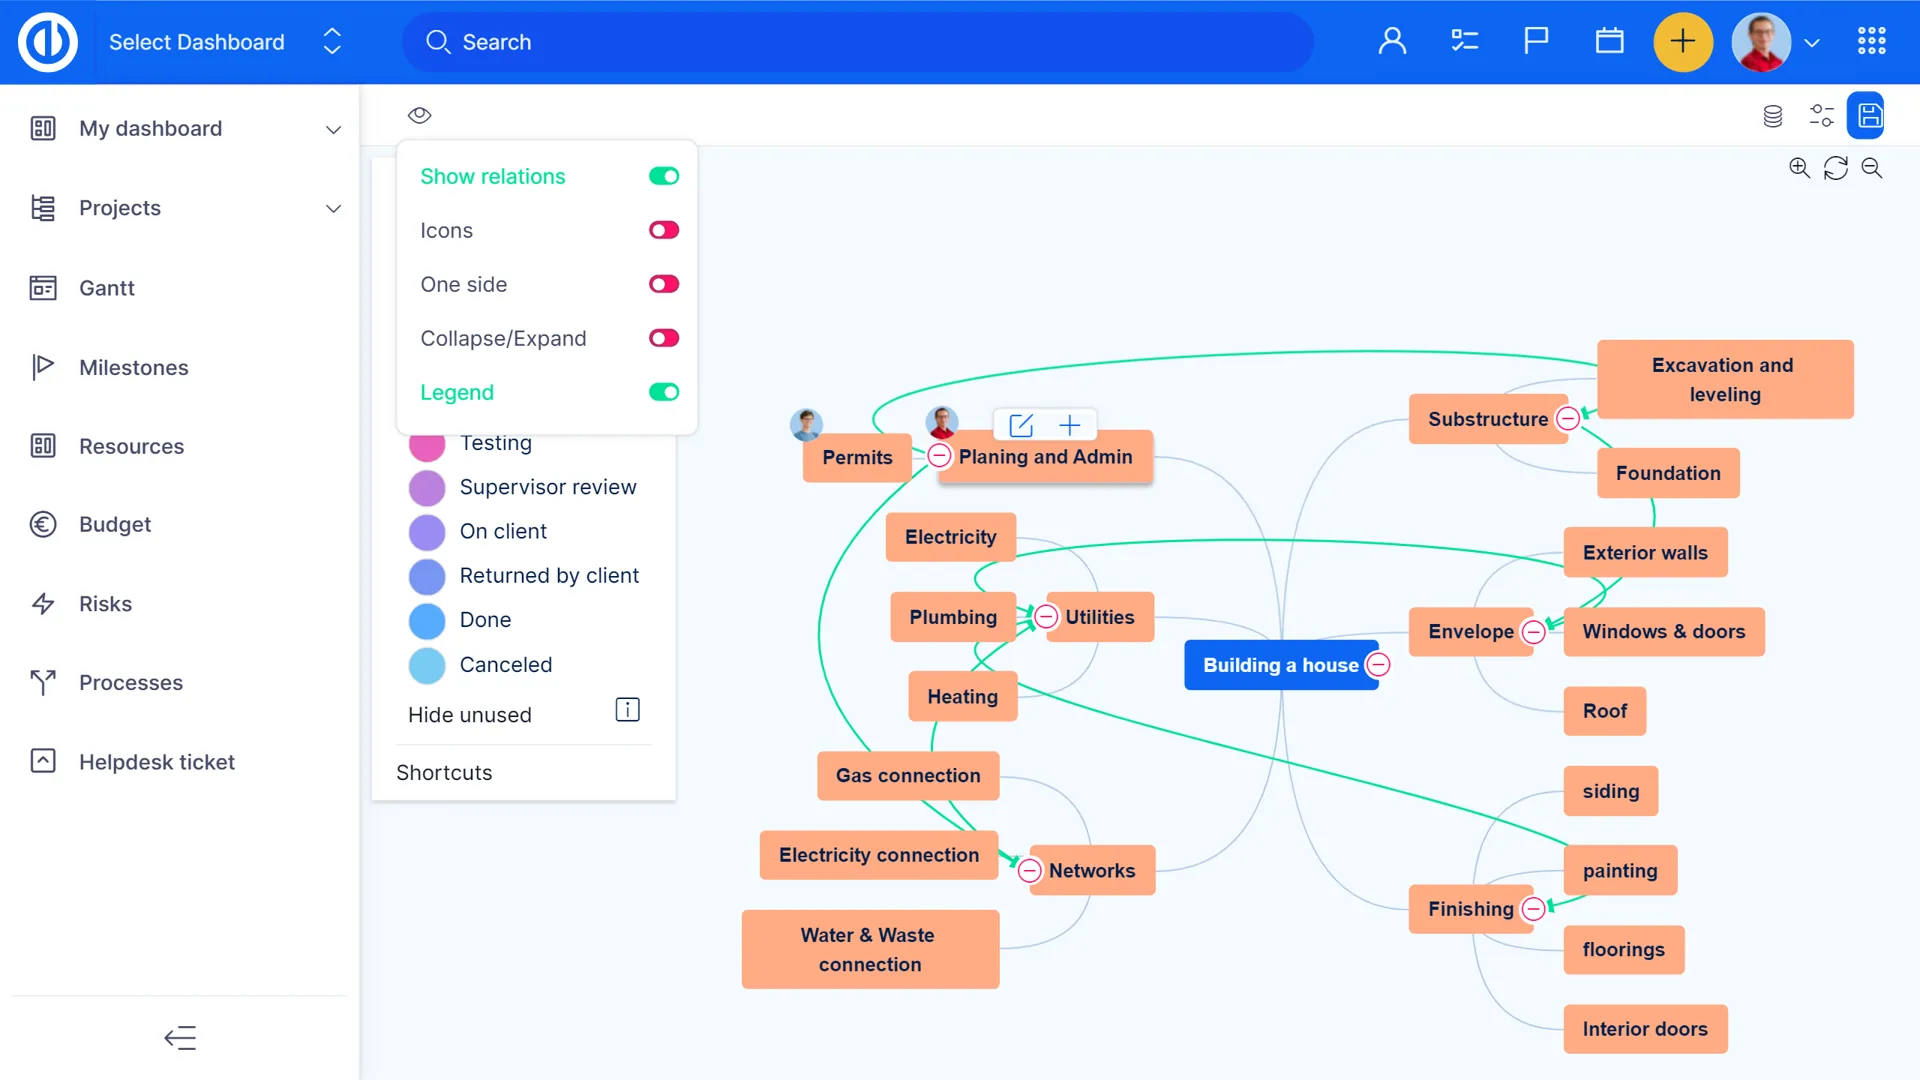
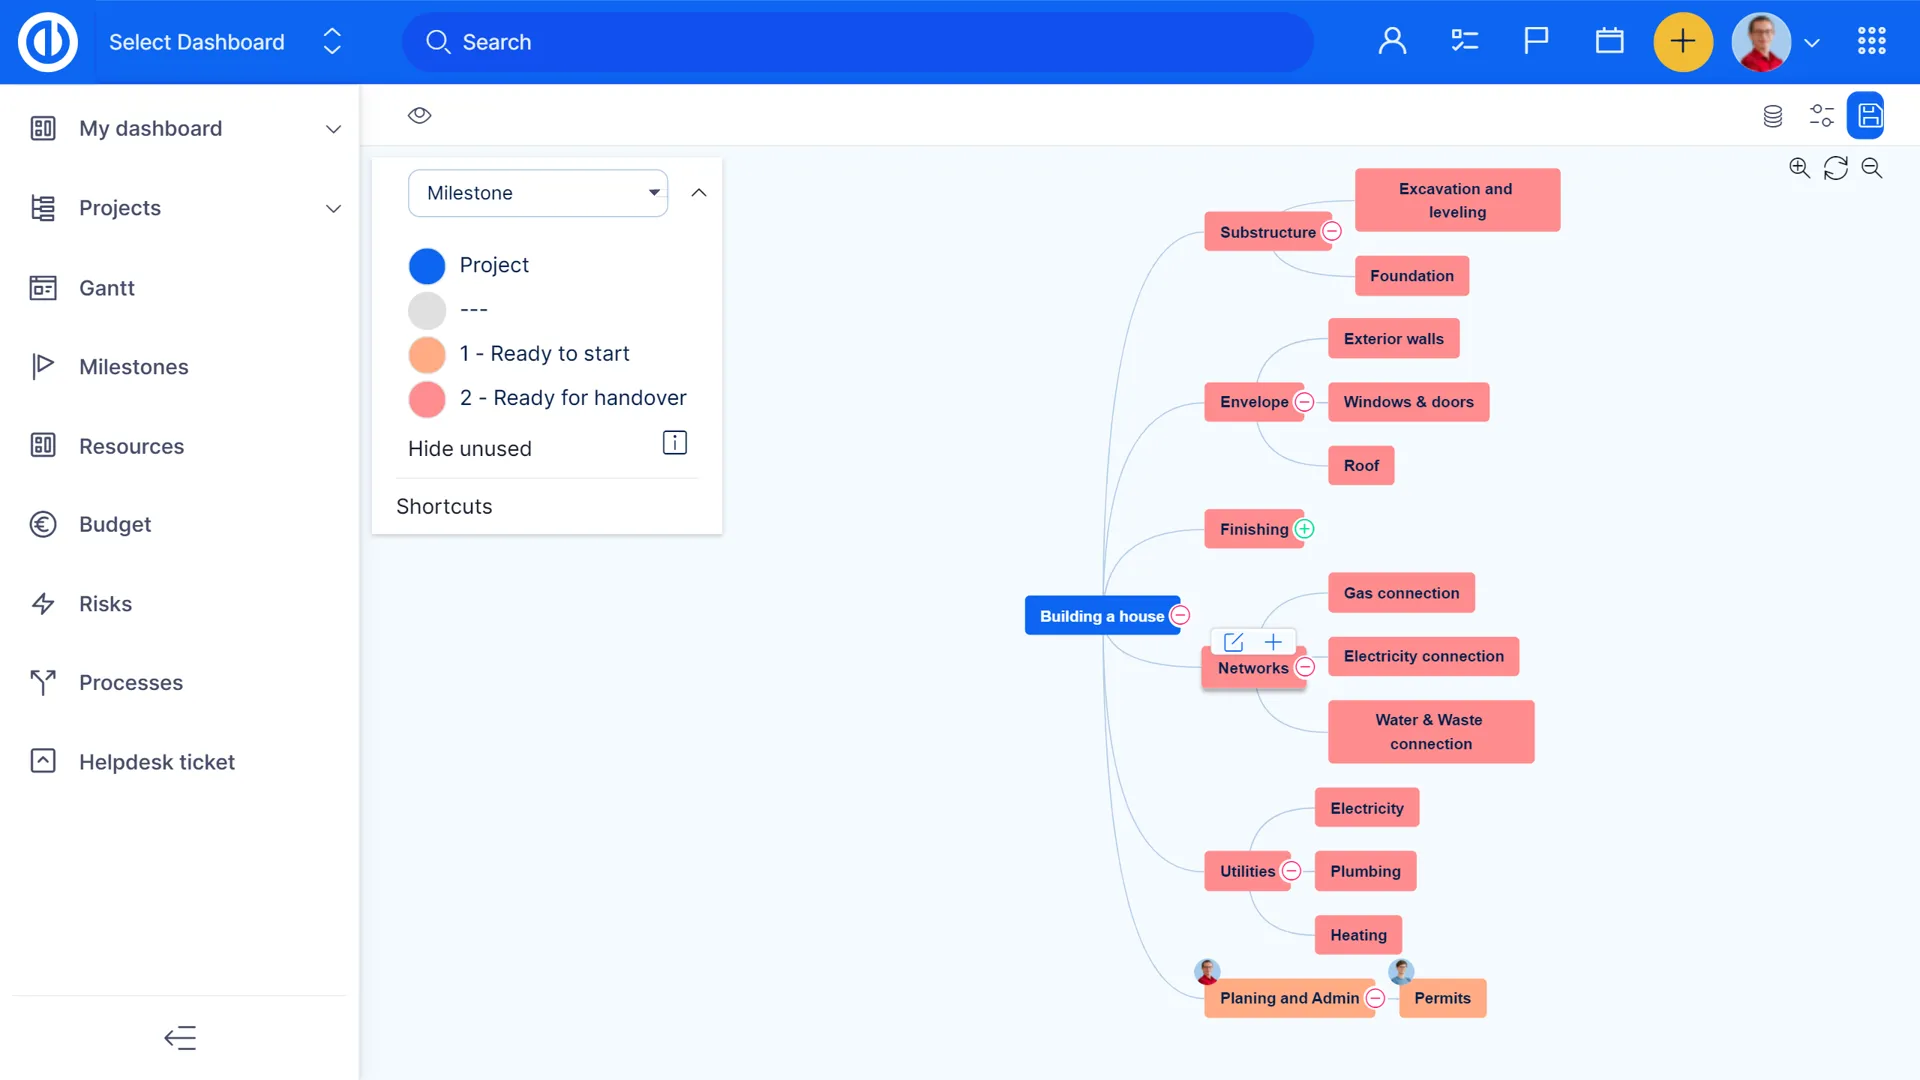

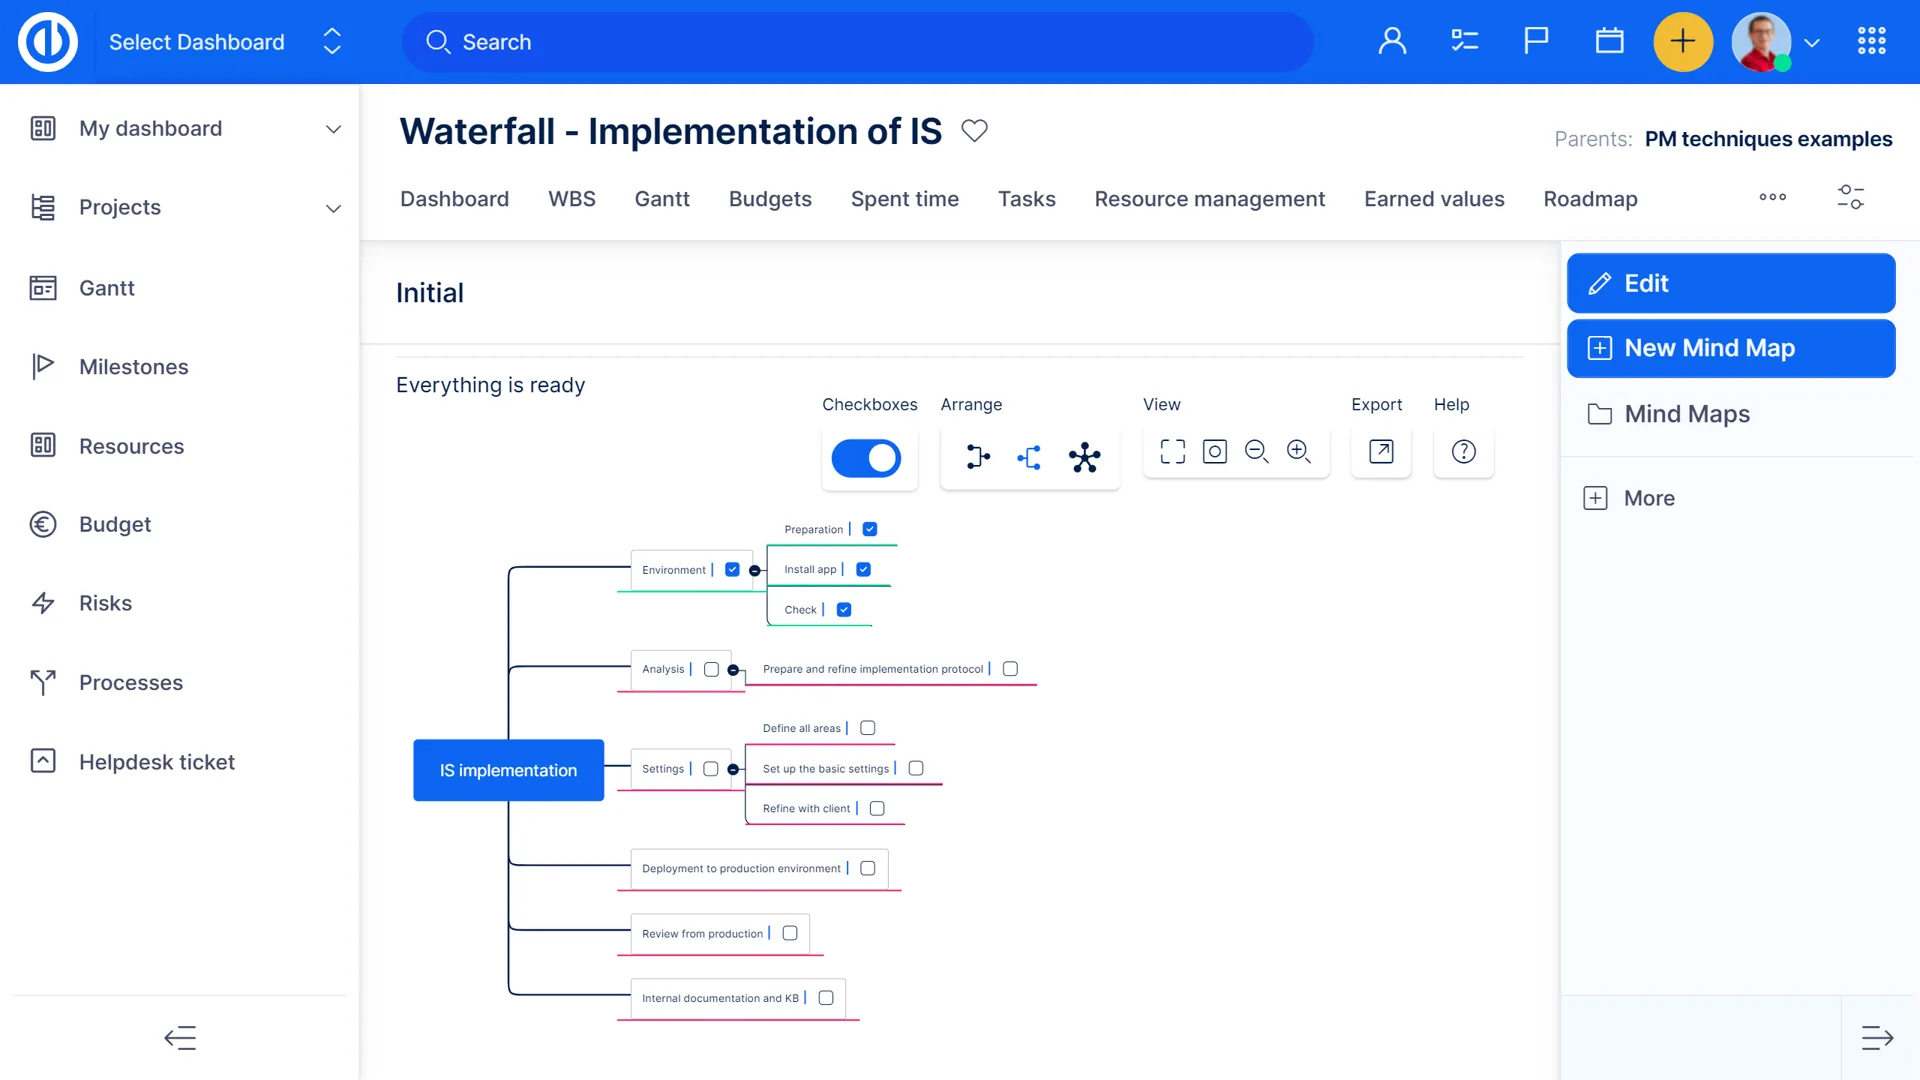
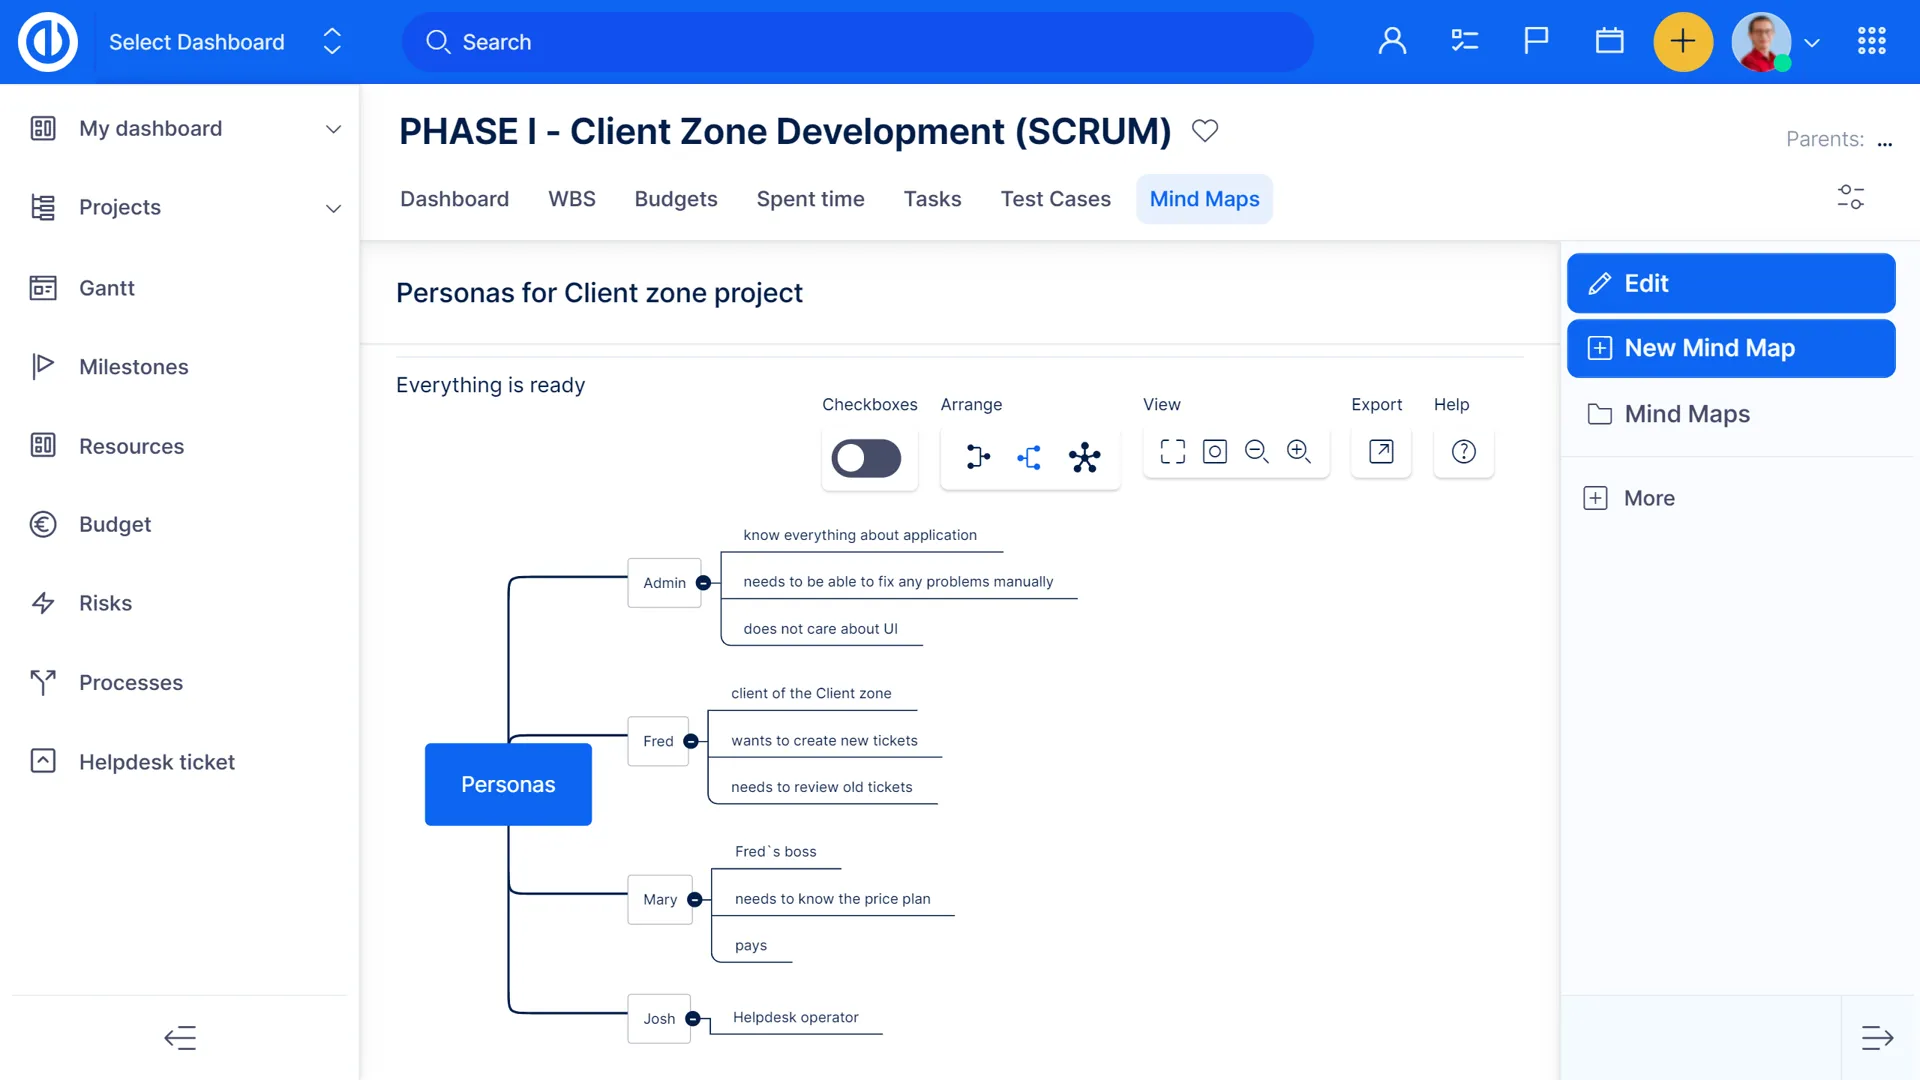
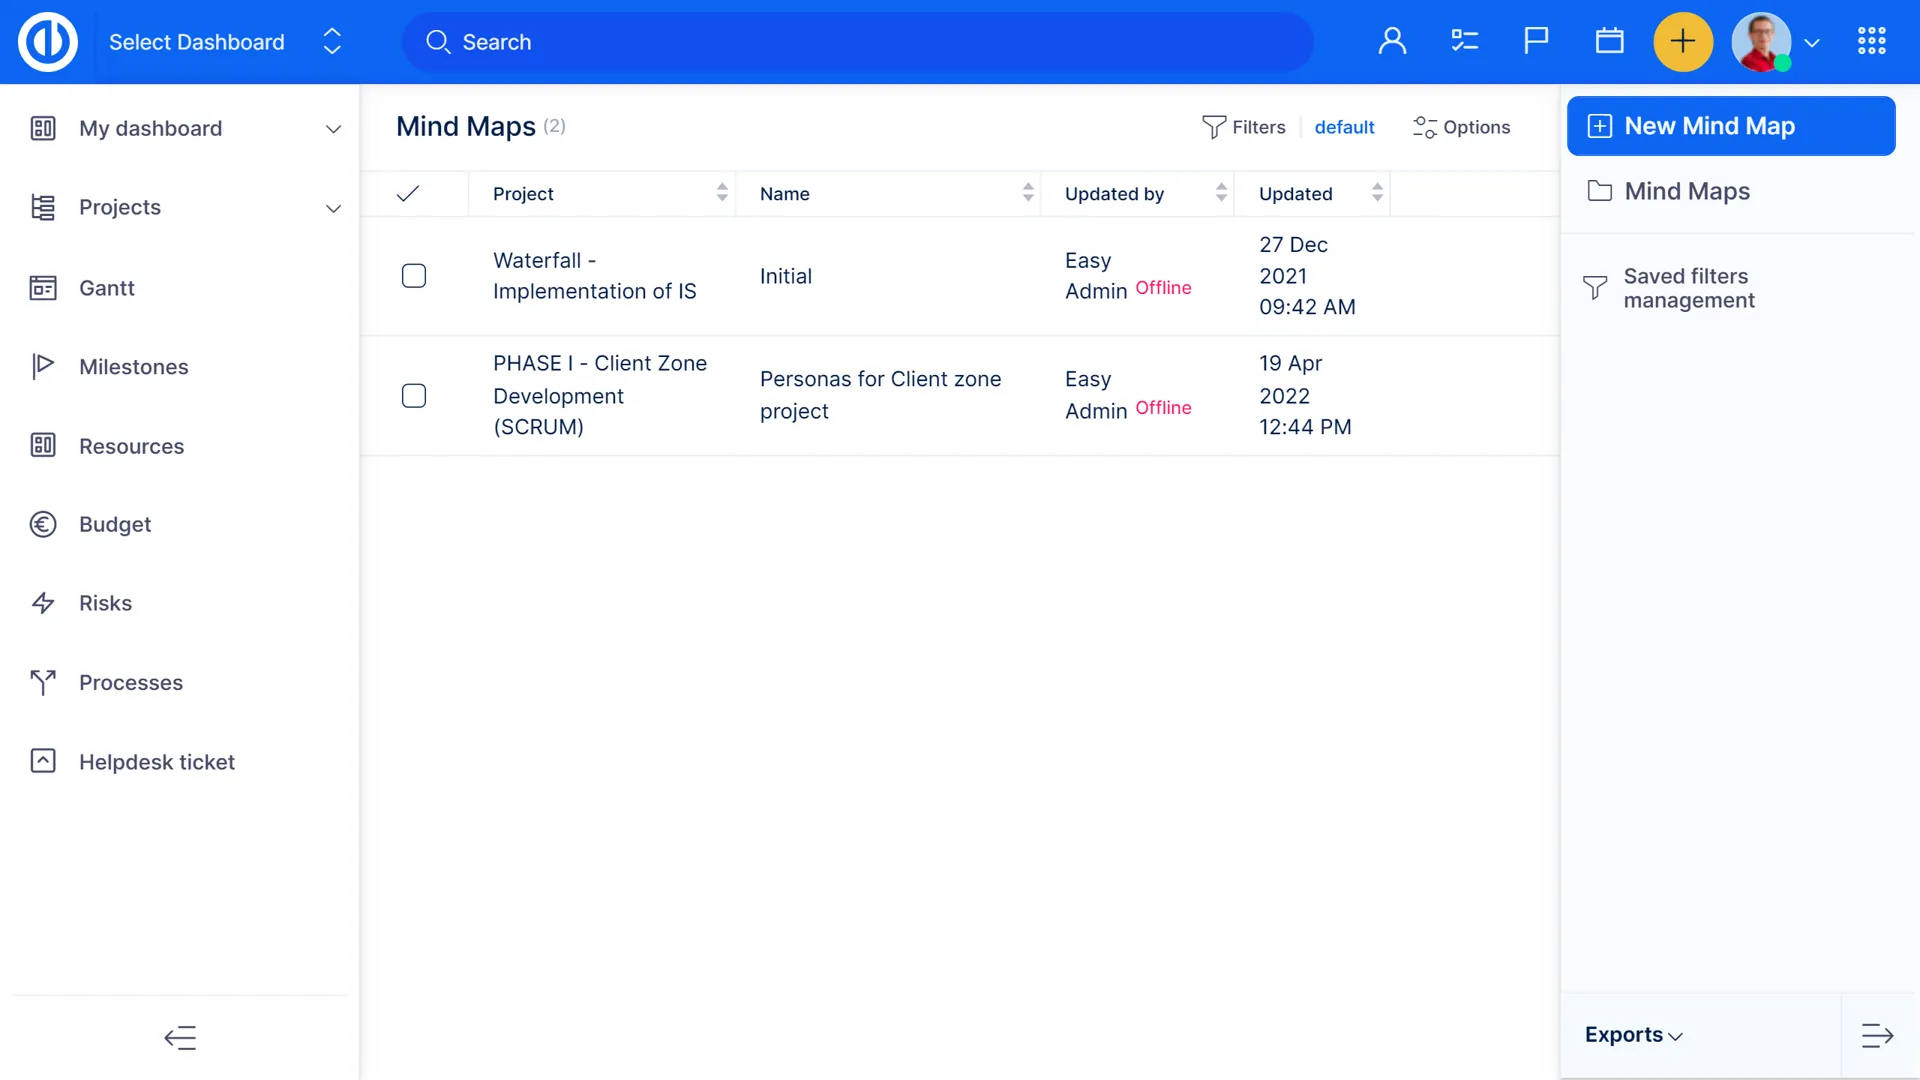
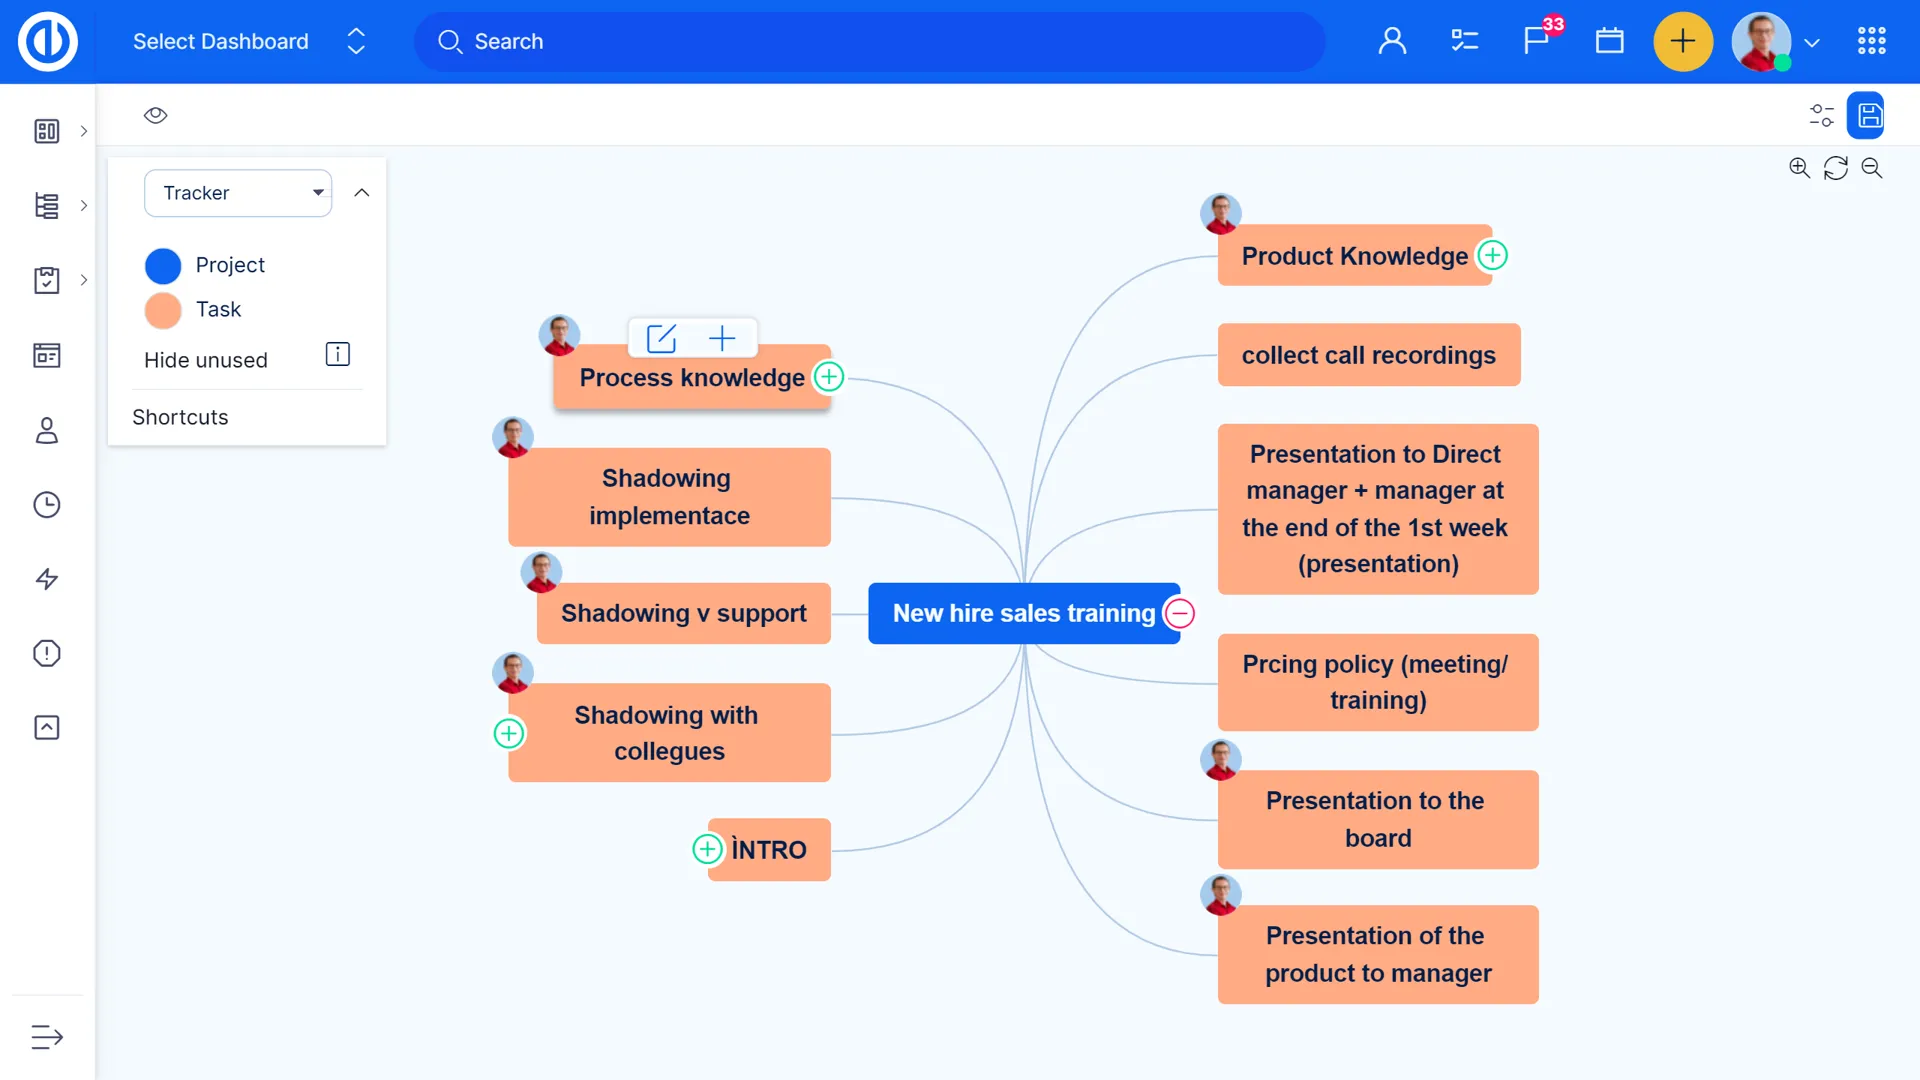
Mind Maps
Mind Maps are used for better planning, brainstorming, and creation of project and process diagrams. You can use them to organize your thoughts about any project without having to create tasks. Unlike WBS, they are designed more for the initiation and analysis phase of a project when it is not yet necessary to create tasks and collaborate but, above all, to analyze and think about all parts of the project or process.

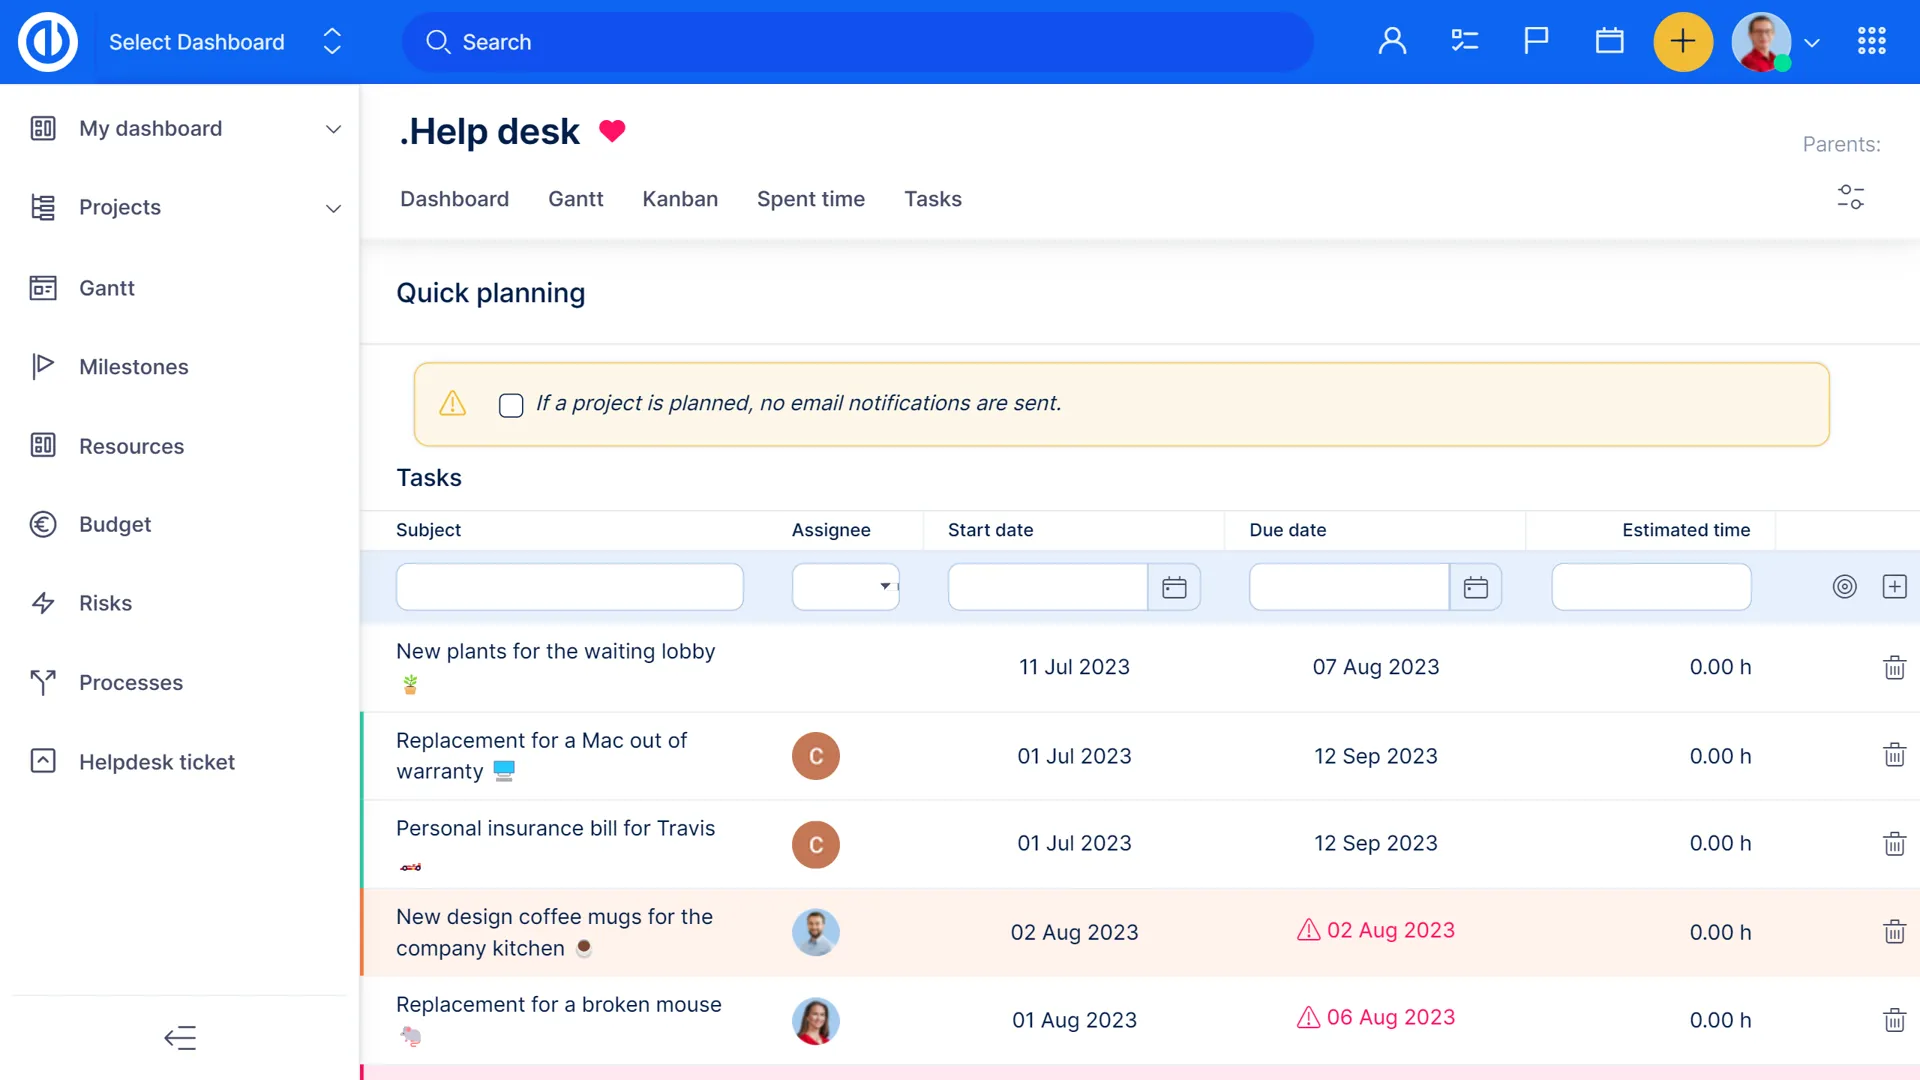
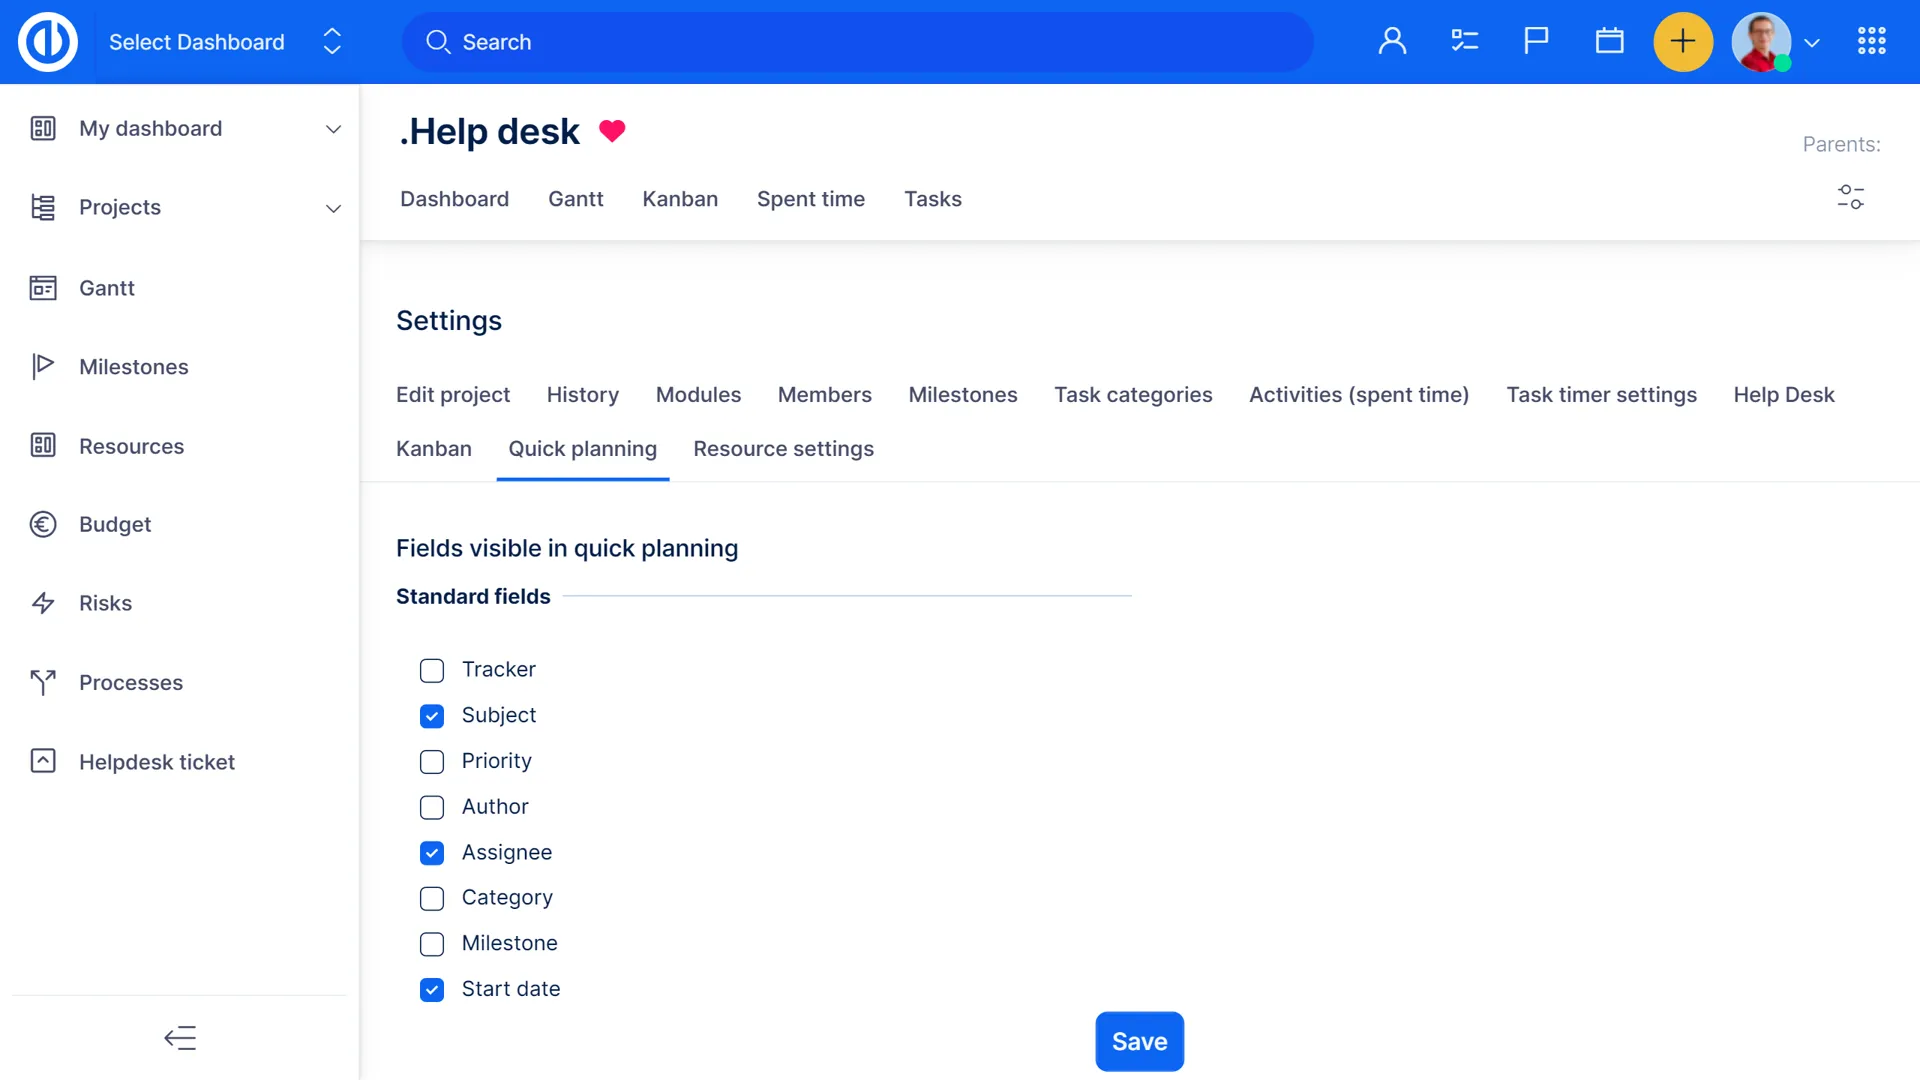
Quick Project Planner
Quickly plan complete projects by entering the basic task details: name, duration, and due date. Available through the sidebar of your project page, the planner will allow you to take note of tasks during both the brainstorming and preliminary project definition stages.

Project roadmap
Get an instant overview of your project goals in the form of milestones and all the tasks that need to be completed. With Project Roadmap, you get an instant overview of the whole project plan.

ISO certifications for data security
Easy Project is honoured to have earned validation and accreditation from prominent organisations via various respected ISO certifications. With our adaptive project and work management suite you can focus on innovation and growth, knowing that your project management needs are in capable hands. These certifications reflect our dedication to helping technology teams, like yours, manage complex projects efficiently and securely:

100% GDPR compliant
Easy Software takes personal data protection seriously. European regulation known as general Data Protection Regulation (GDPR) brings a number of challenges to all organizations and became one of the most resonated business topics. Our mission is to provide Easy Project clients and basically all Project community with a reliable software which allows fulfilling all duties of Data Processors efficiently. Easy Project is 100% GDPR-ready from version 1.3 (May 2018).

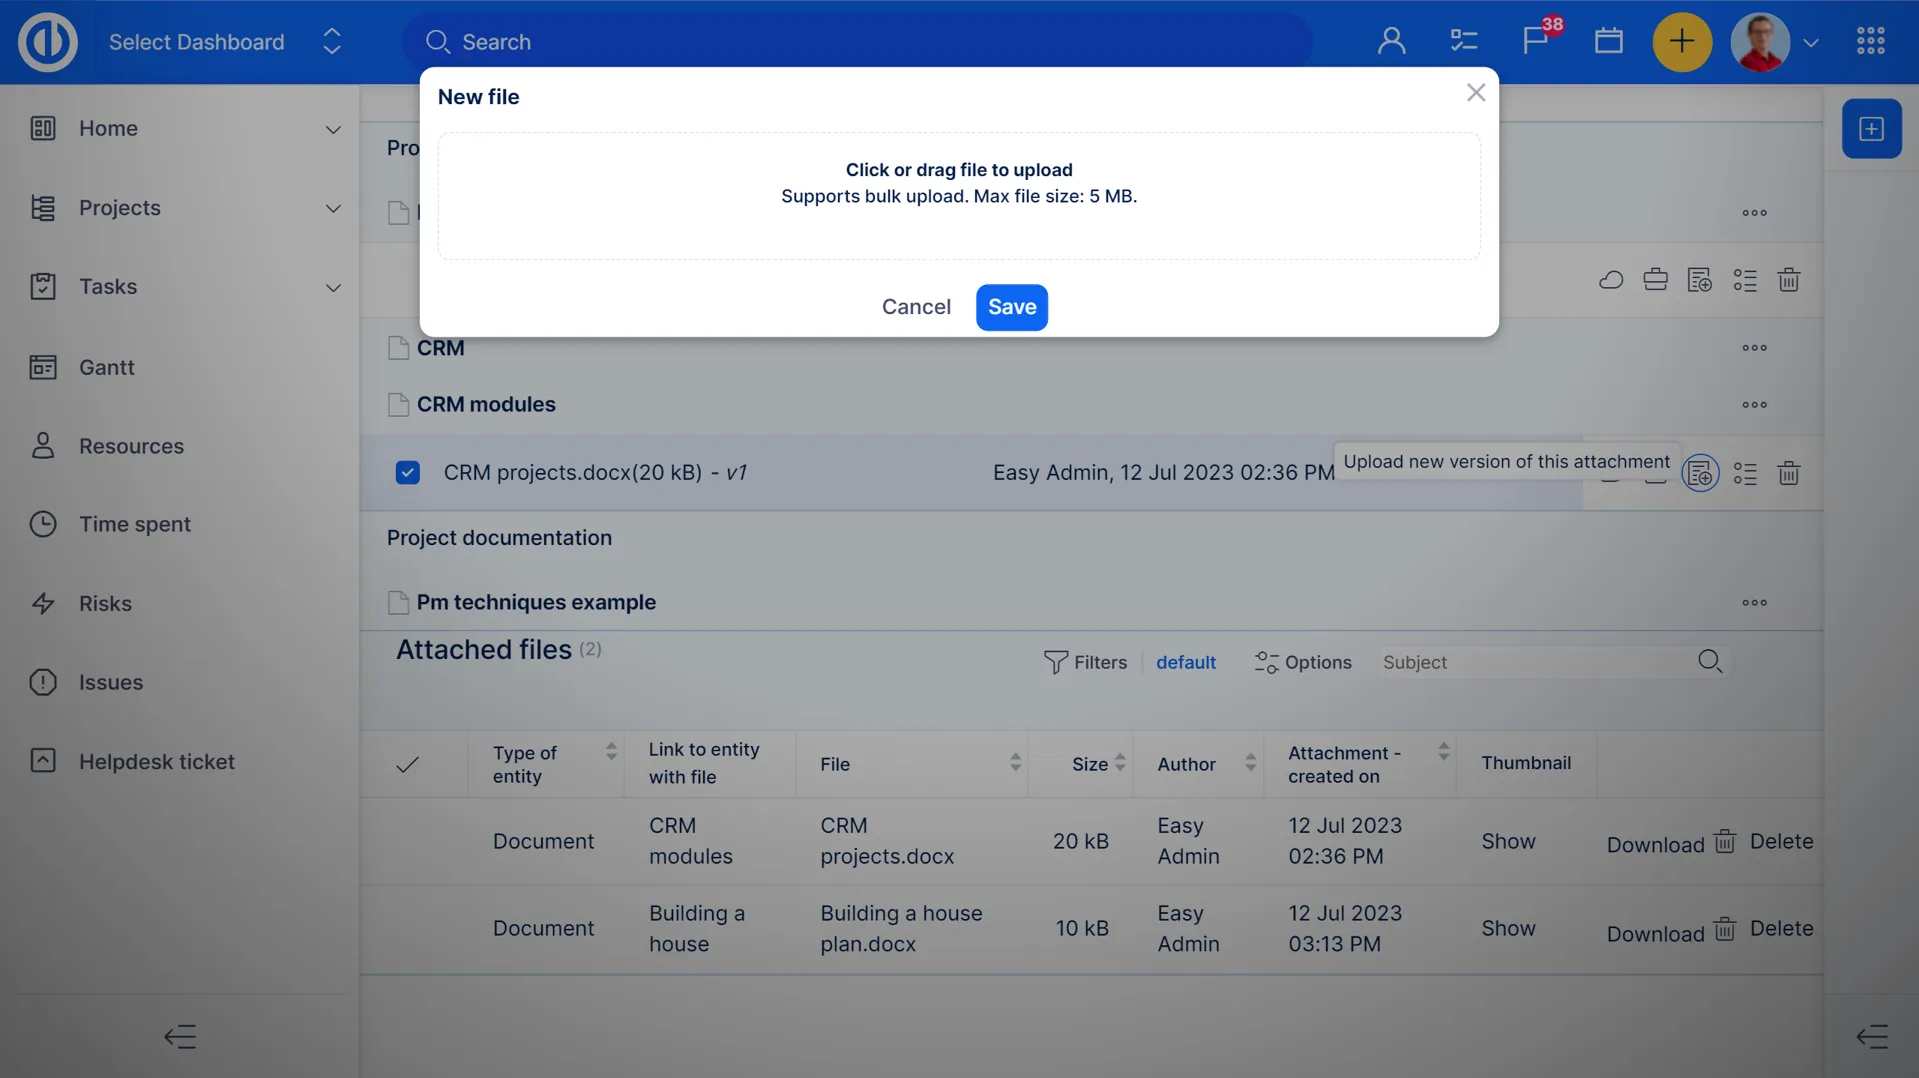
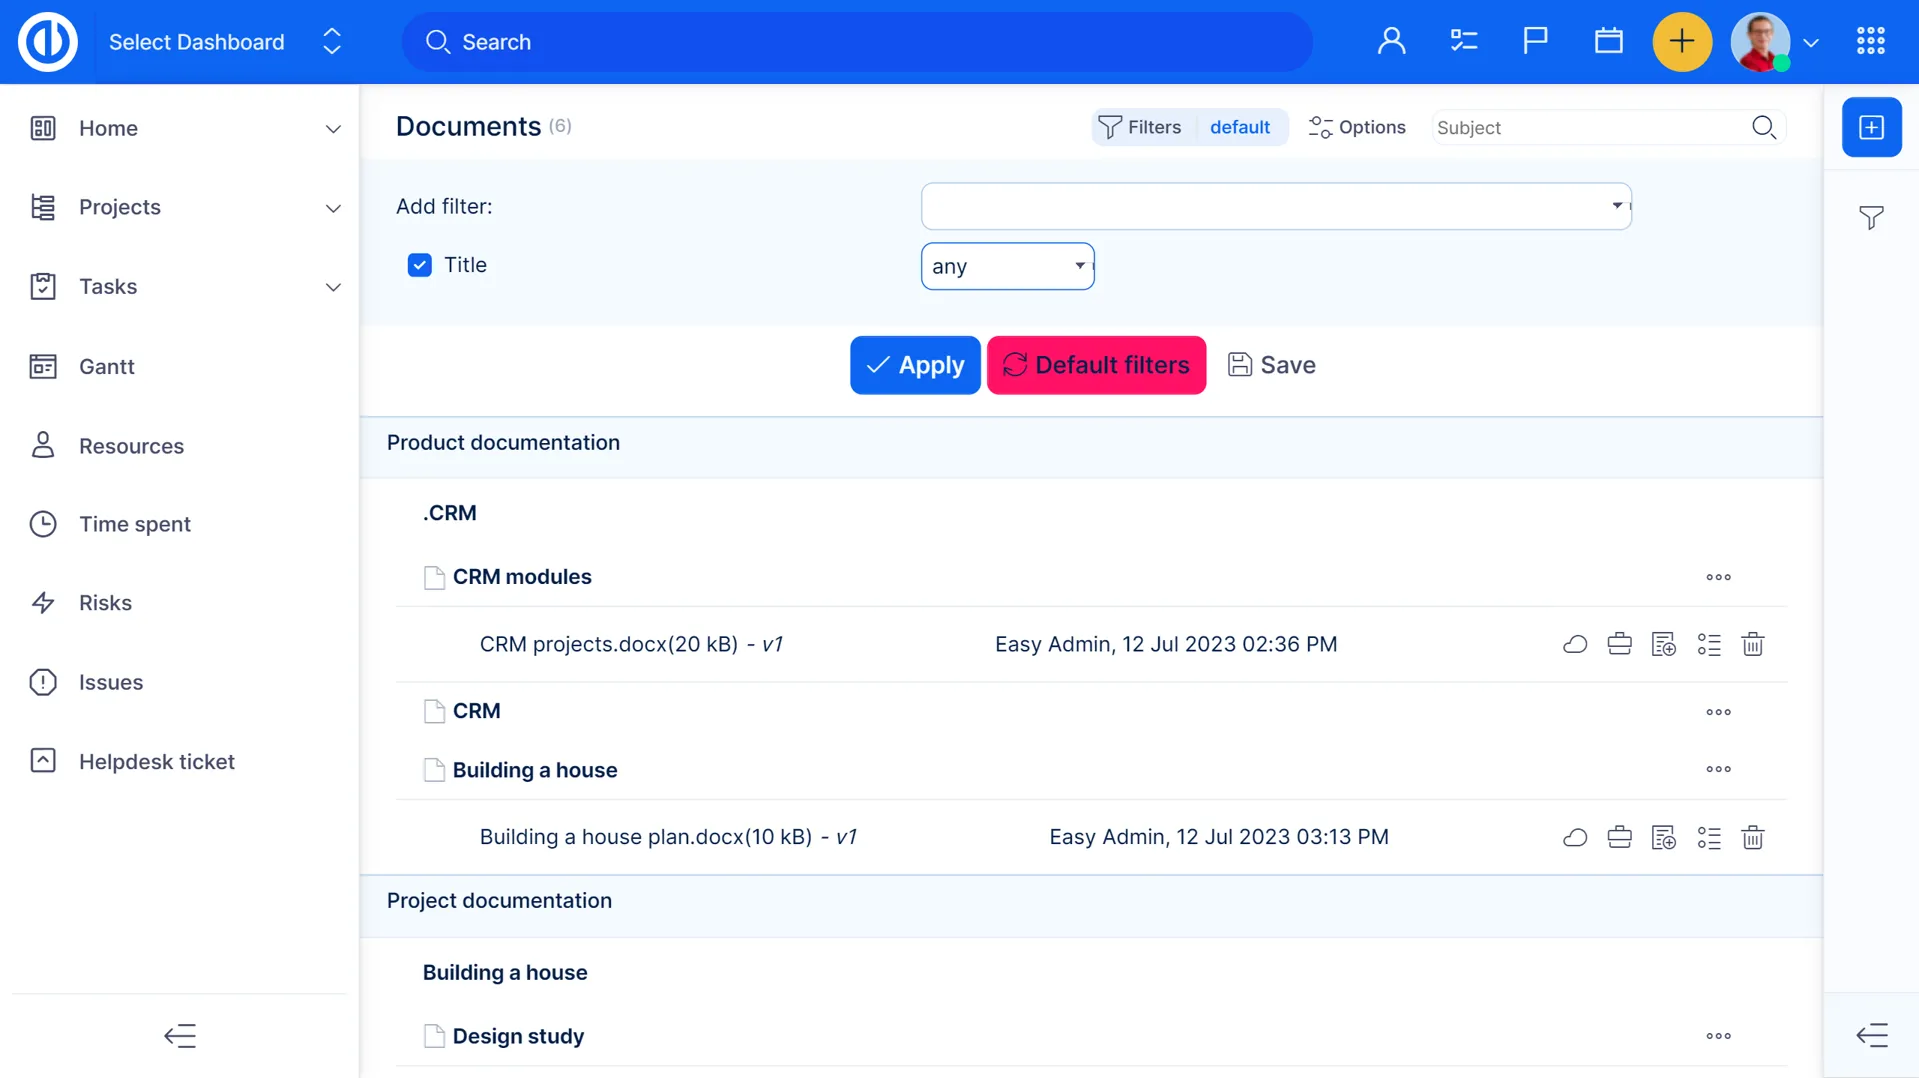
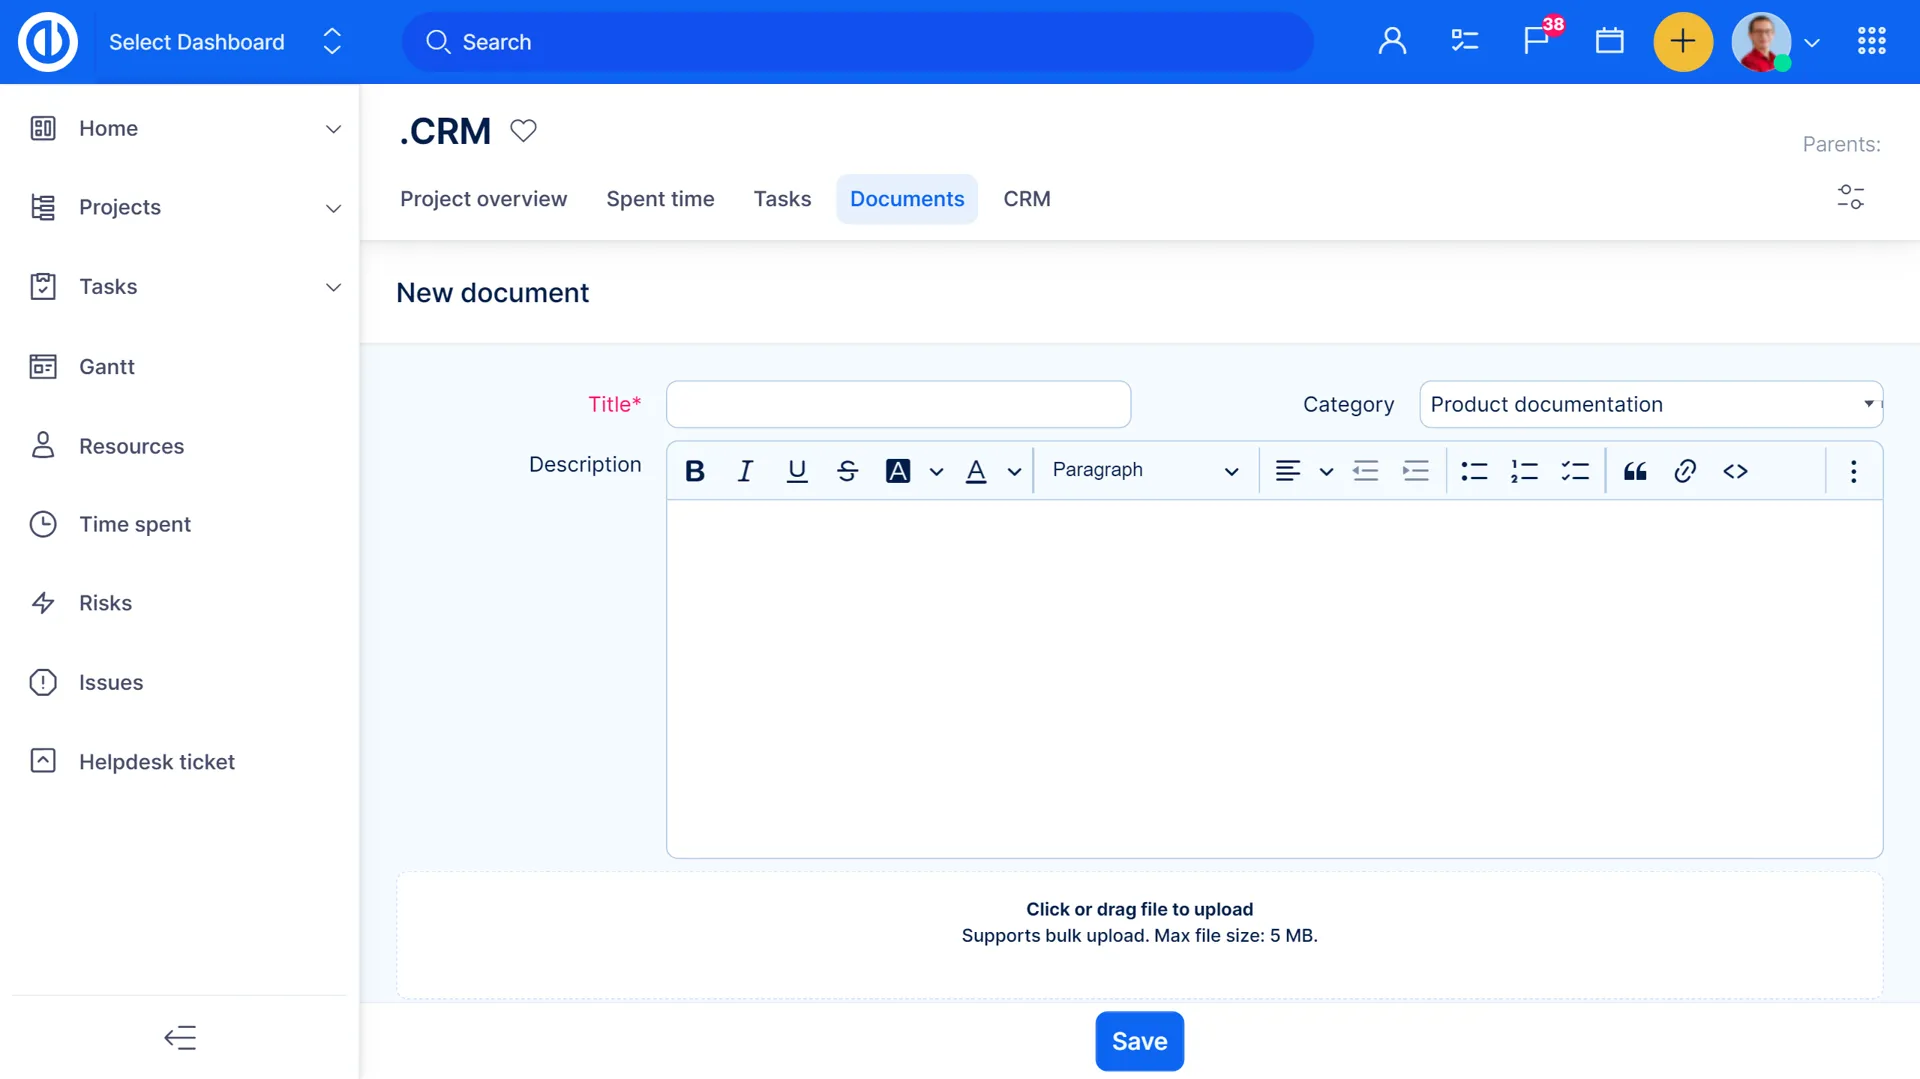
Project Documents
Documents can be attached to tasks and projects and then easily searched, versioned, and edited online. Under the Documents module you can find a complete overview of all the attachments from a specific project and tasks related to each of them.
Critical path of the project
A critical path is a sequence of tasks that cannot be delayed or else the whole project would be delayed. Also, it shows the shortest time that the project can be completed. A task within the project is considered critical if its due date can not be delayed since it would directly affect the project completion date.

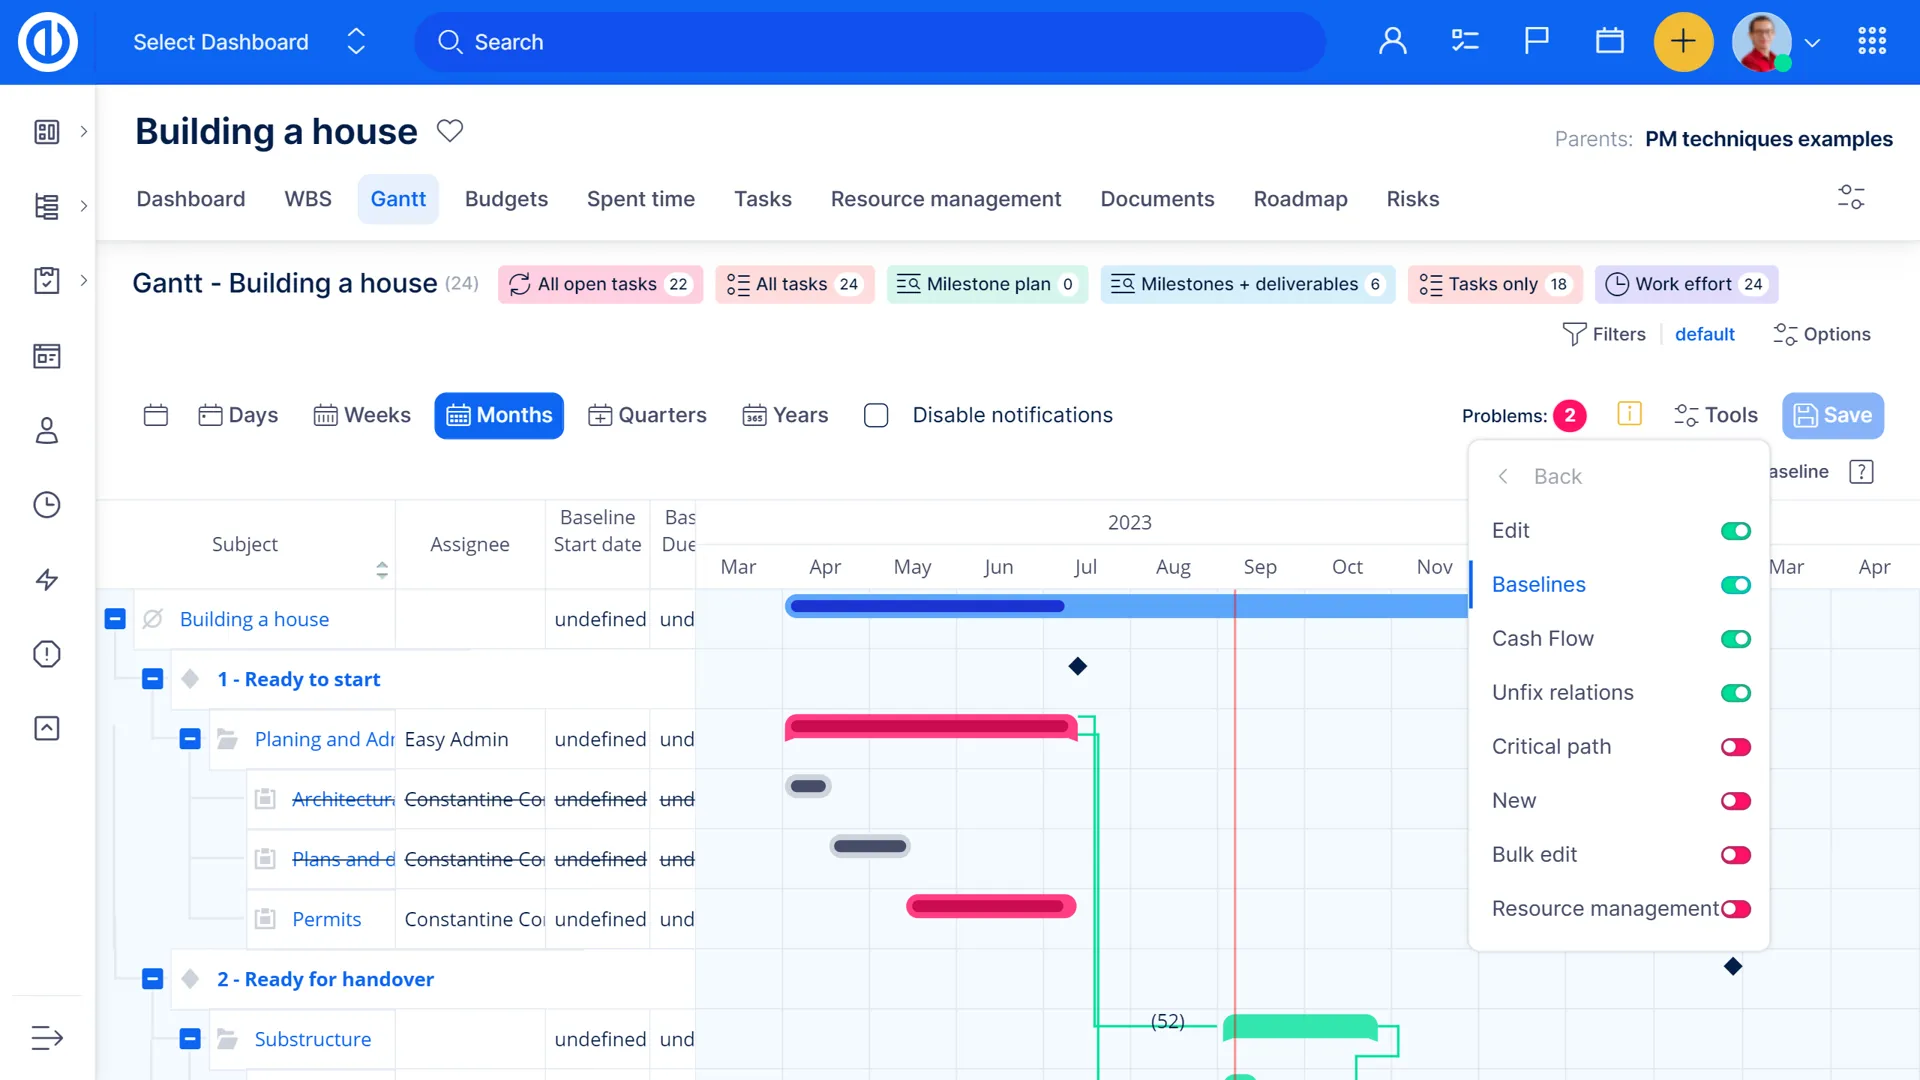
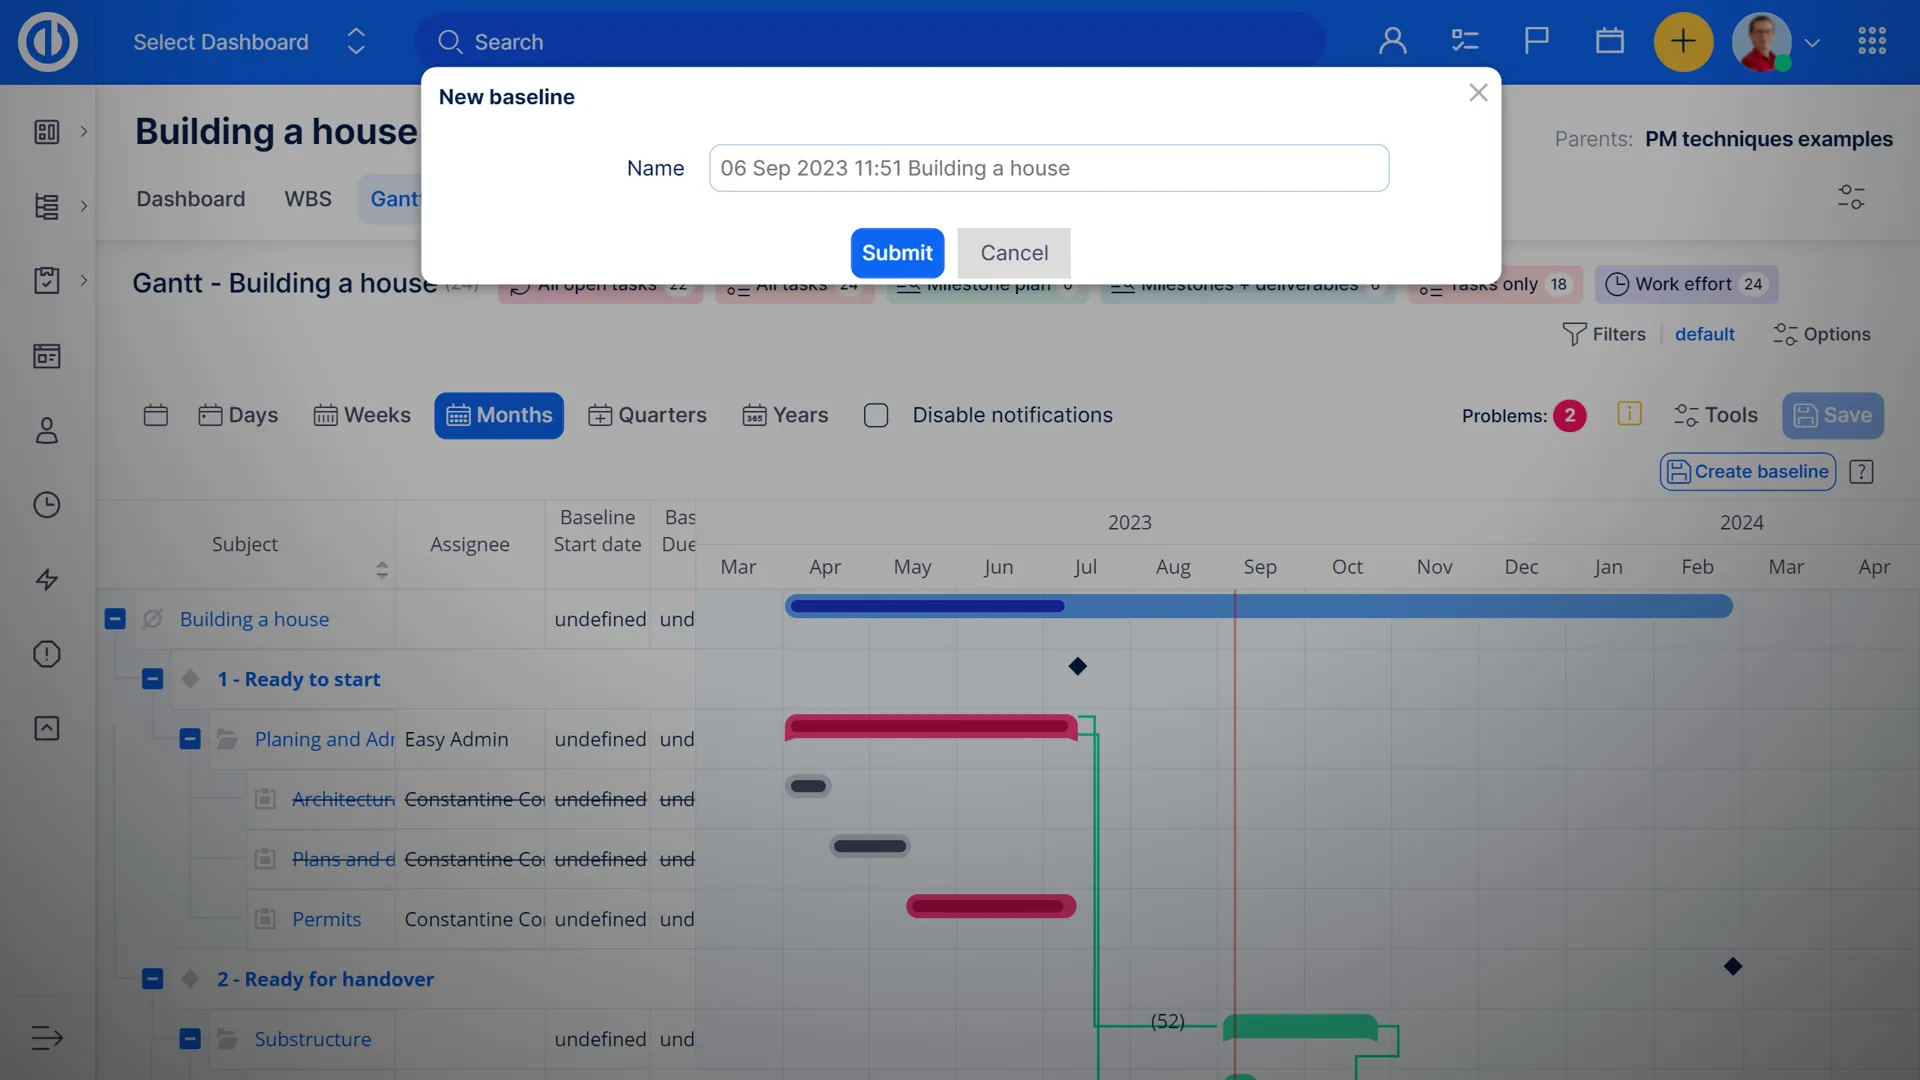
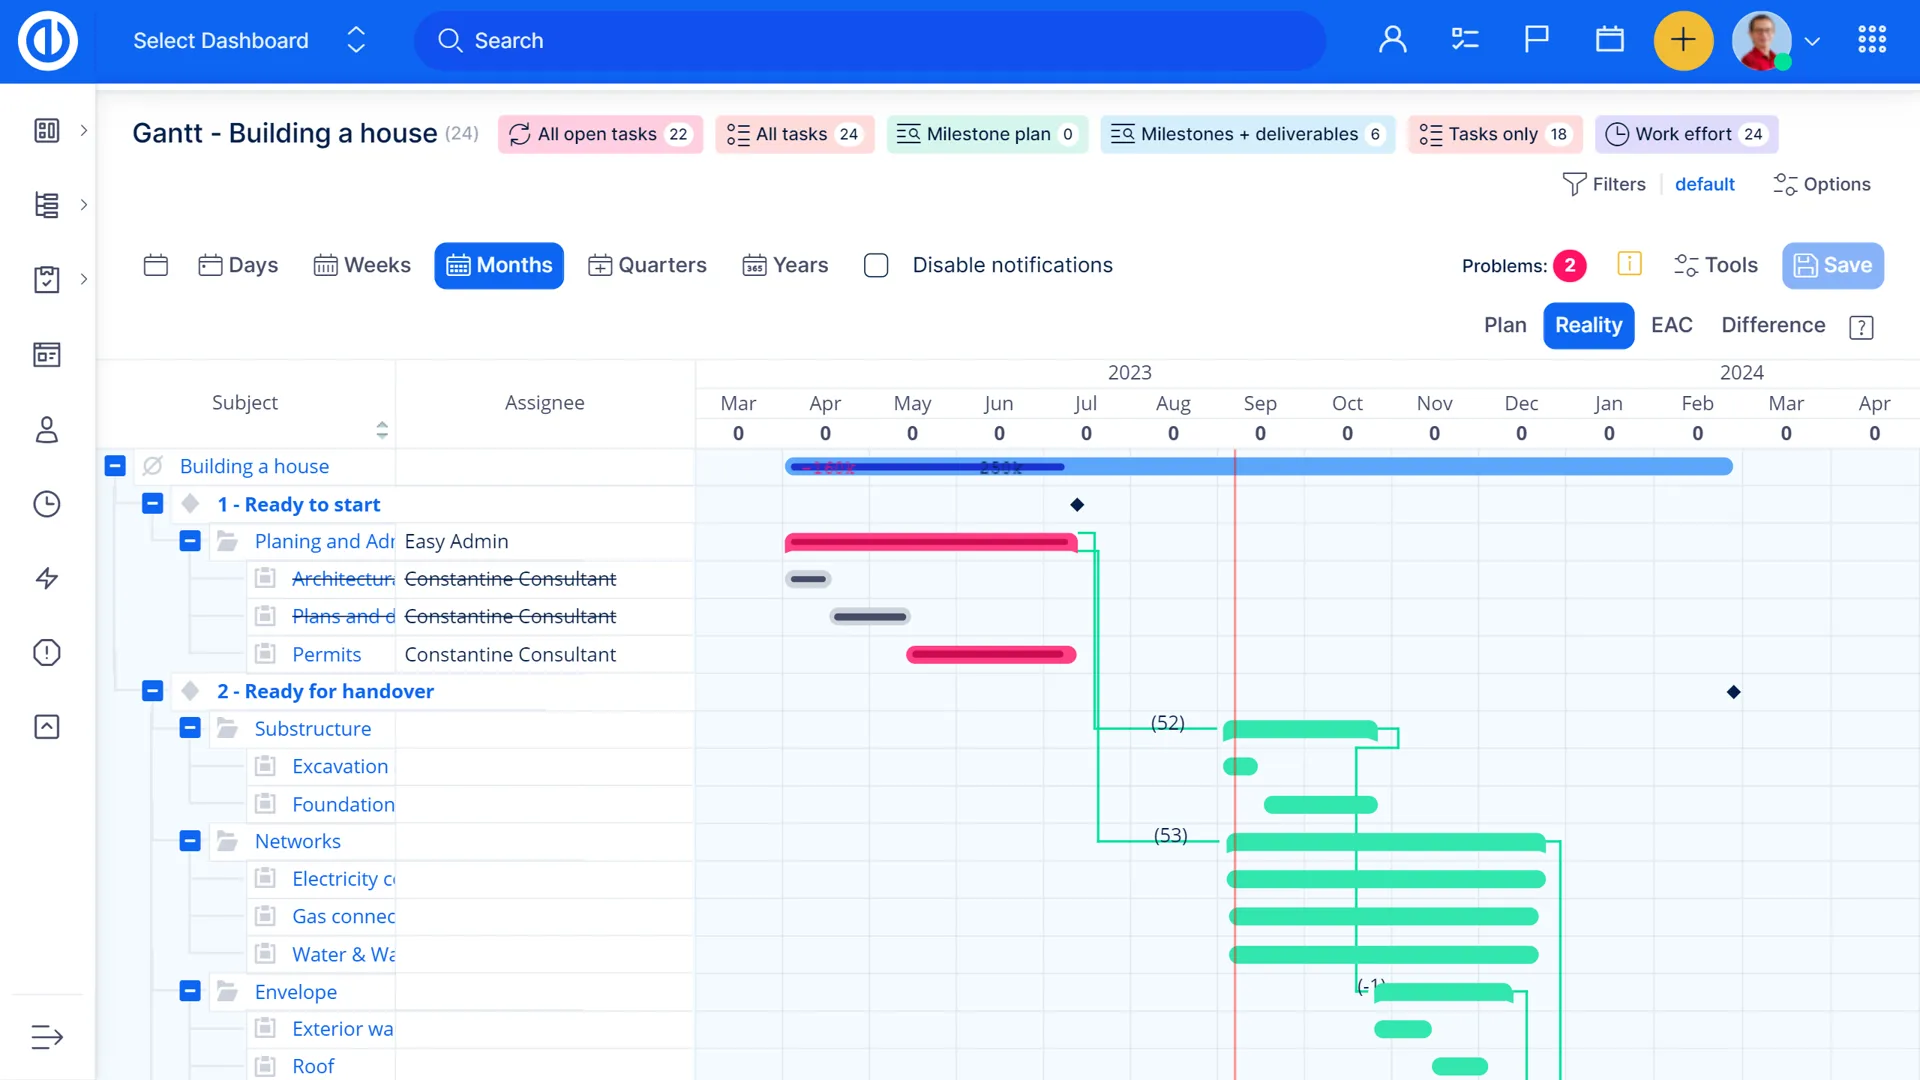
Baselines
Assess project performance by comparing it to the original plan. Baselines provide snapshots of the project plan at different moments, allowing you to easily compare the plan to current performance within your Gantt chart.

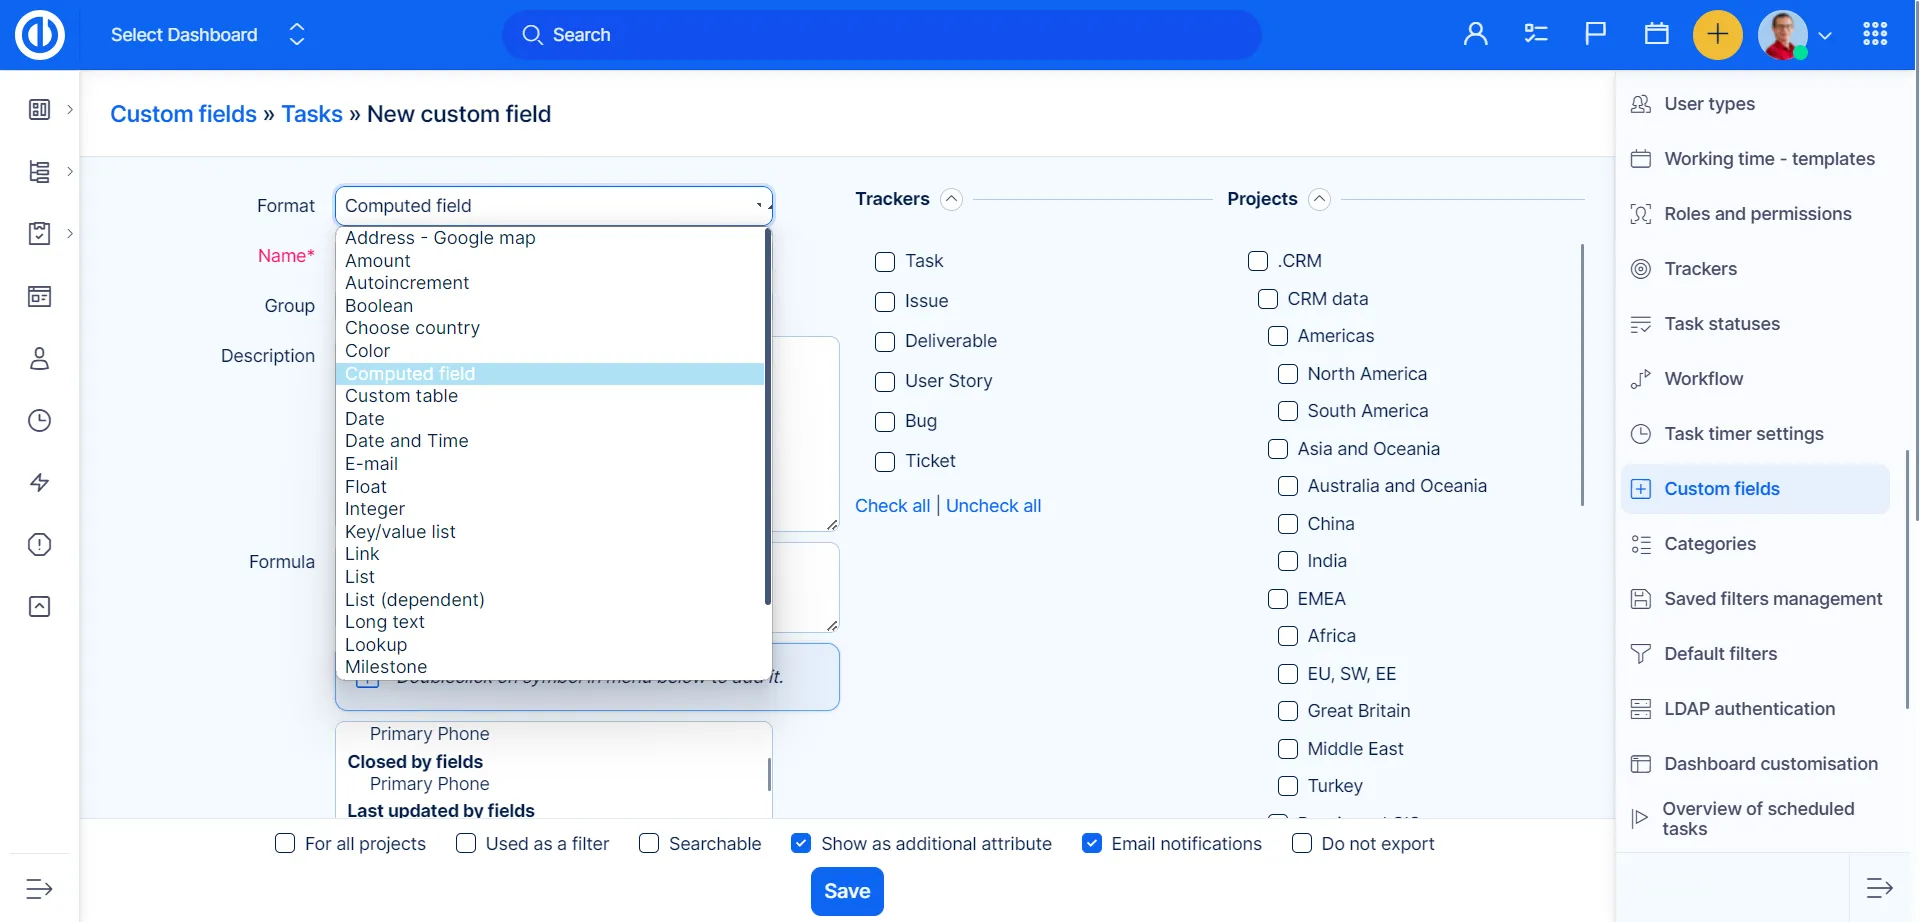
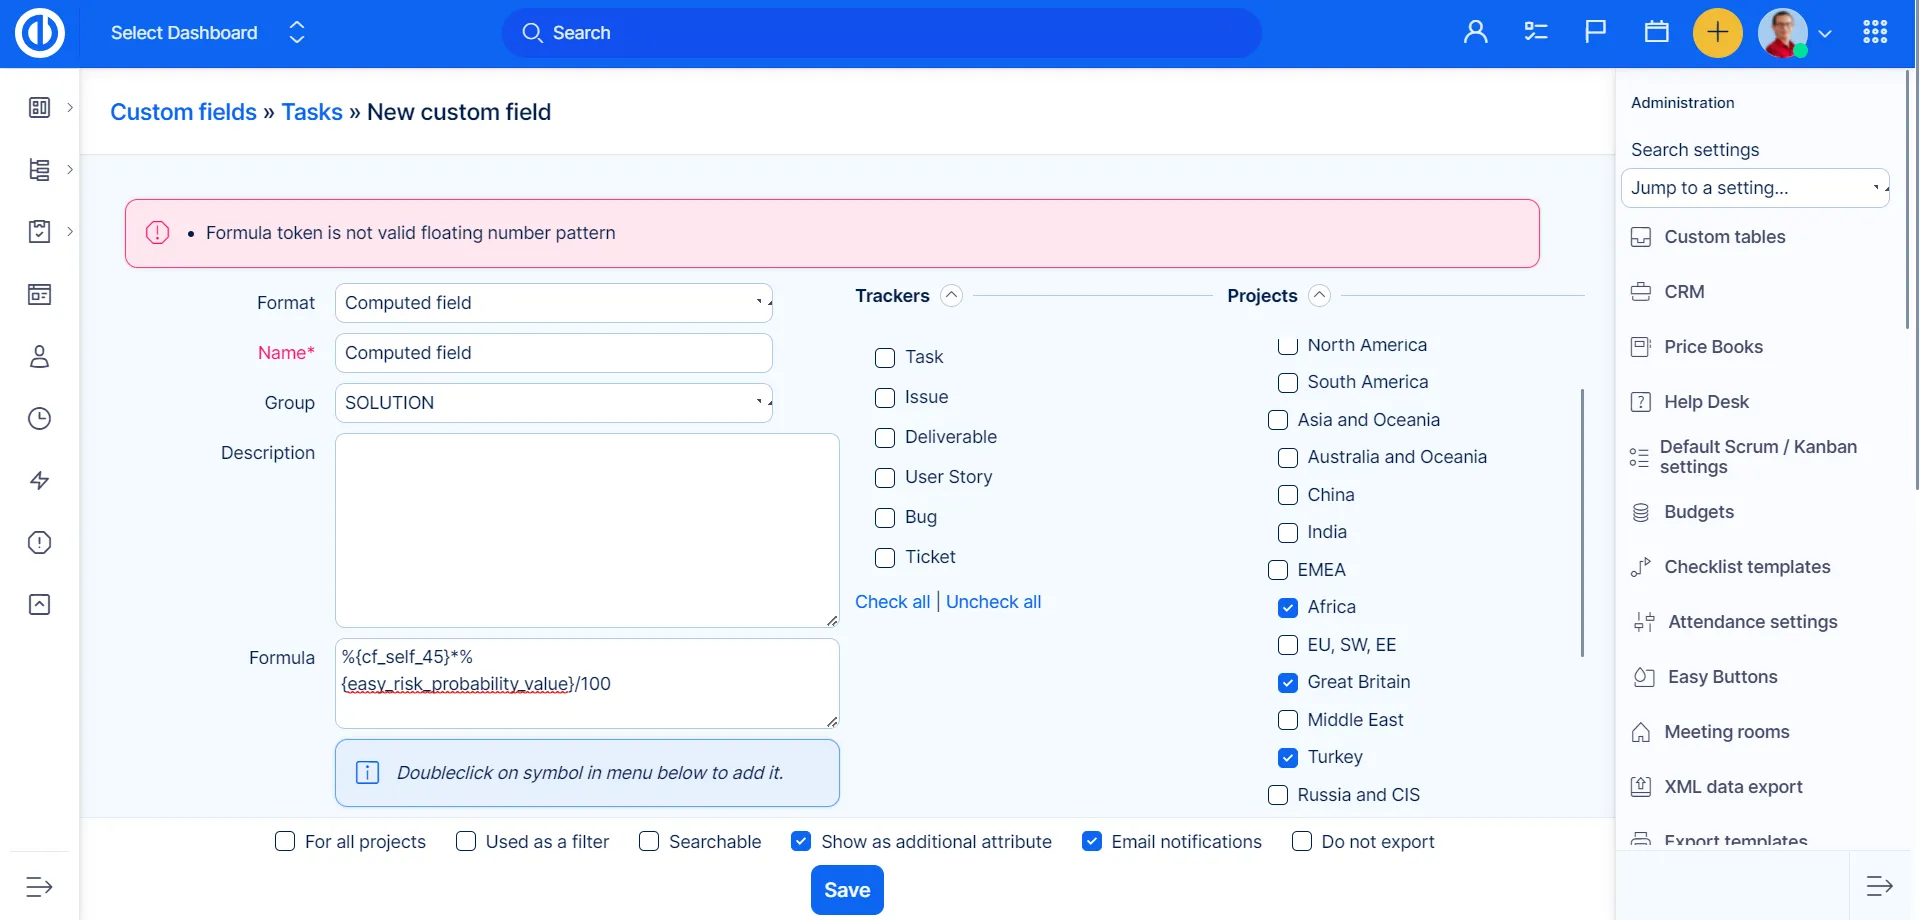
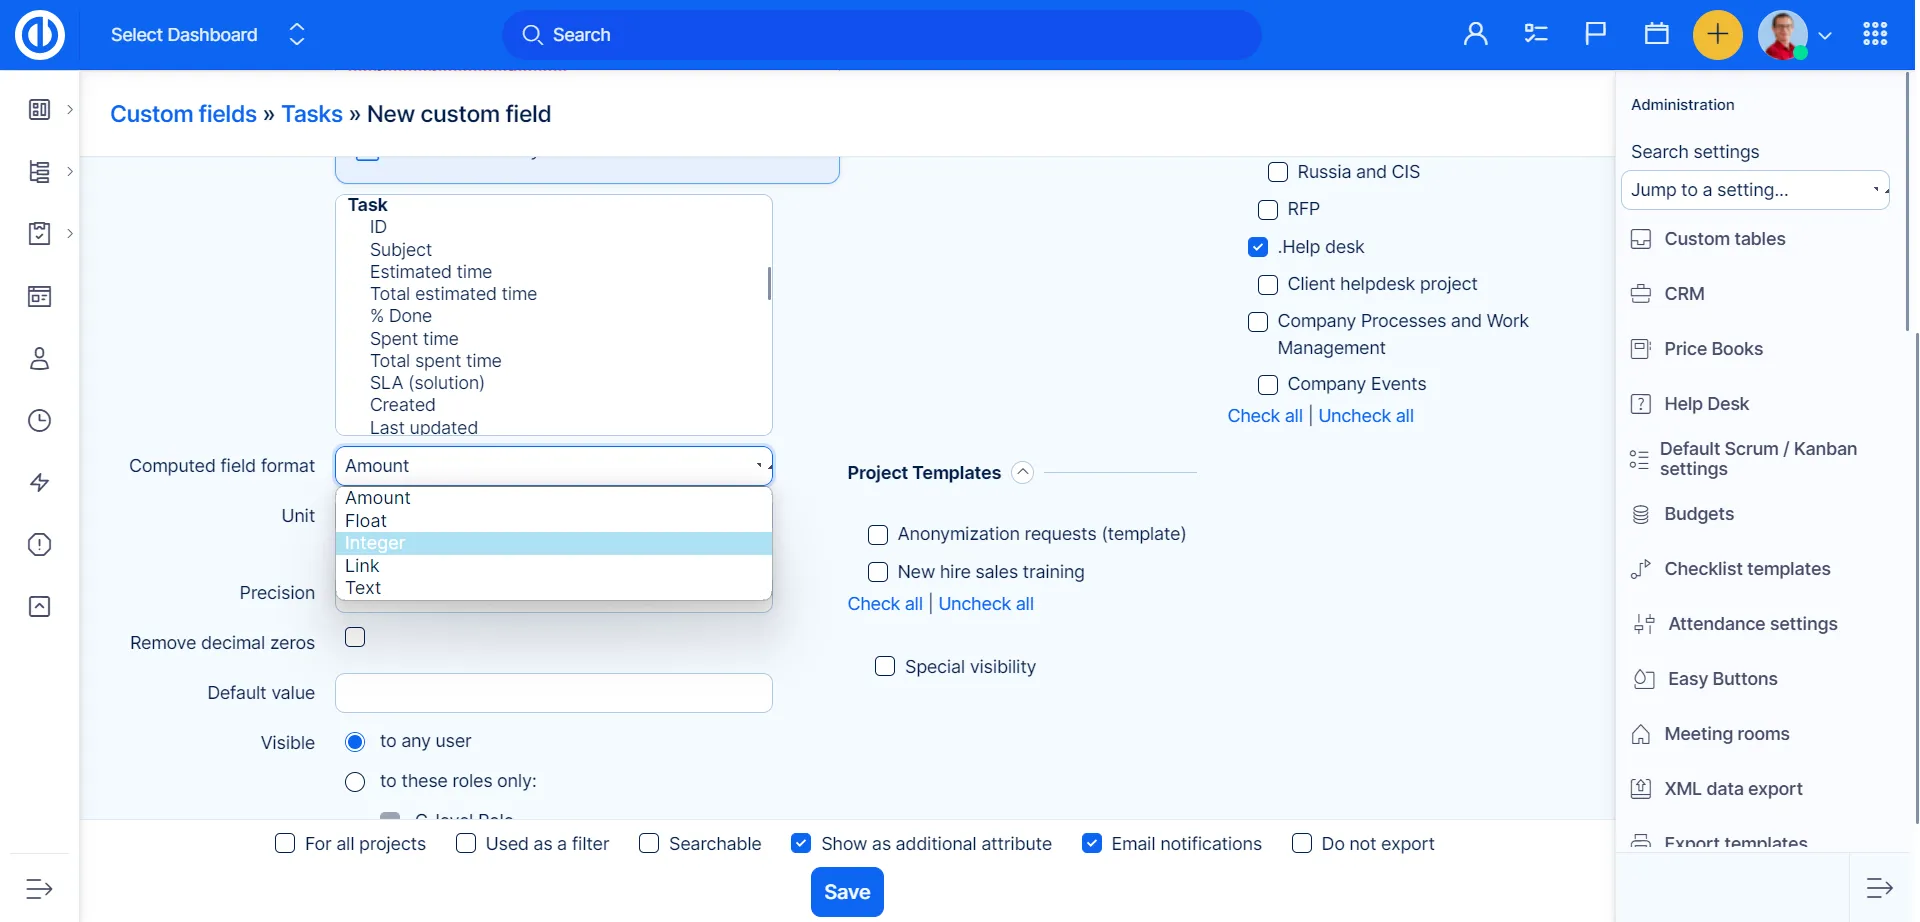
Custom fields
Make Easy Project your own by creating computed fields customized to your personal needs. They can be created on a variety of entities and can appear depending on trackers and attributes.

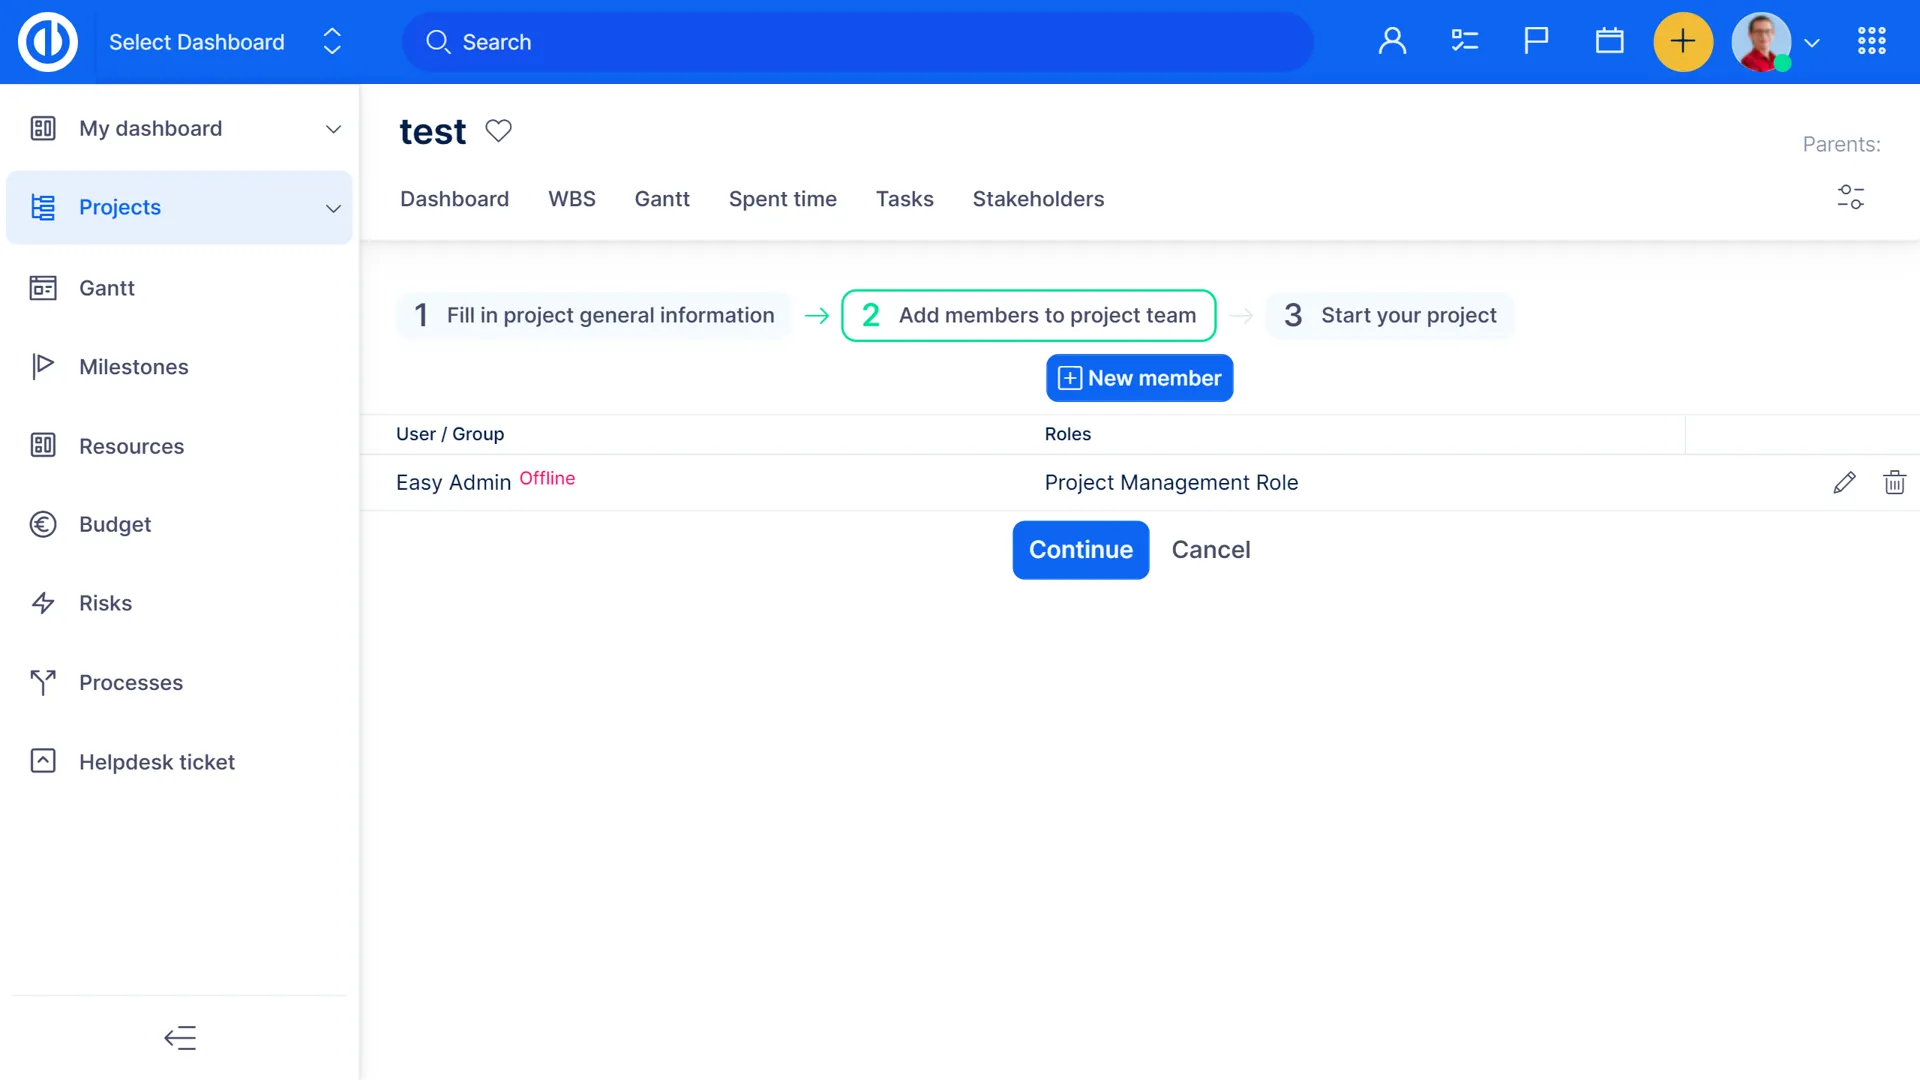
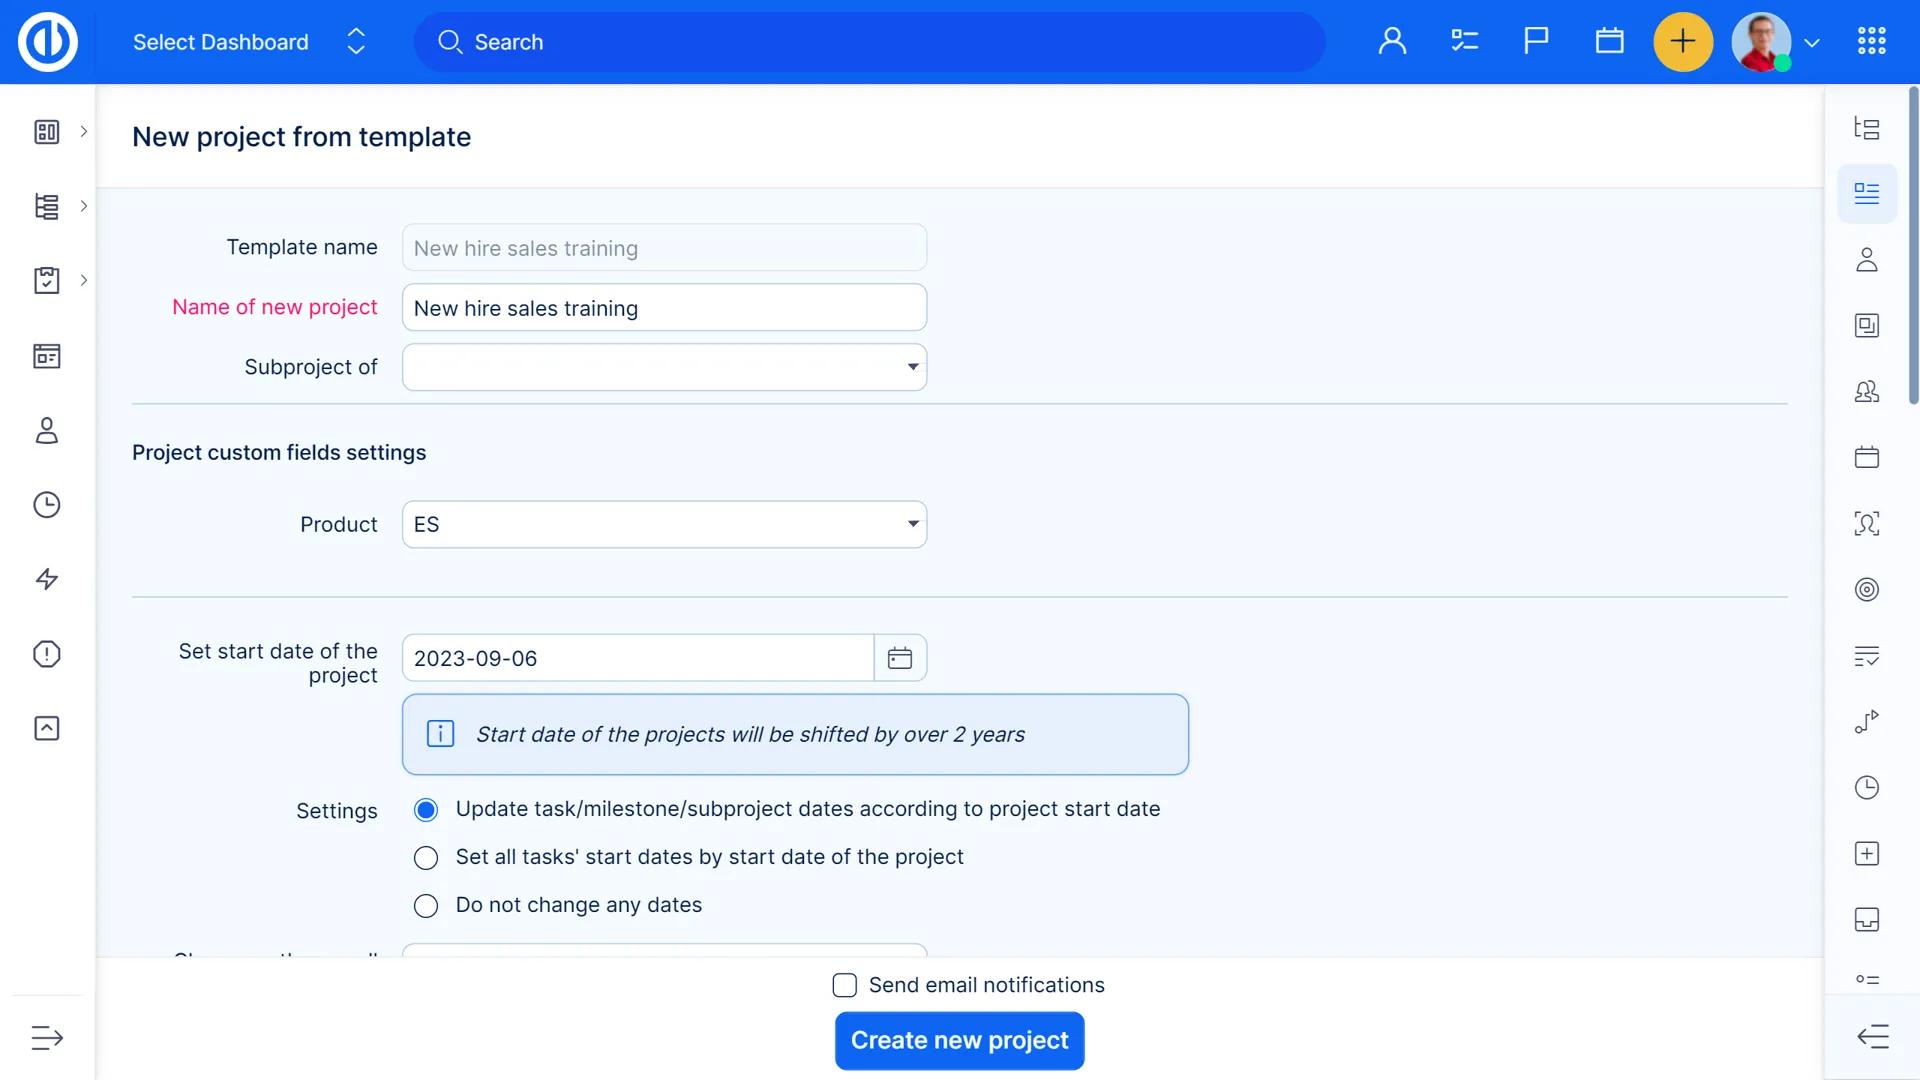
Project templates


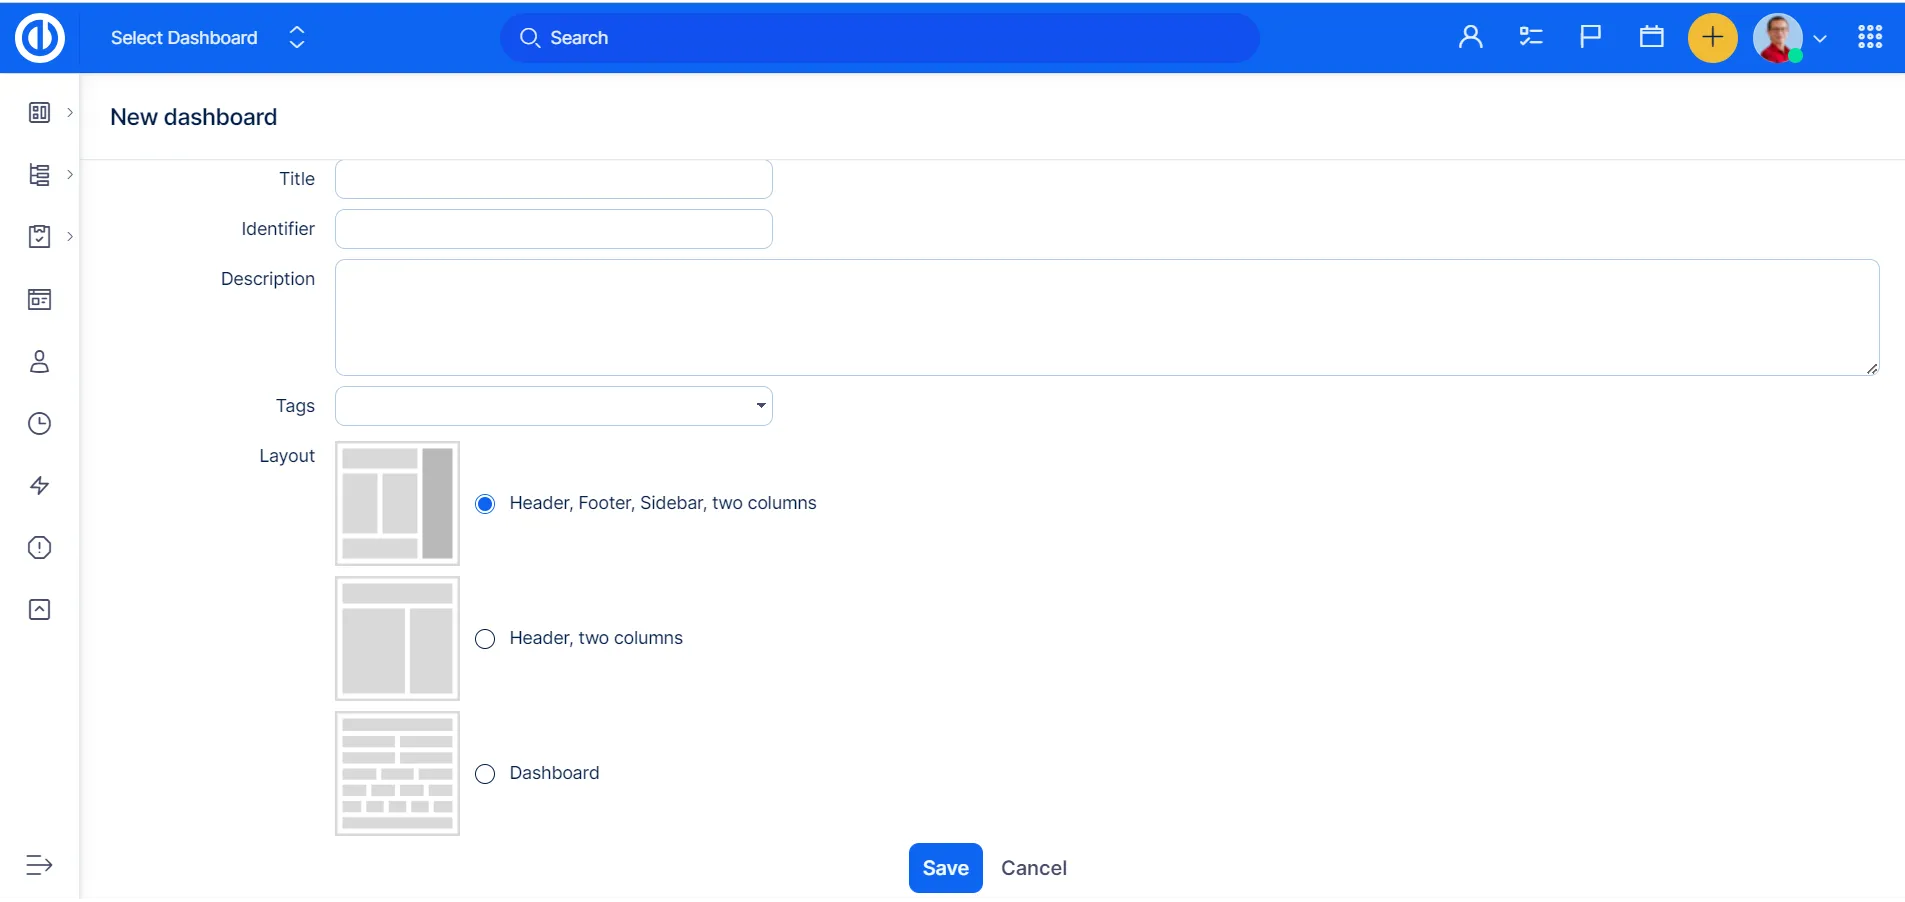
Personal dashboard for all your needs

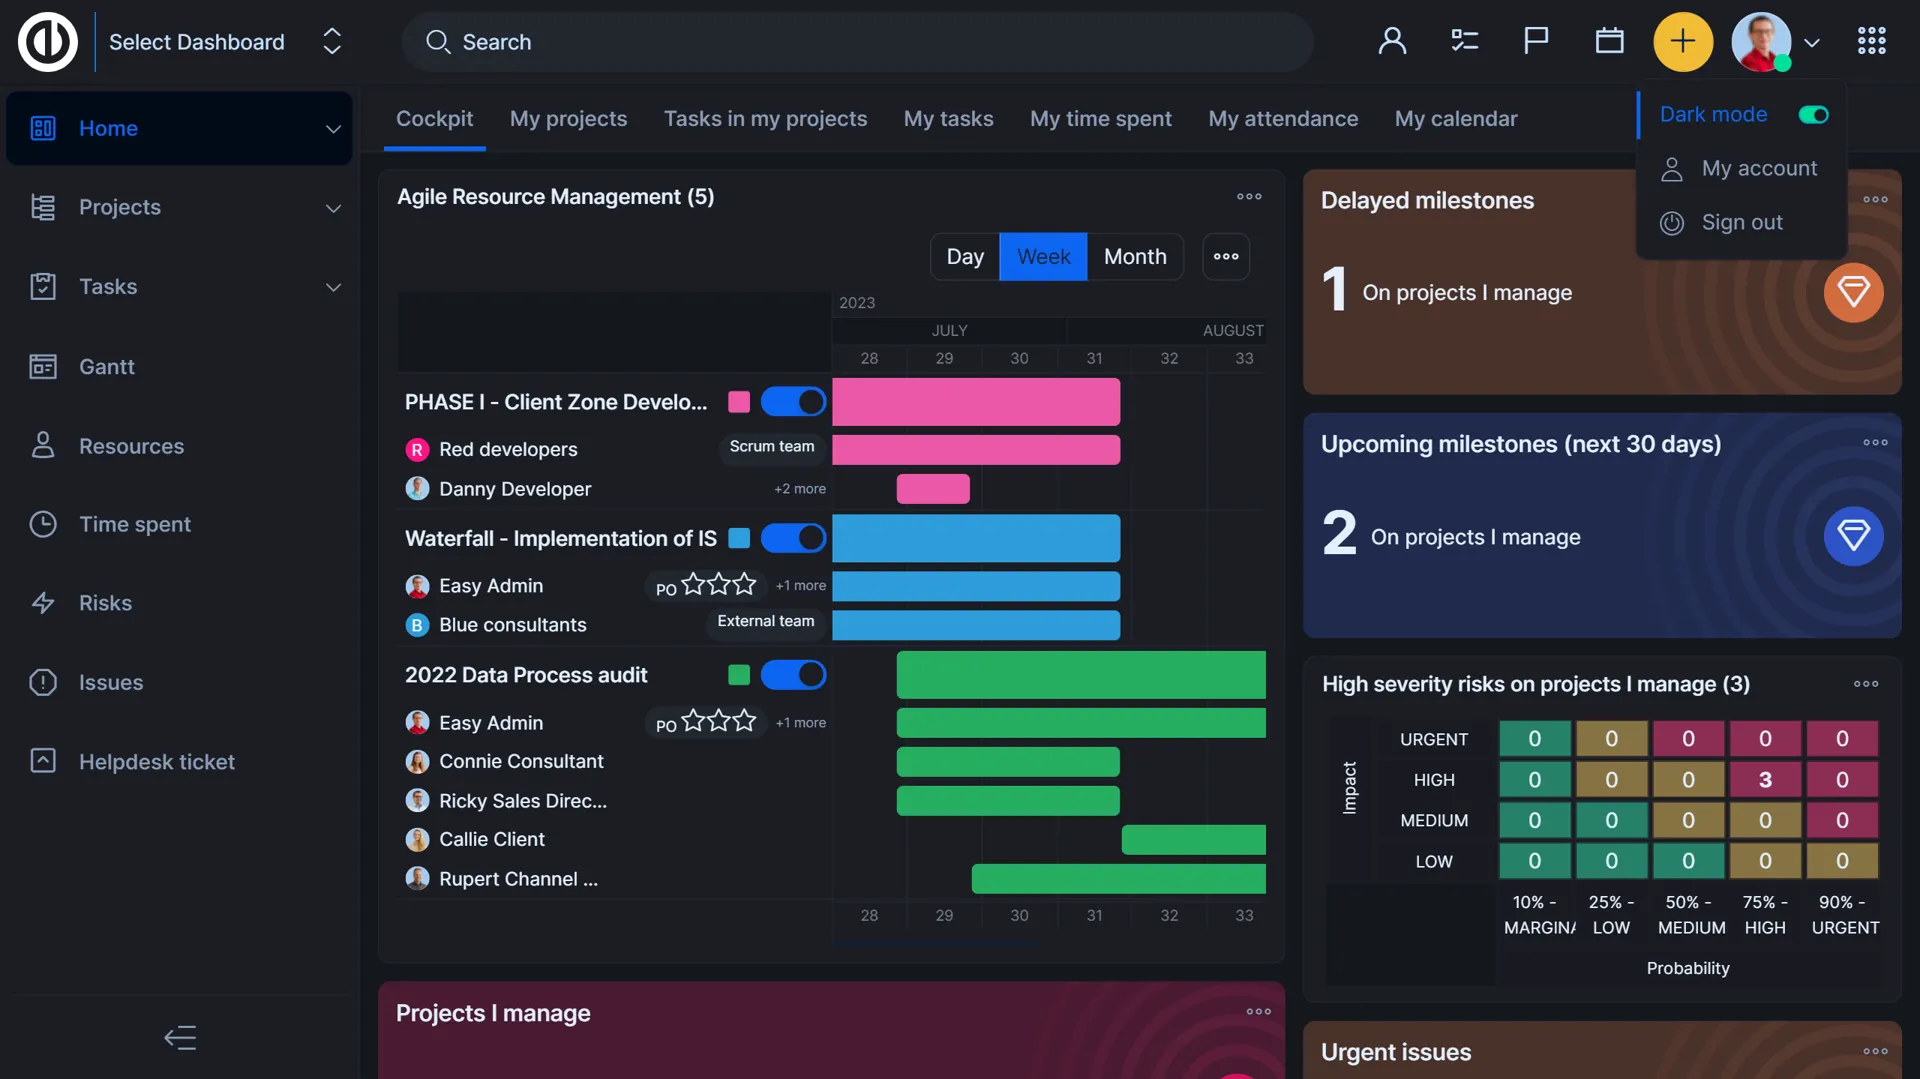
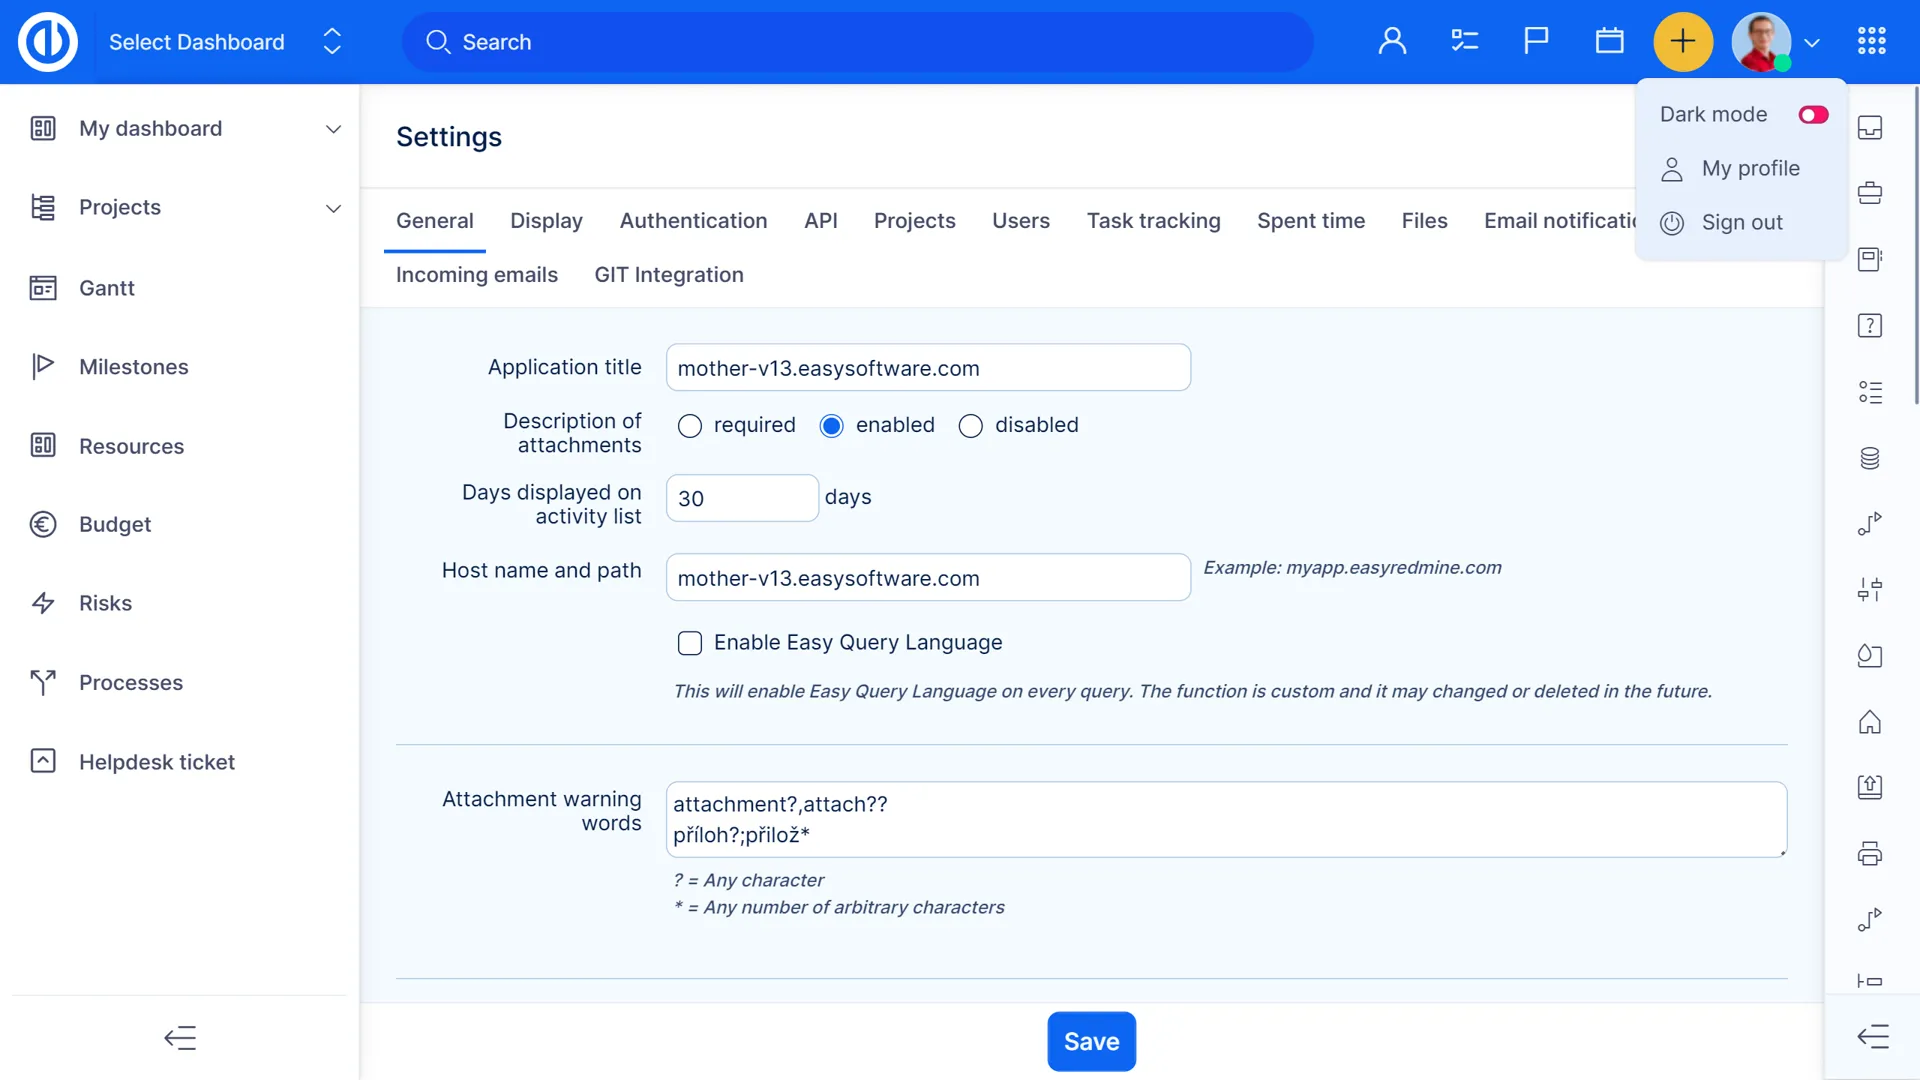
Design themes
Easy Project comes with 3 design themes to meet various users' needs - Default, Compact, and Dark. Every user can switch between the themes on his user's profile.

Accessibility
Easy Project is designed to be accessible to everyone, featuring embedded labels for screen readers and comprehensive keyboard operability for seamless navigation. For users with color blindness or visual difficulties, we offer a high-contrast mode.
We are currently working towards an accessibility certification.

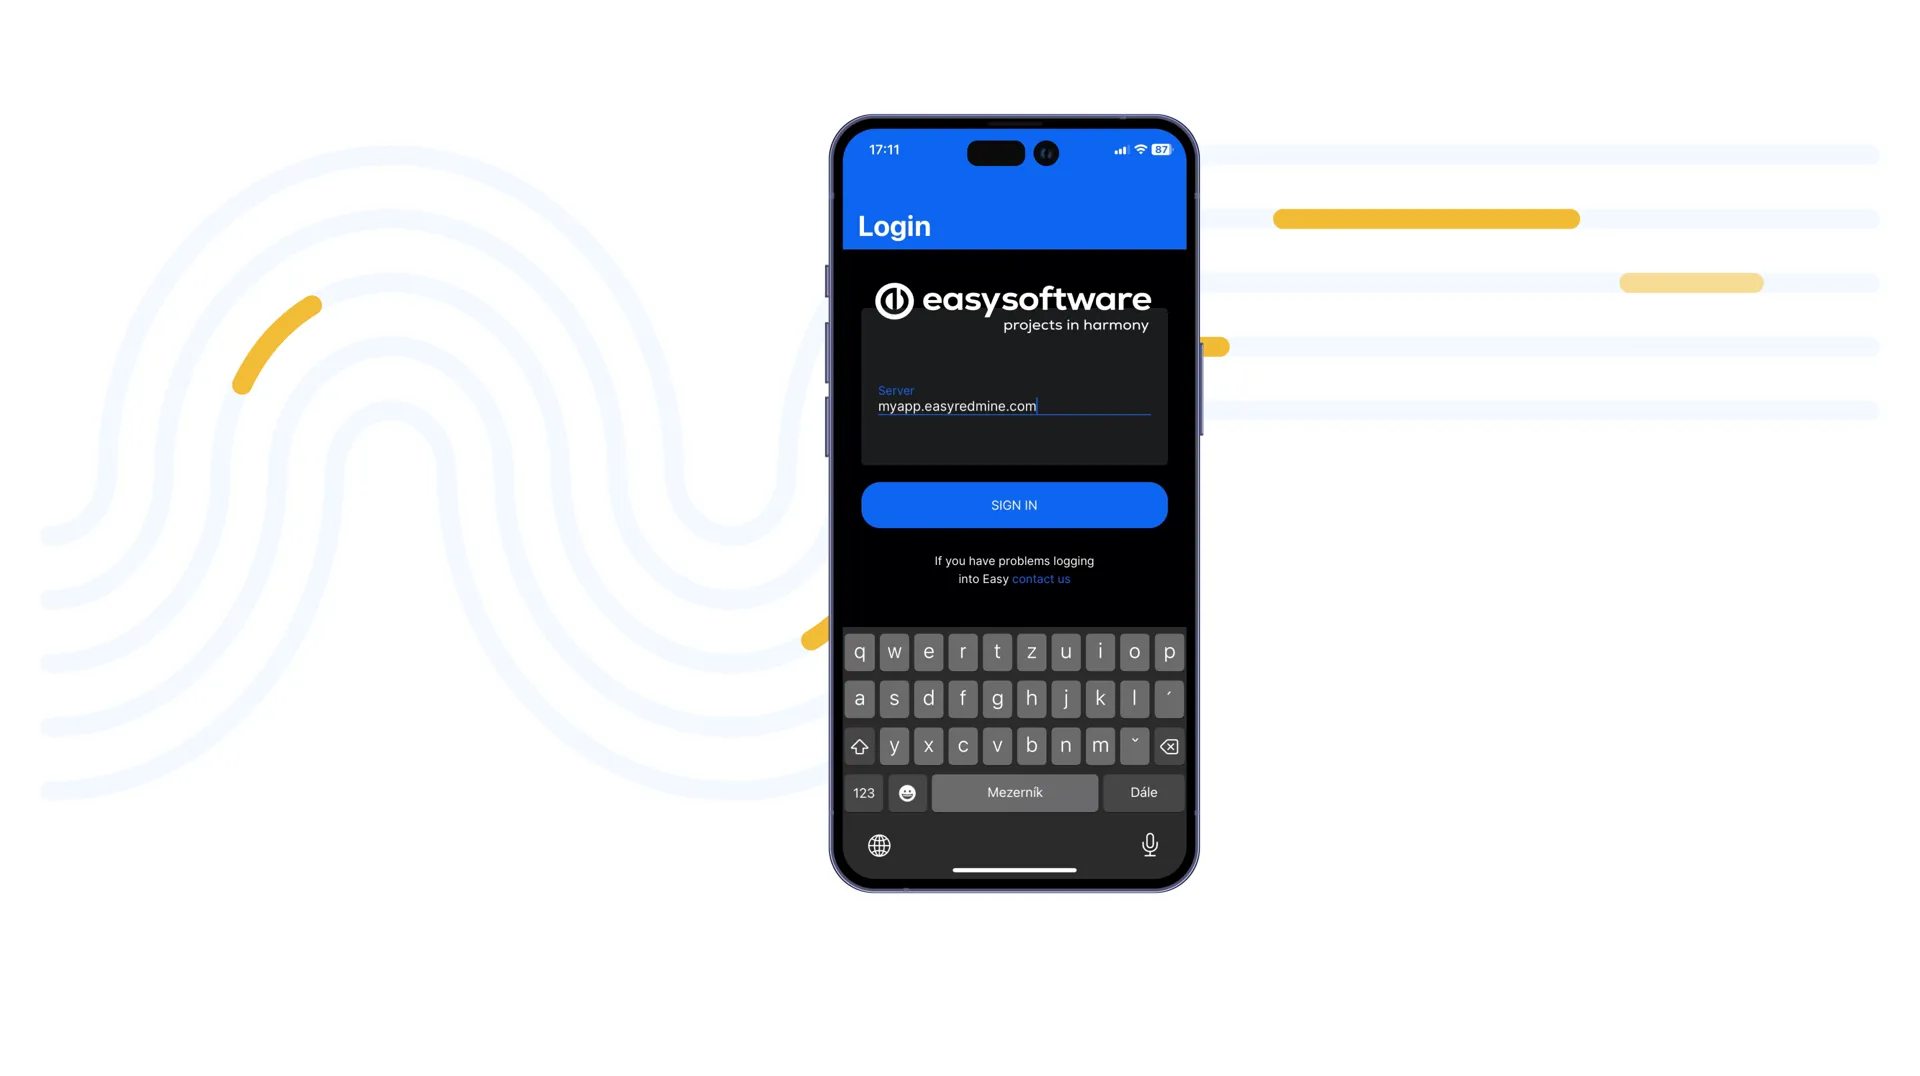
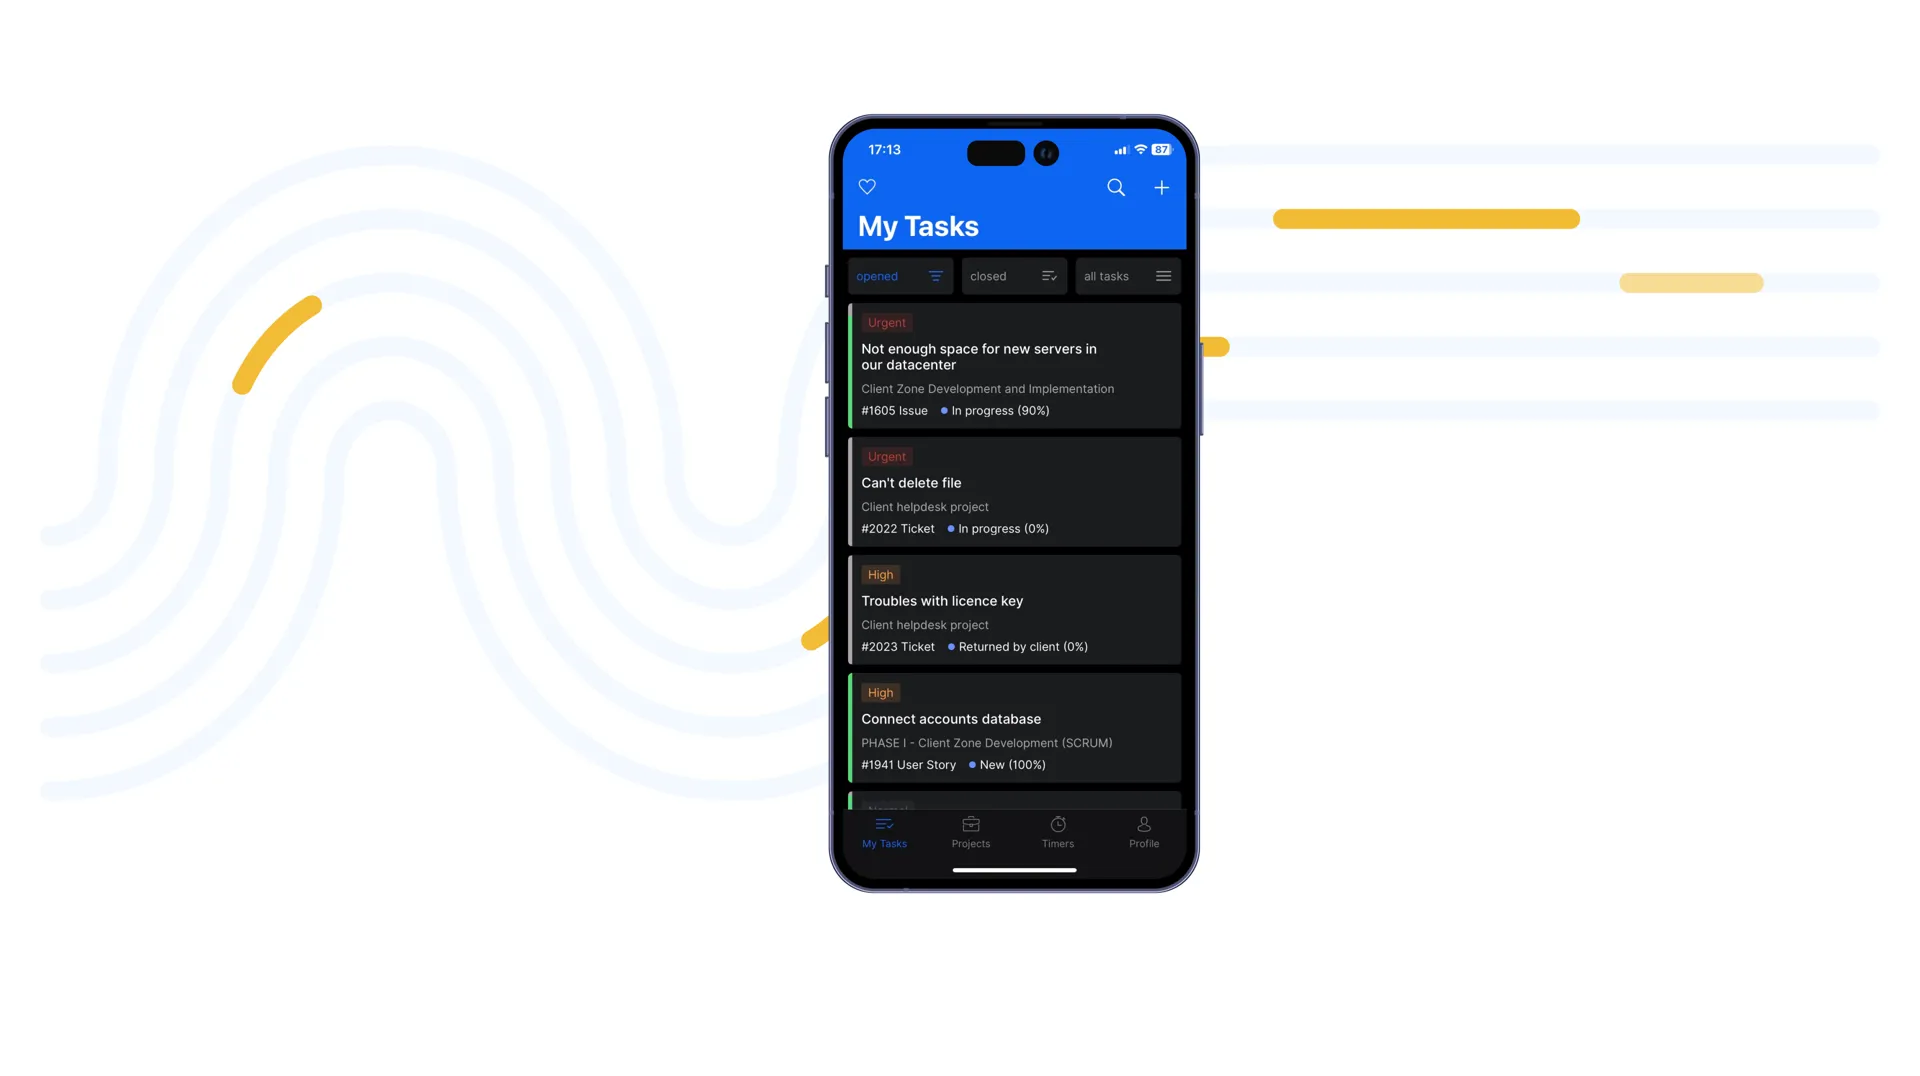
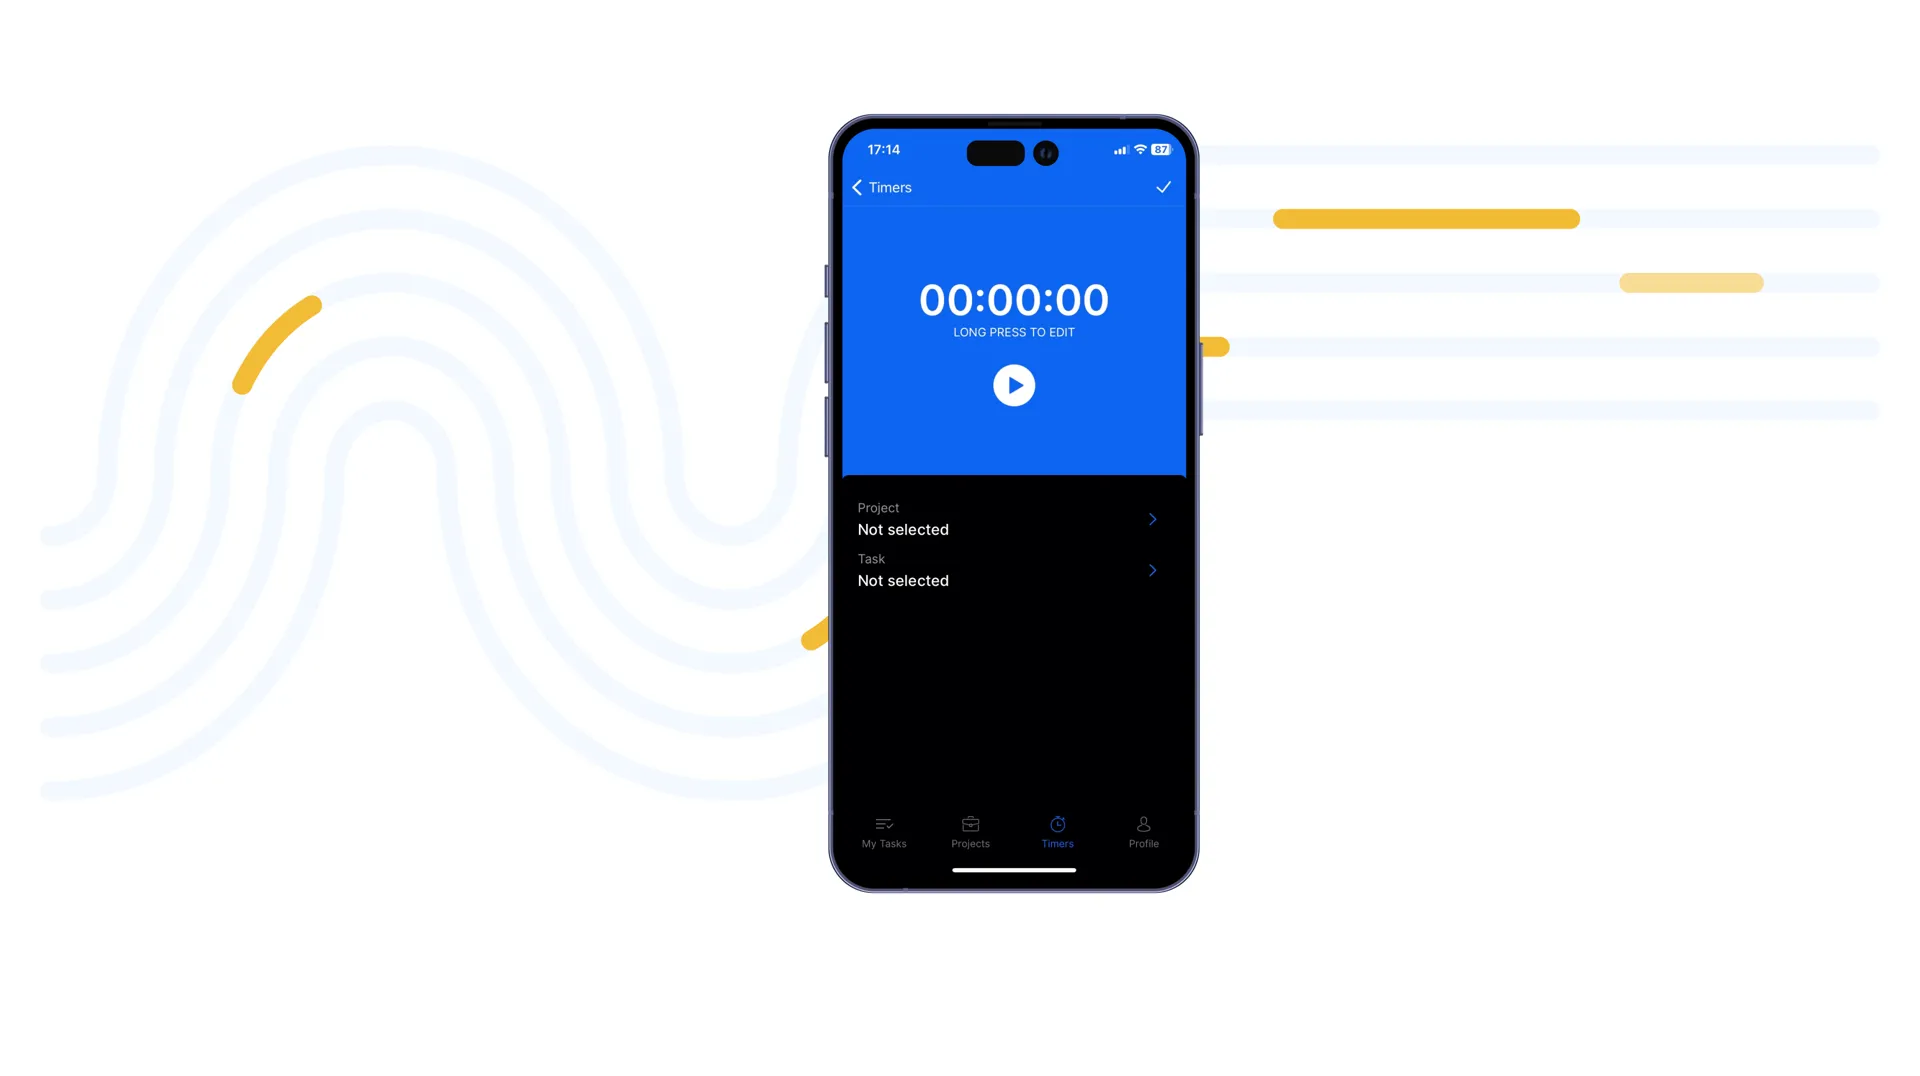
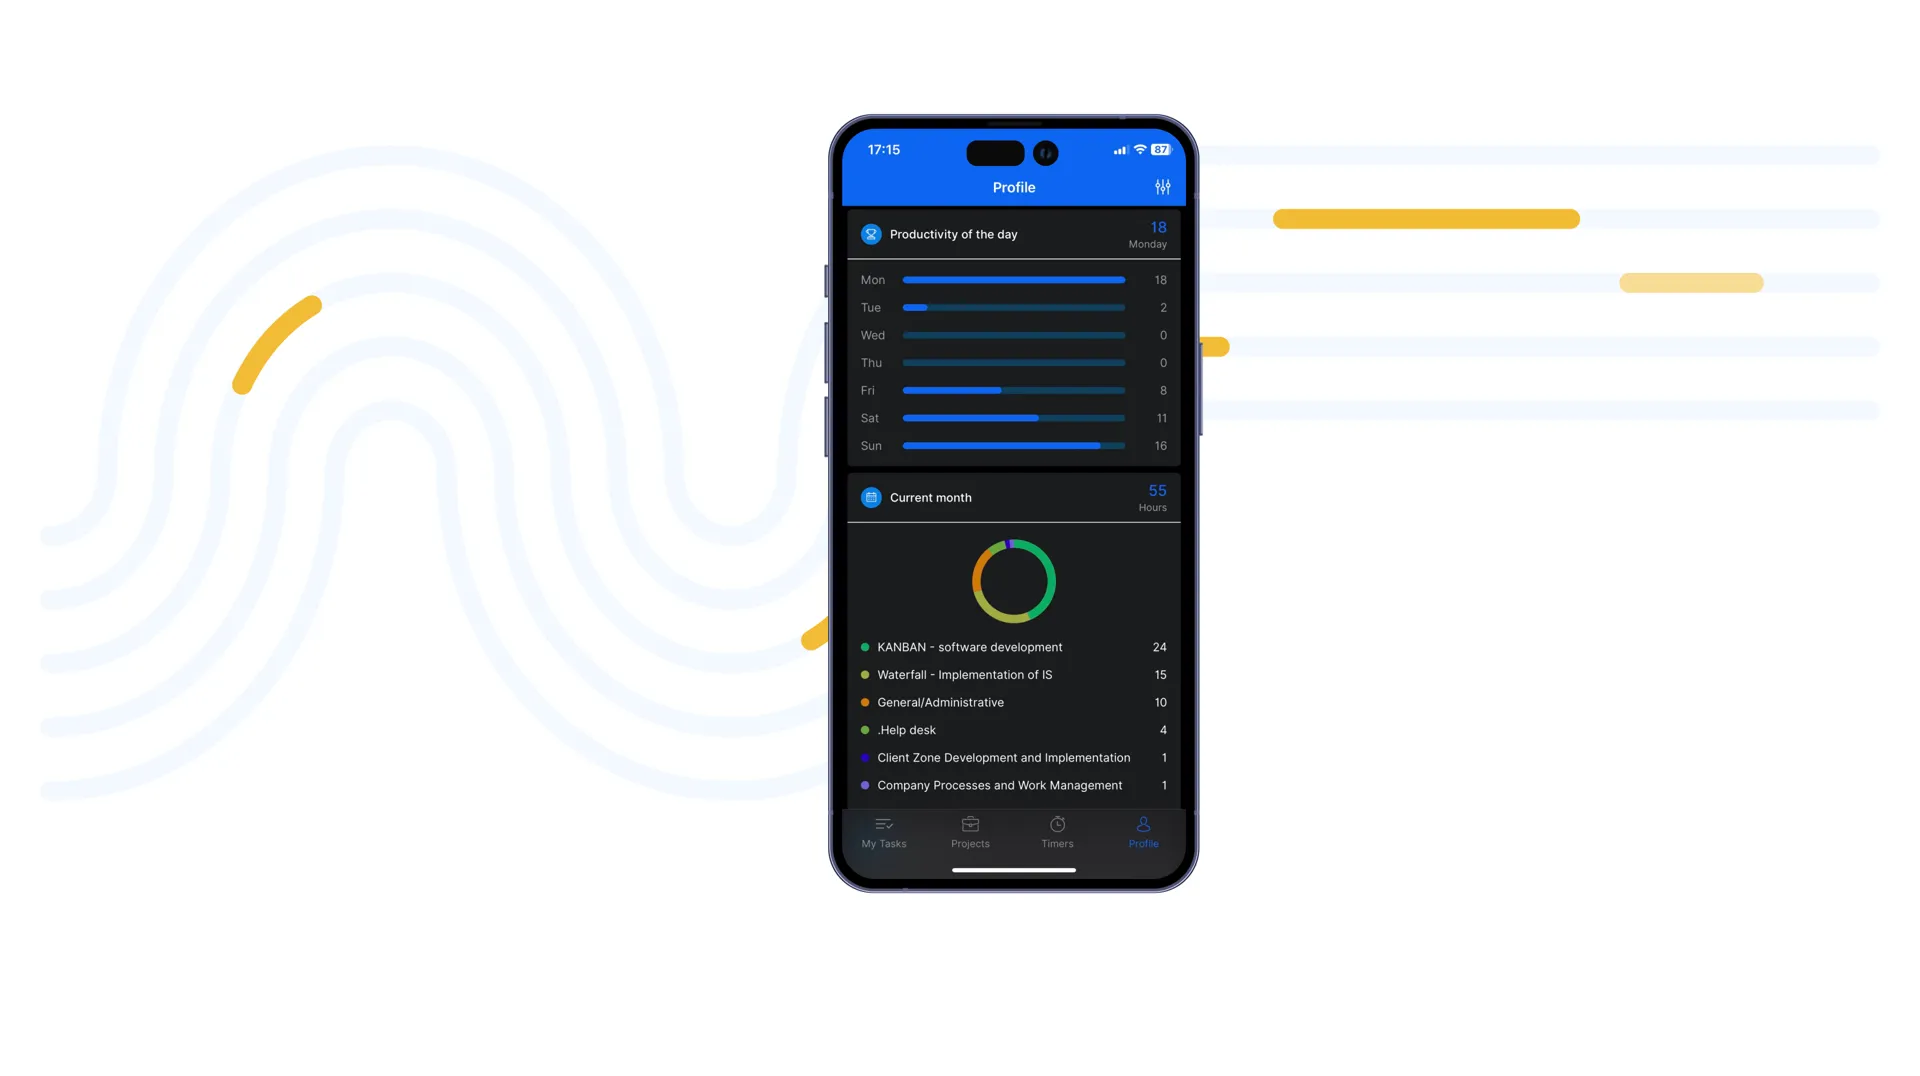
Mobile project management
With the Easy Project mobile app, you have all your projects under control no matter where you are. You can easily create new tasks on the go as you get fresh ideas, post quick comments to keep things moving, manage your tasks, or track time to individual tasks and projects.
Note: For the full functionality of the mobile app, we recommend using the mobile browser to log in to Easy Project, where you will have access to all the features and functions available.
Work Management

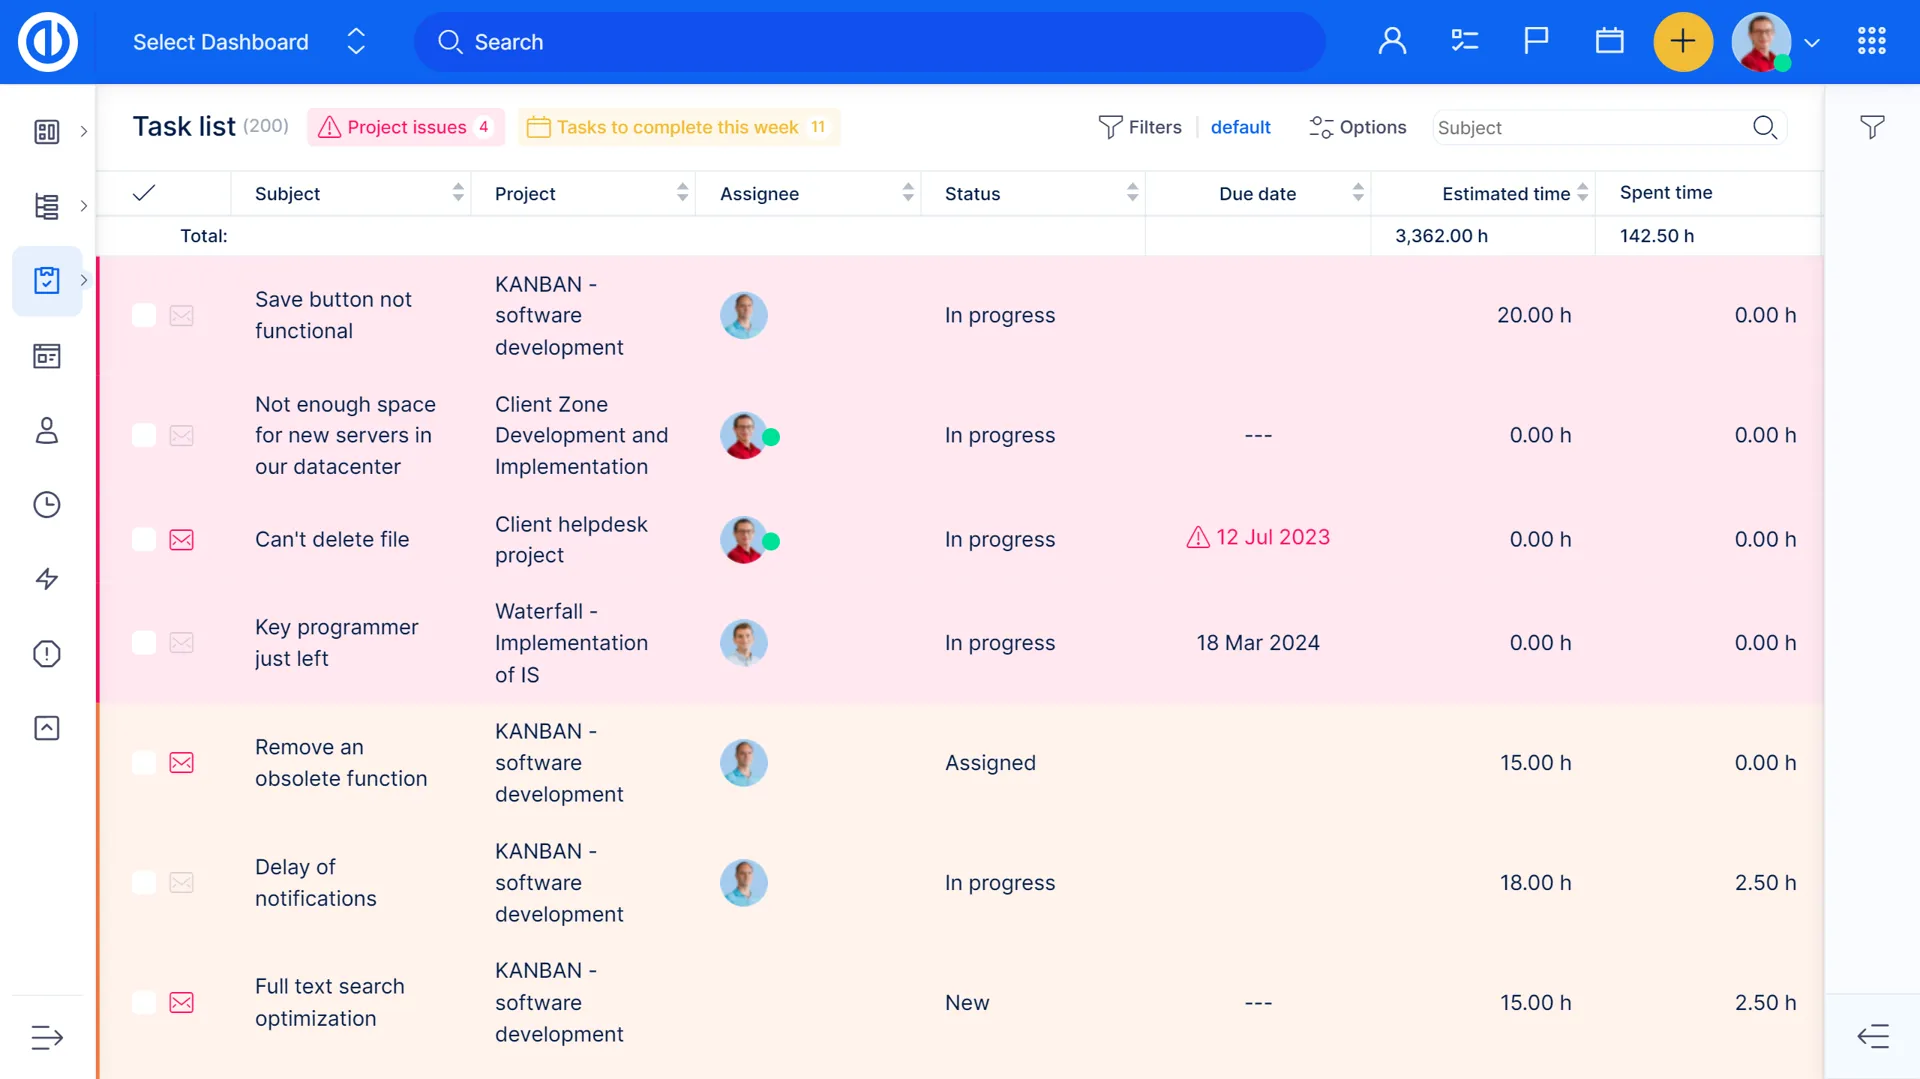
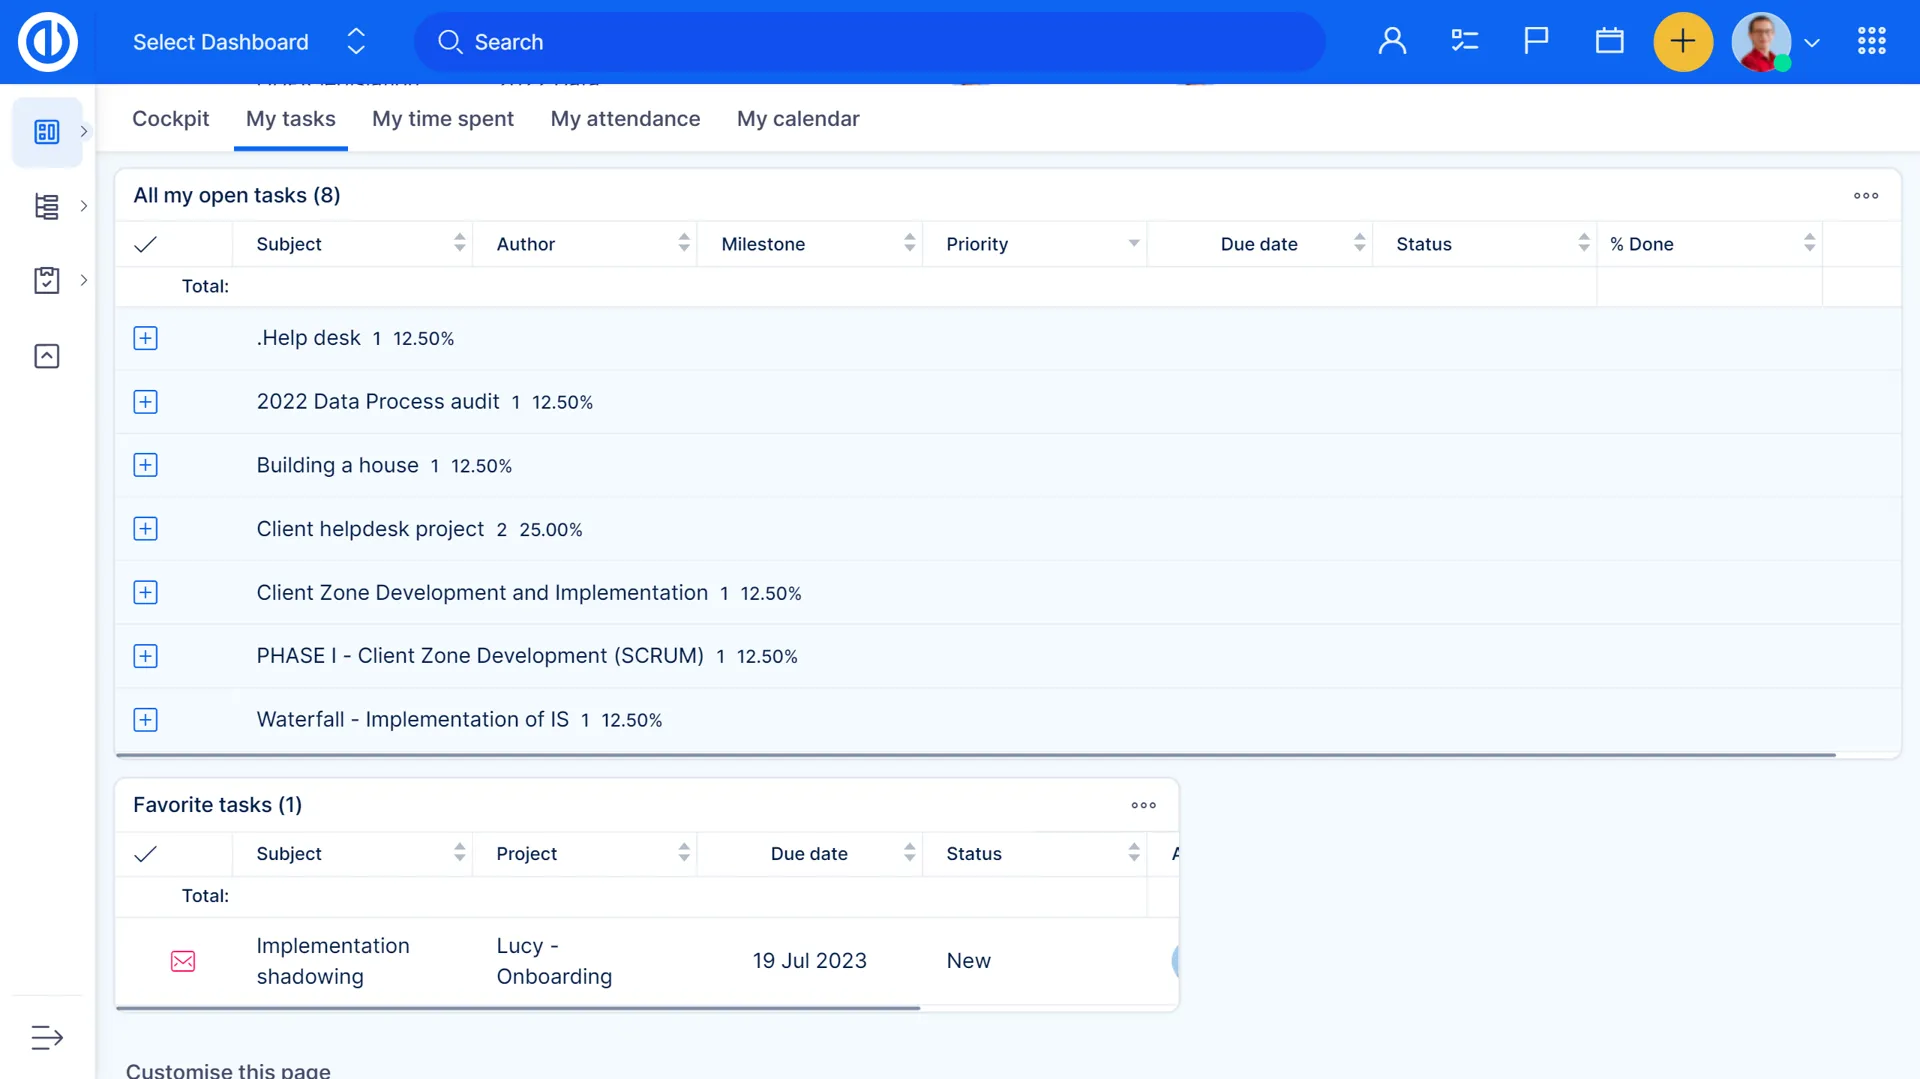
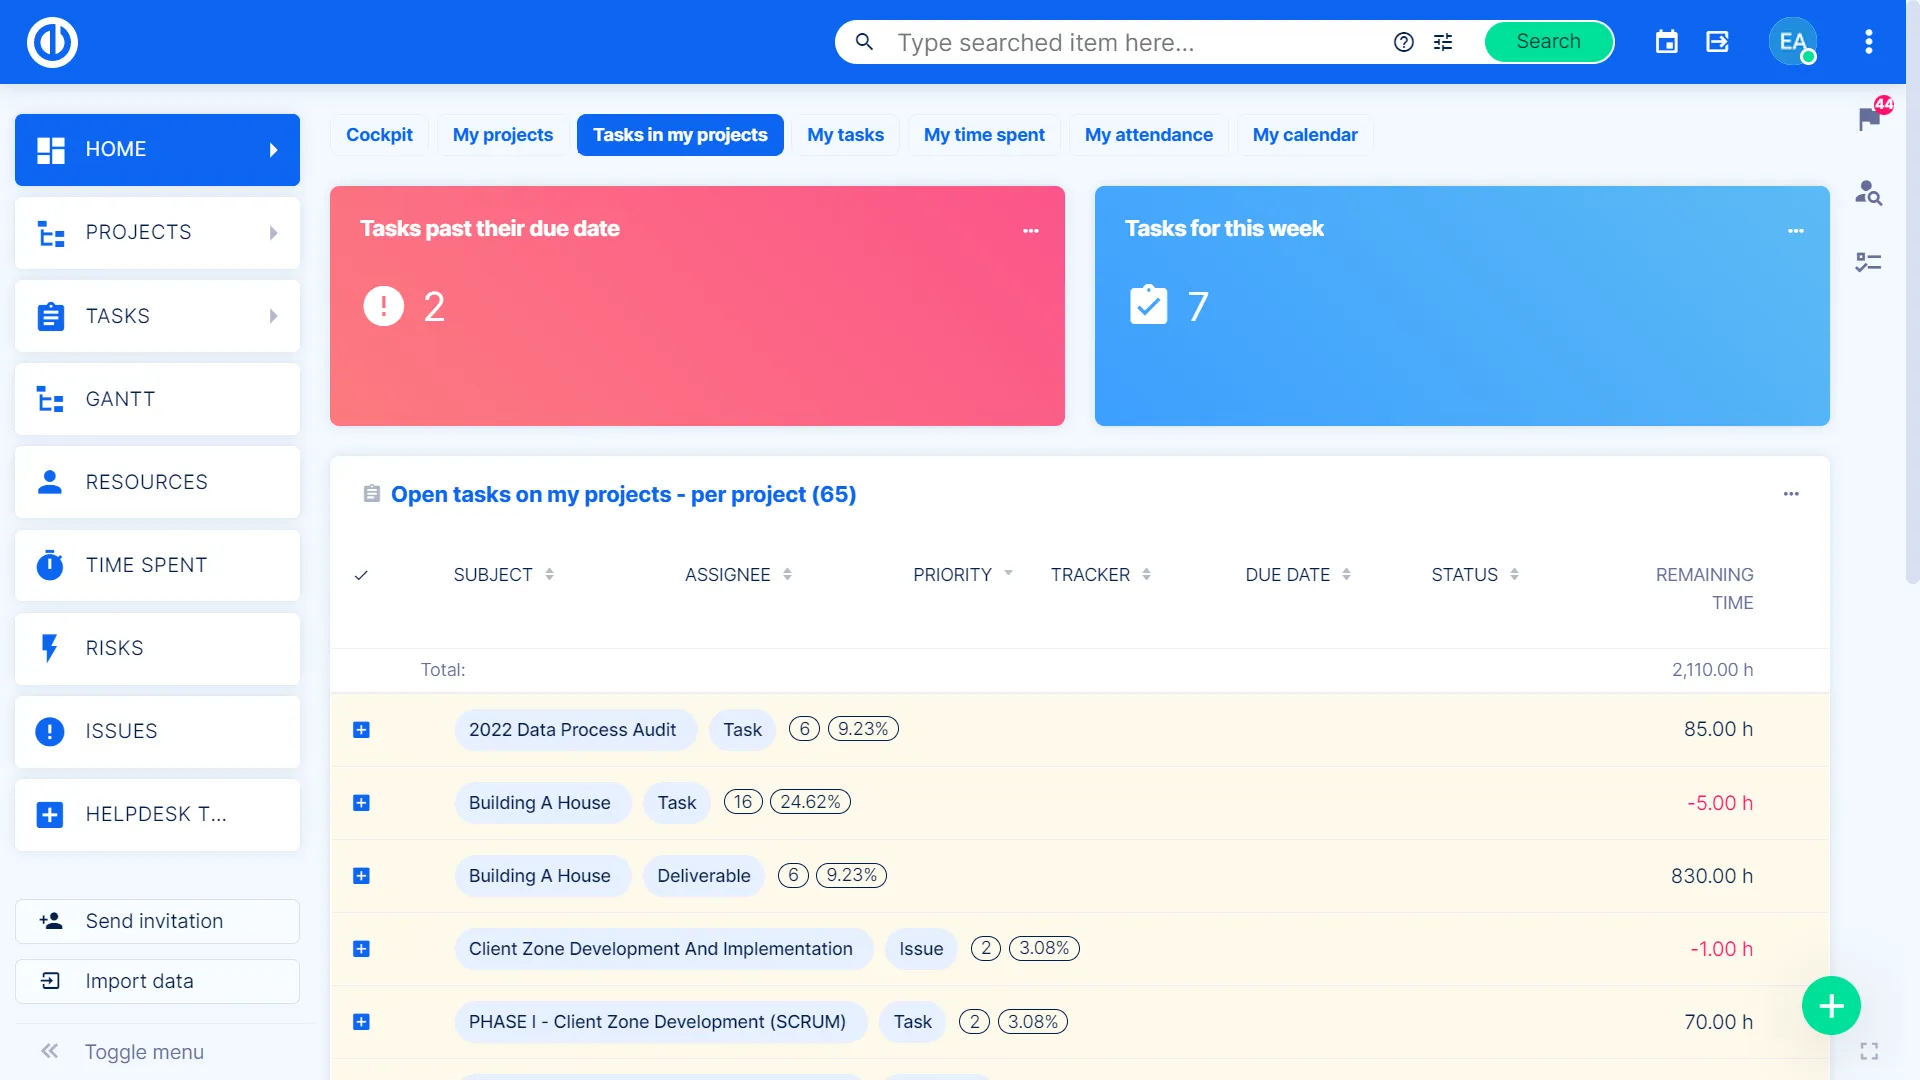
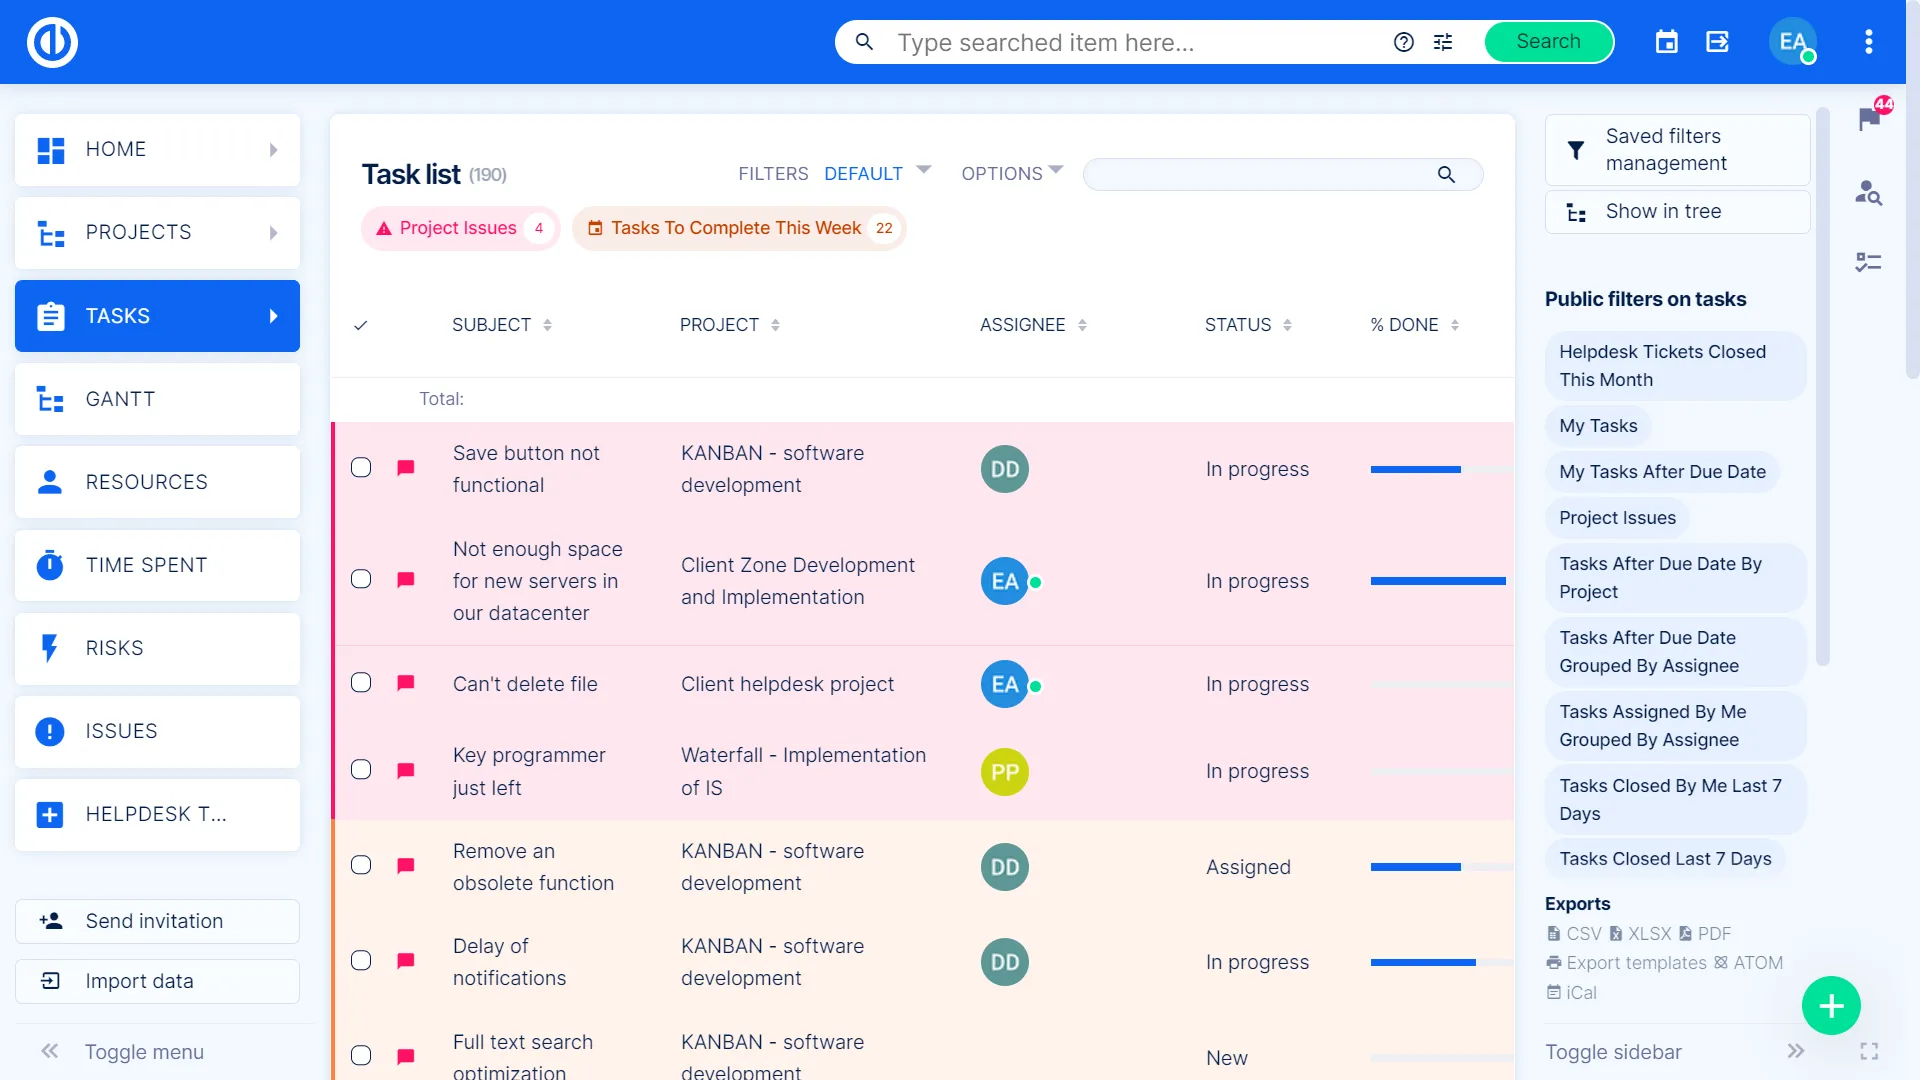
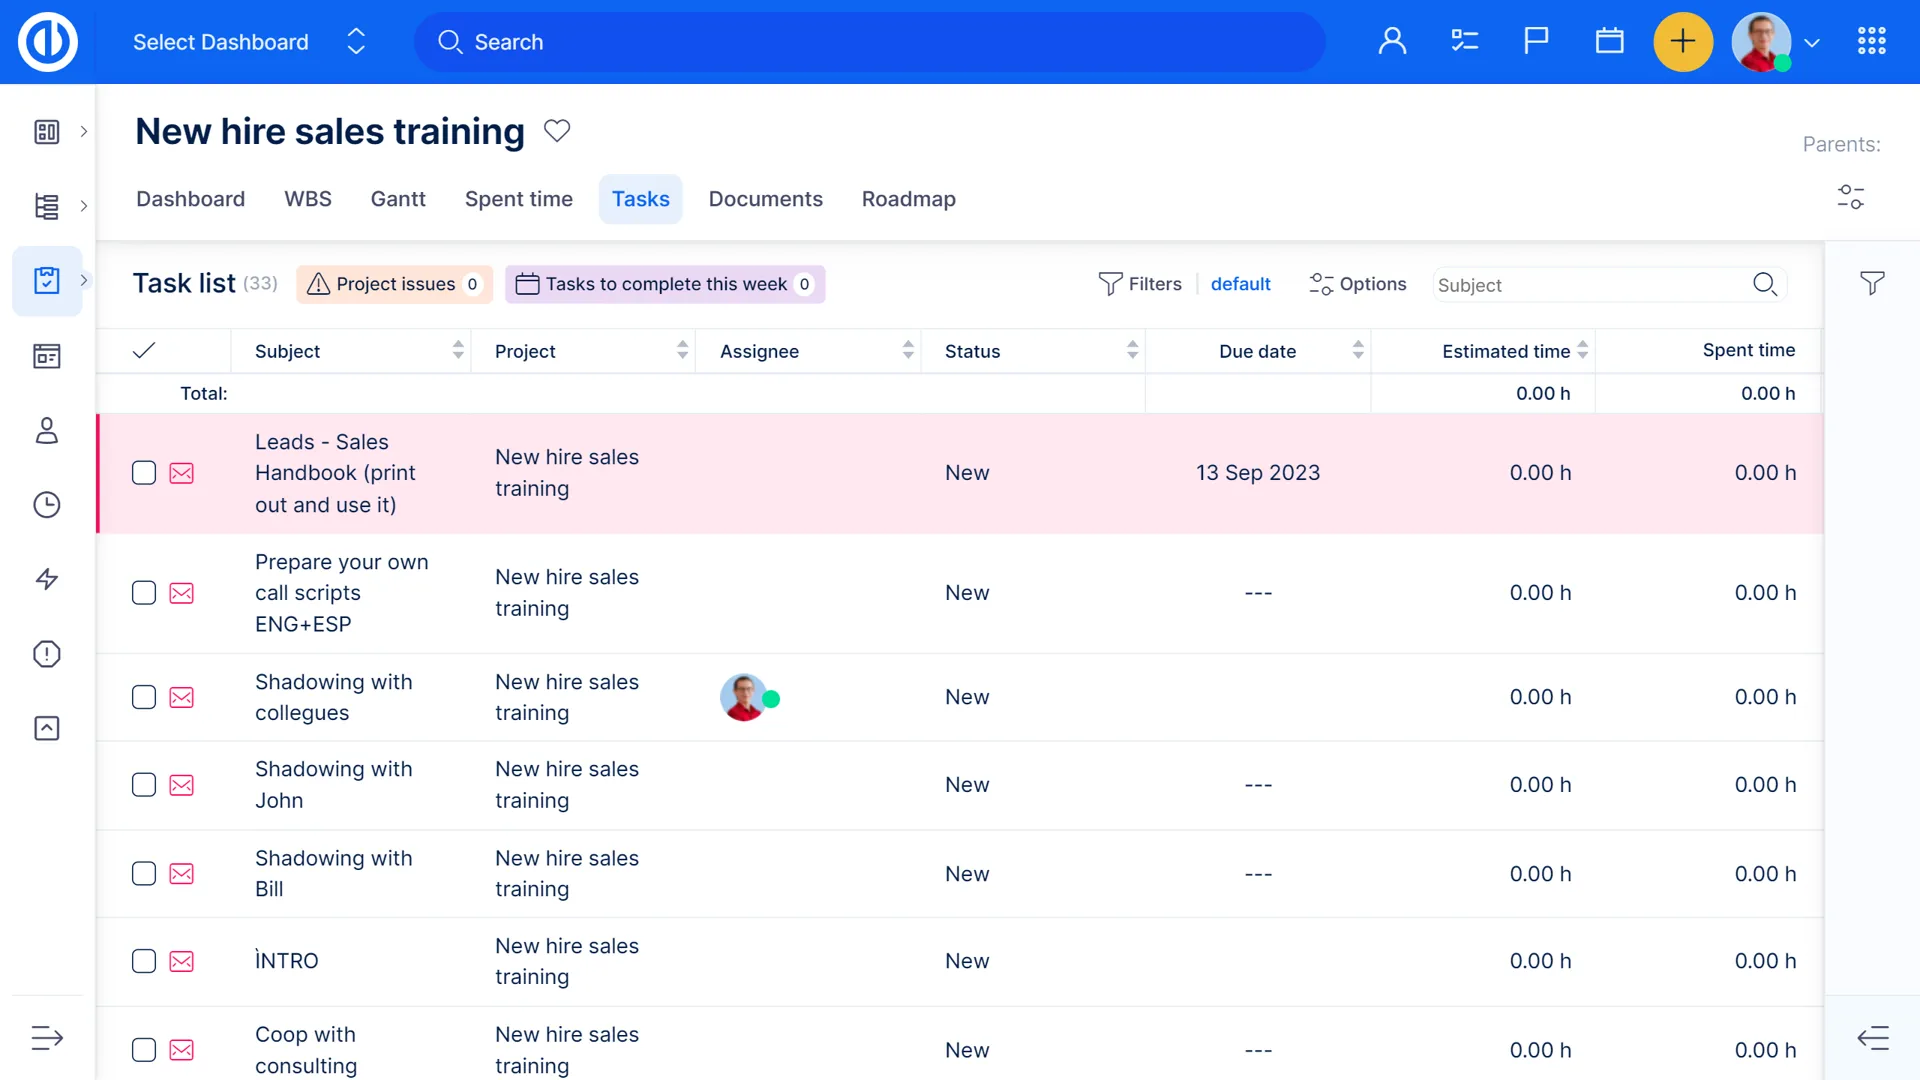
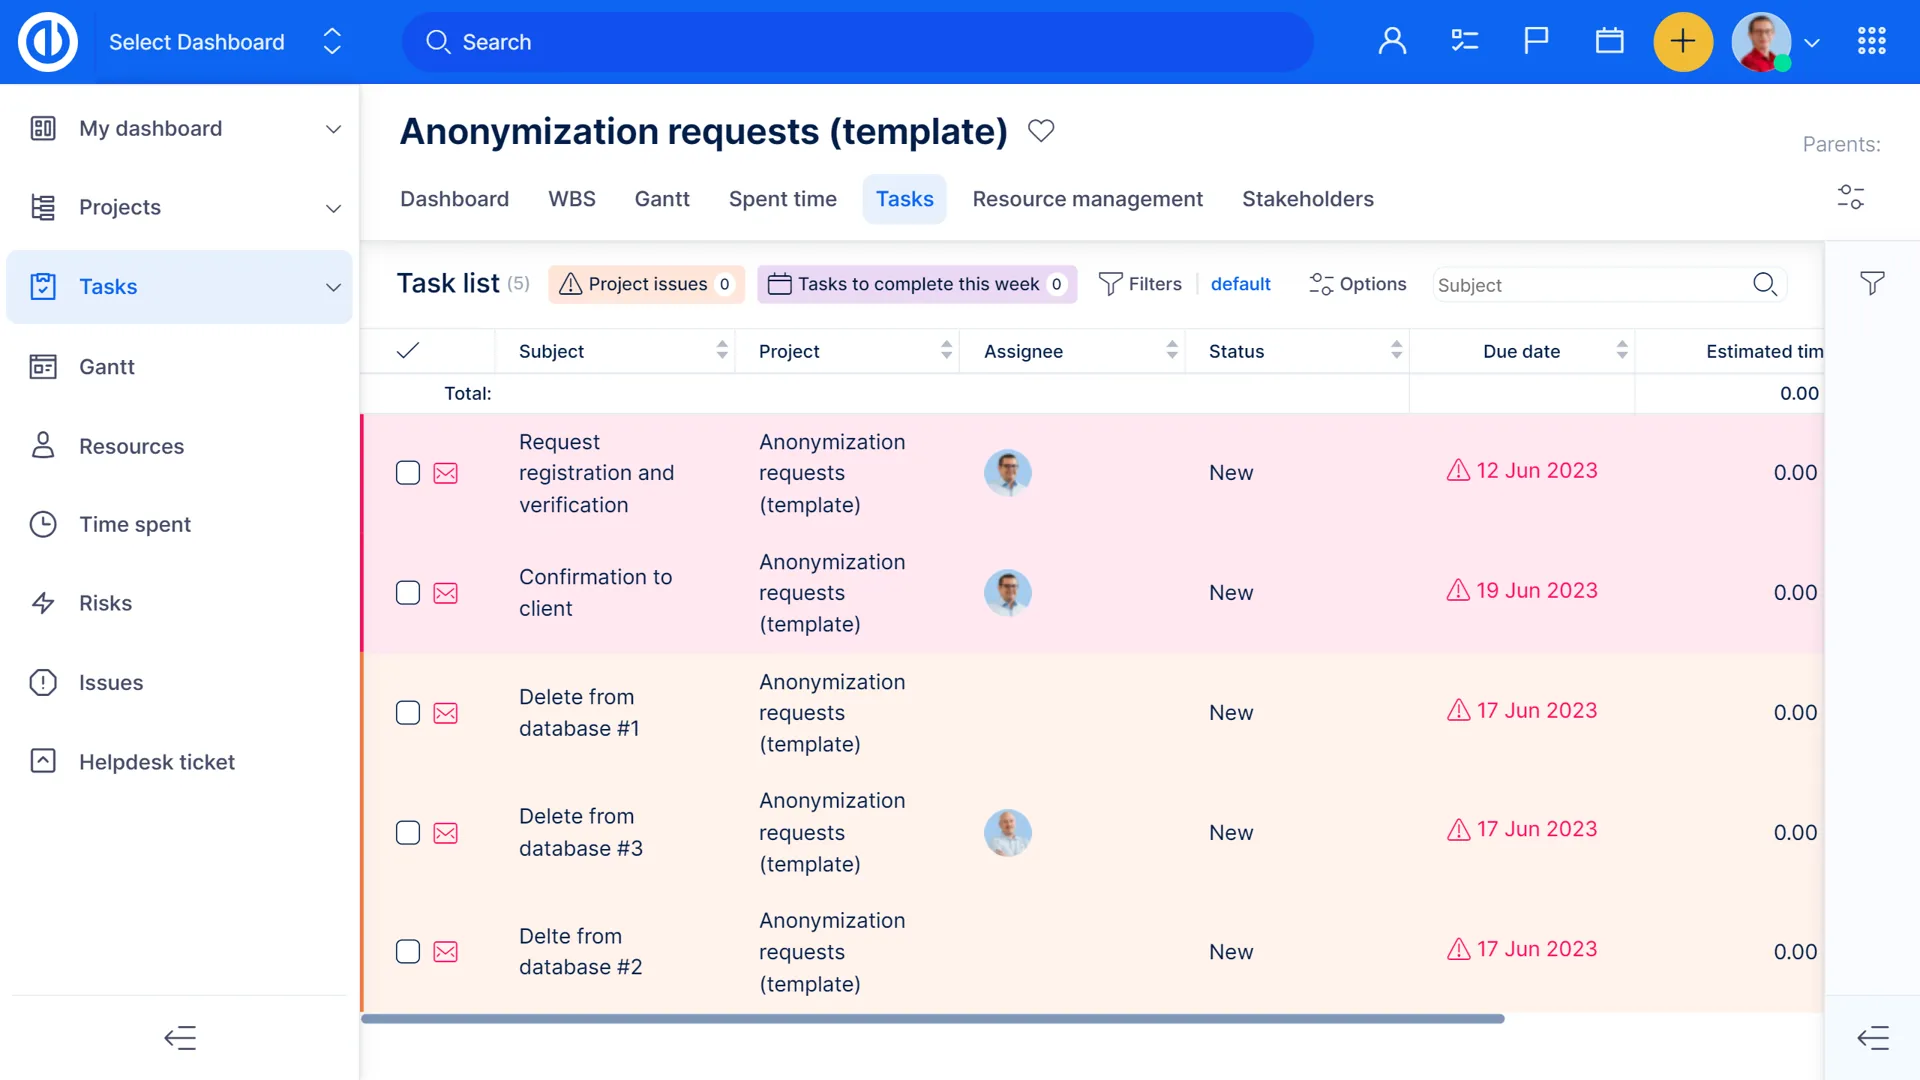
Task Dashboard
Task dashboard can show you the status, task name, task tracker, contact, date, and assignee for each task created. See which tasks have been done, are in progress or overdue - so you know what tasks require your attention in order to keep pace with your project plan/schedule.

Task Templates
Task templates optimise your work processes by enabling you to create and reuse templates for repetitive tasks while saving you time and allowing you to focus on more value-added issues. By utilising Task Templates, you can swiftly generate standardized tasks with preset configurations, fields, and explanations, guaranteeing consistency and productivity in your project and work management. This approach not only enhances efficiency but also ensures that all critical elements are covered, minimising the risk of overlooking key components in your projects.

People Dashboard
People Dashboard allows you to see information about your users at a glance. Use the dashboard to view users tasks and their statuses, project membership status of users, assigned work completion, finished tasks, spent time, personal costs, and much more!

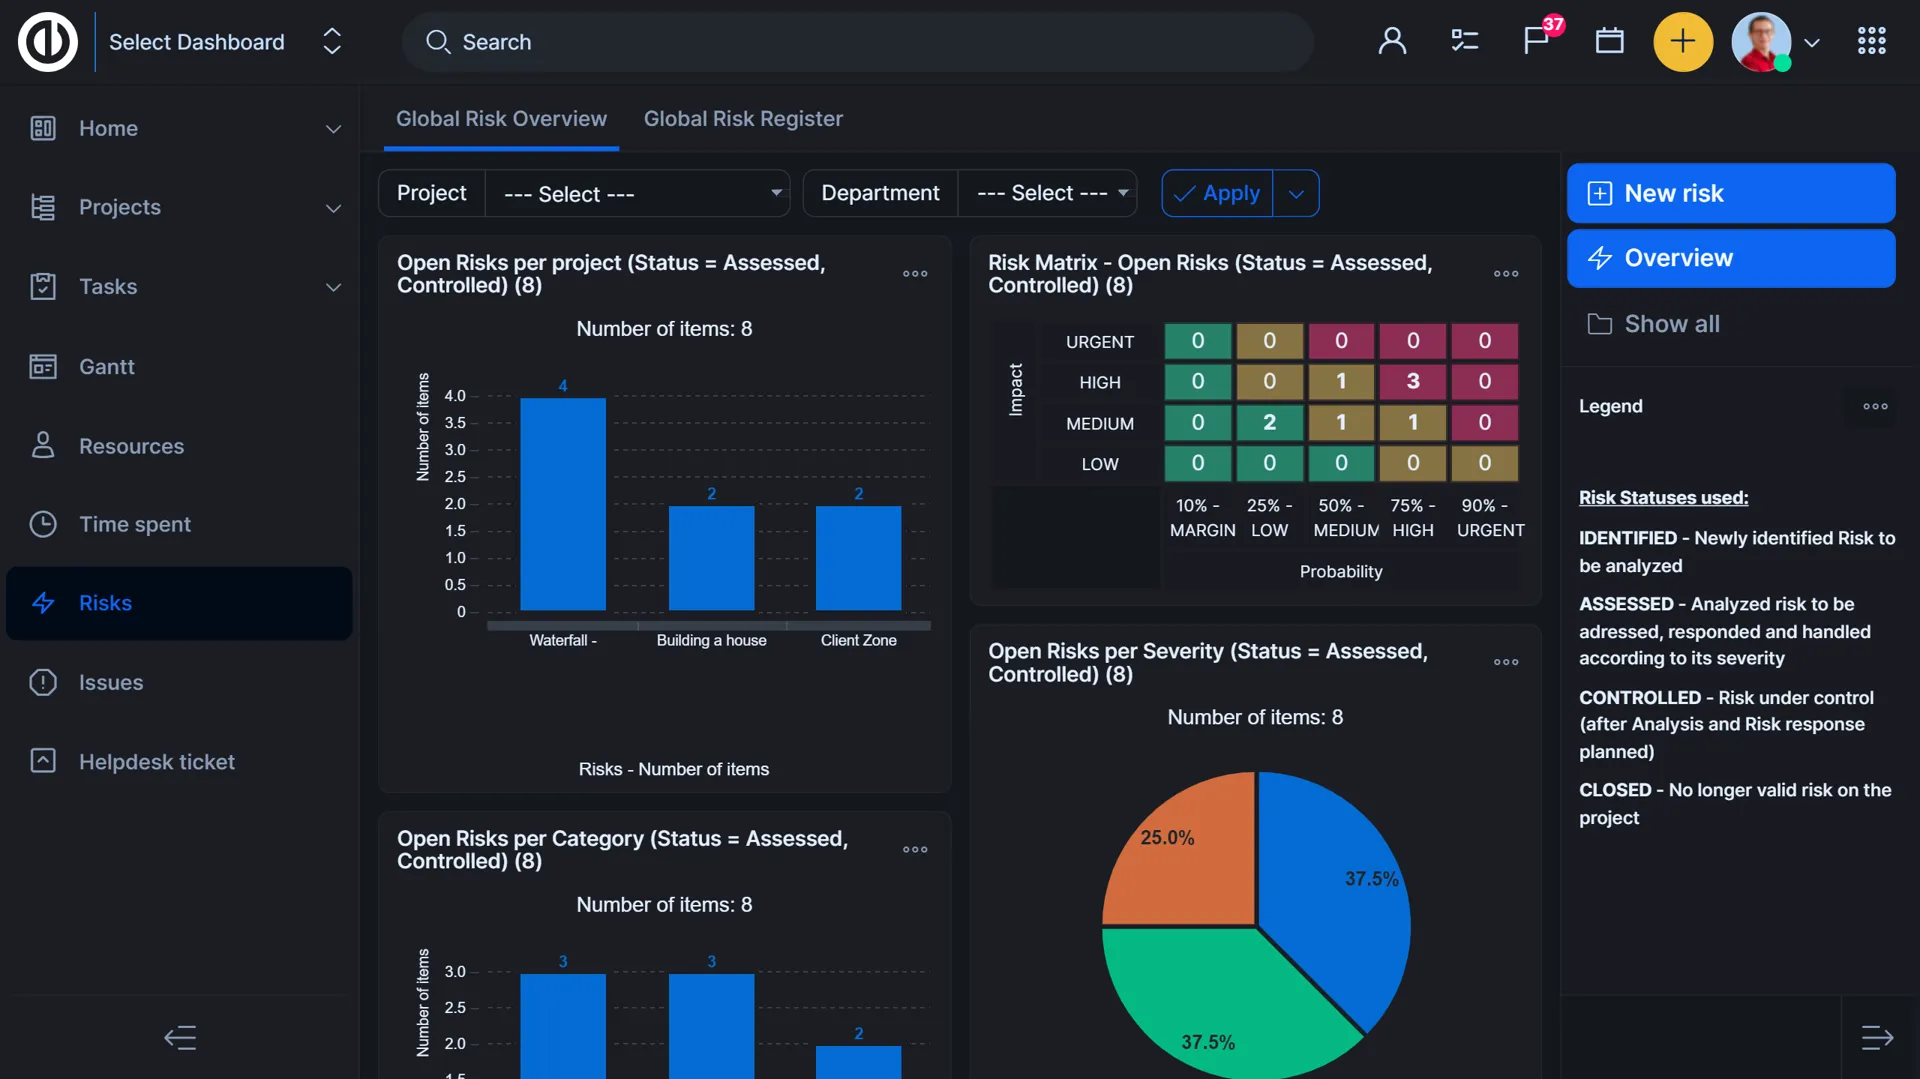
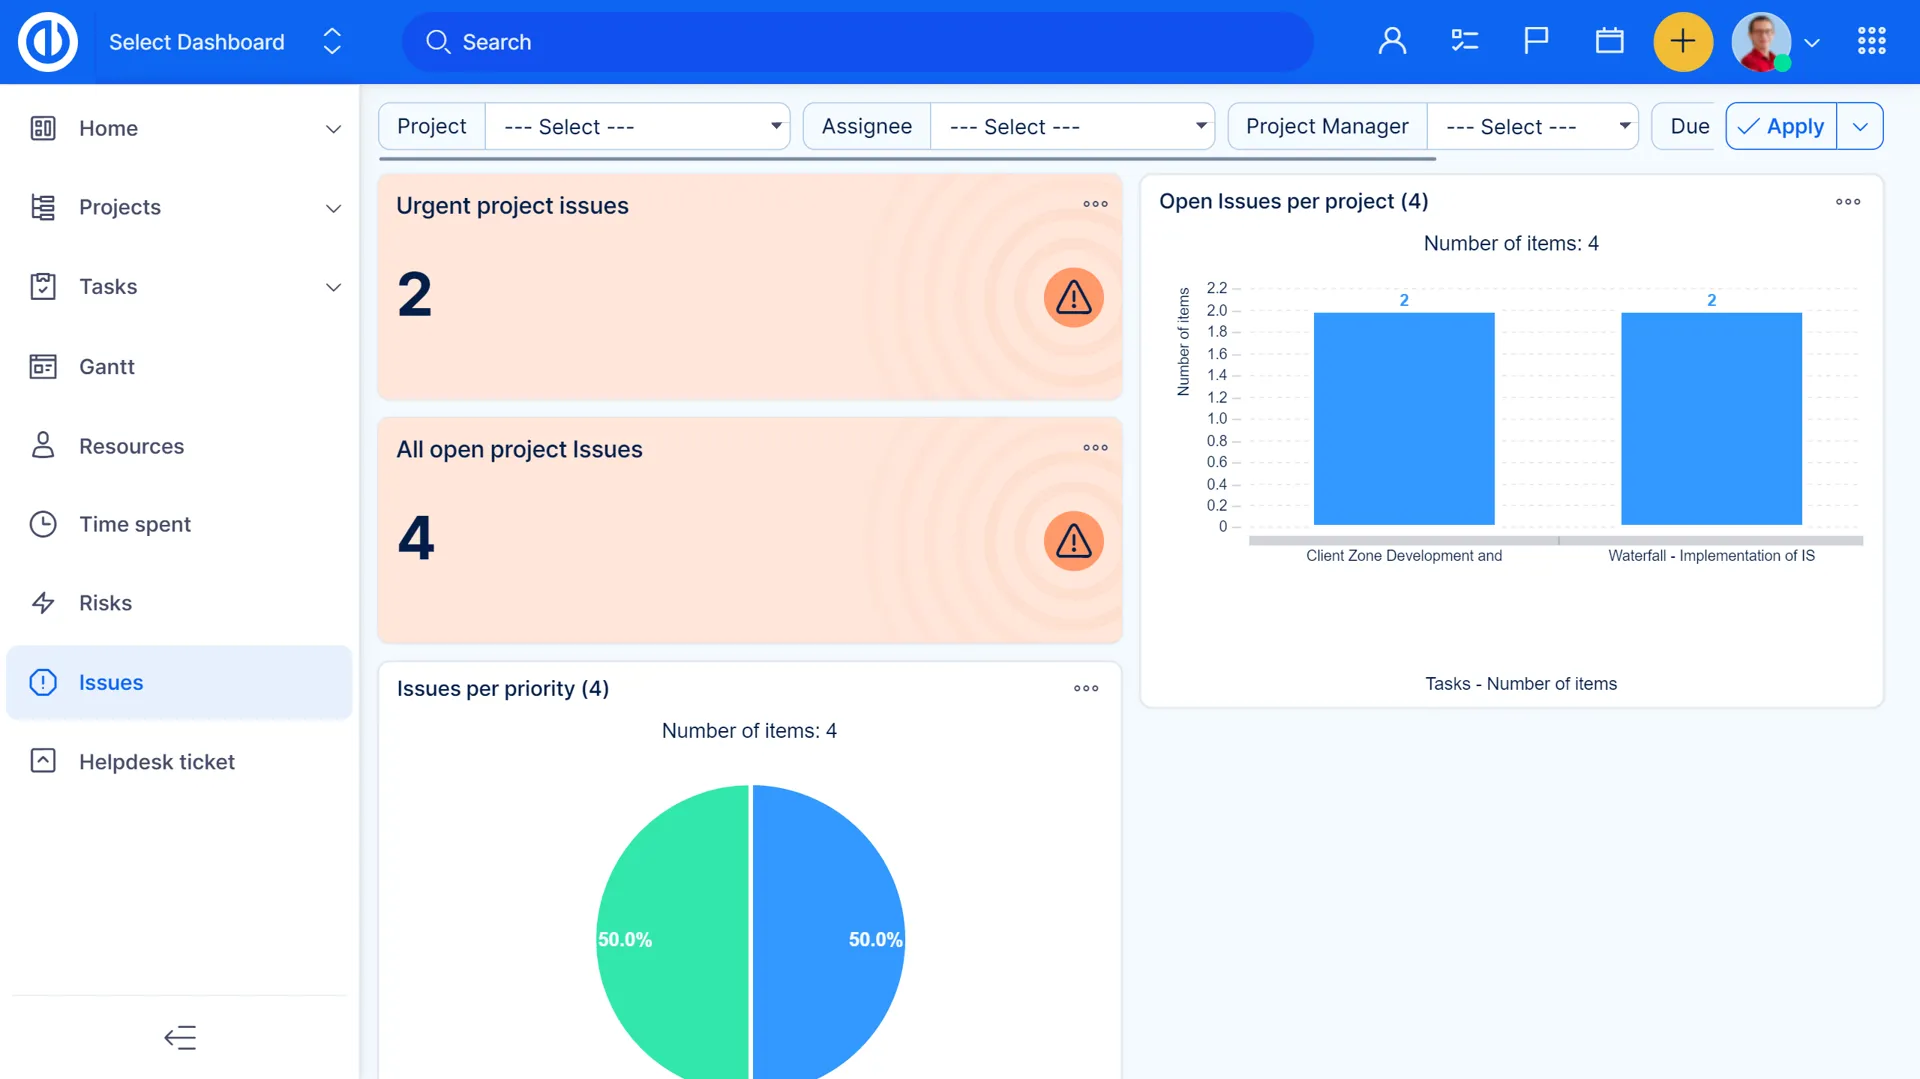
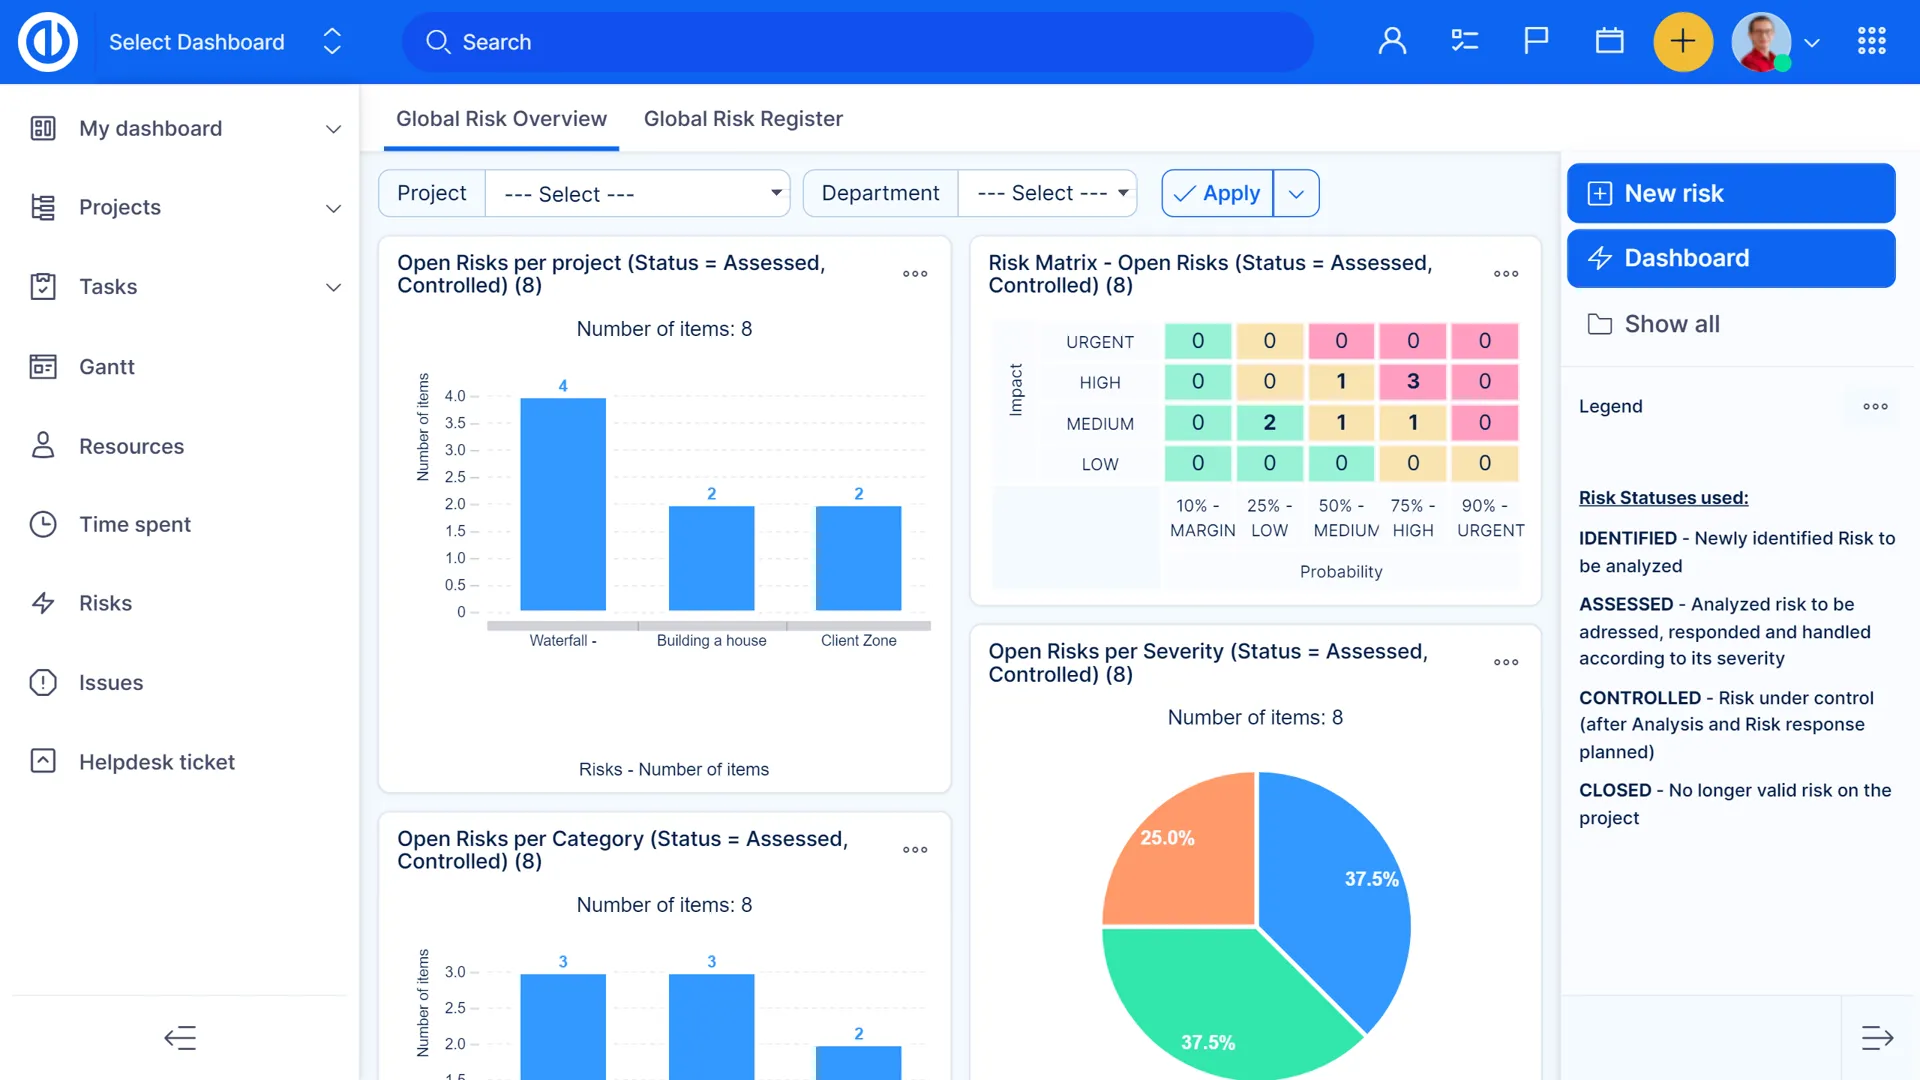
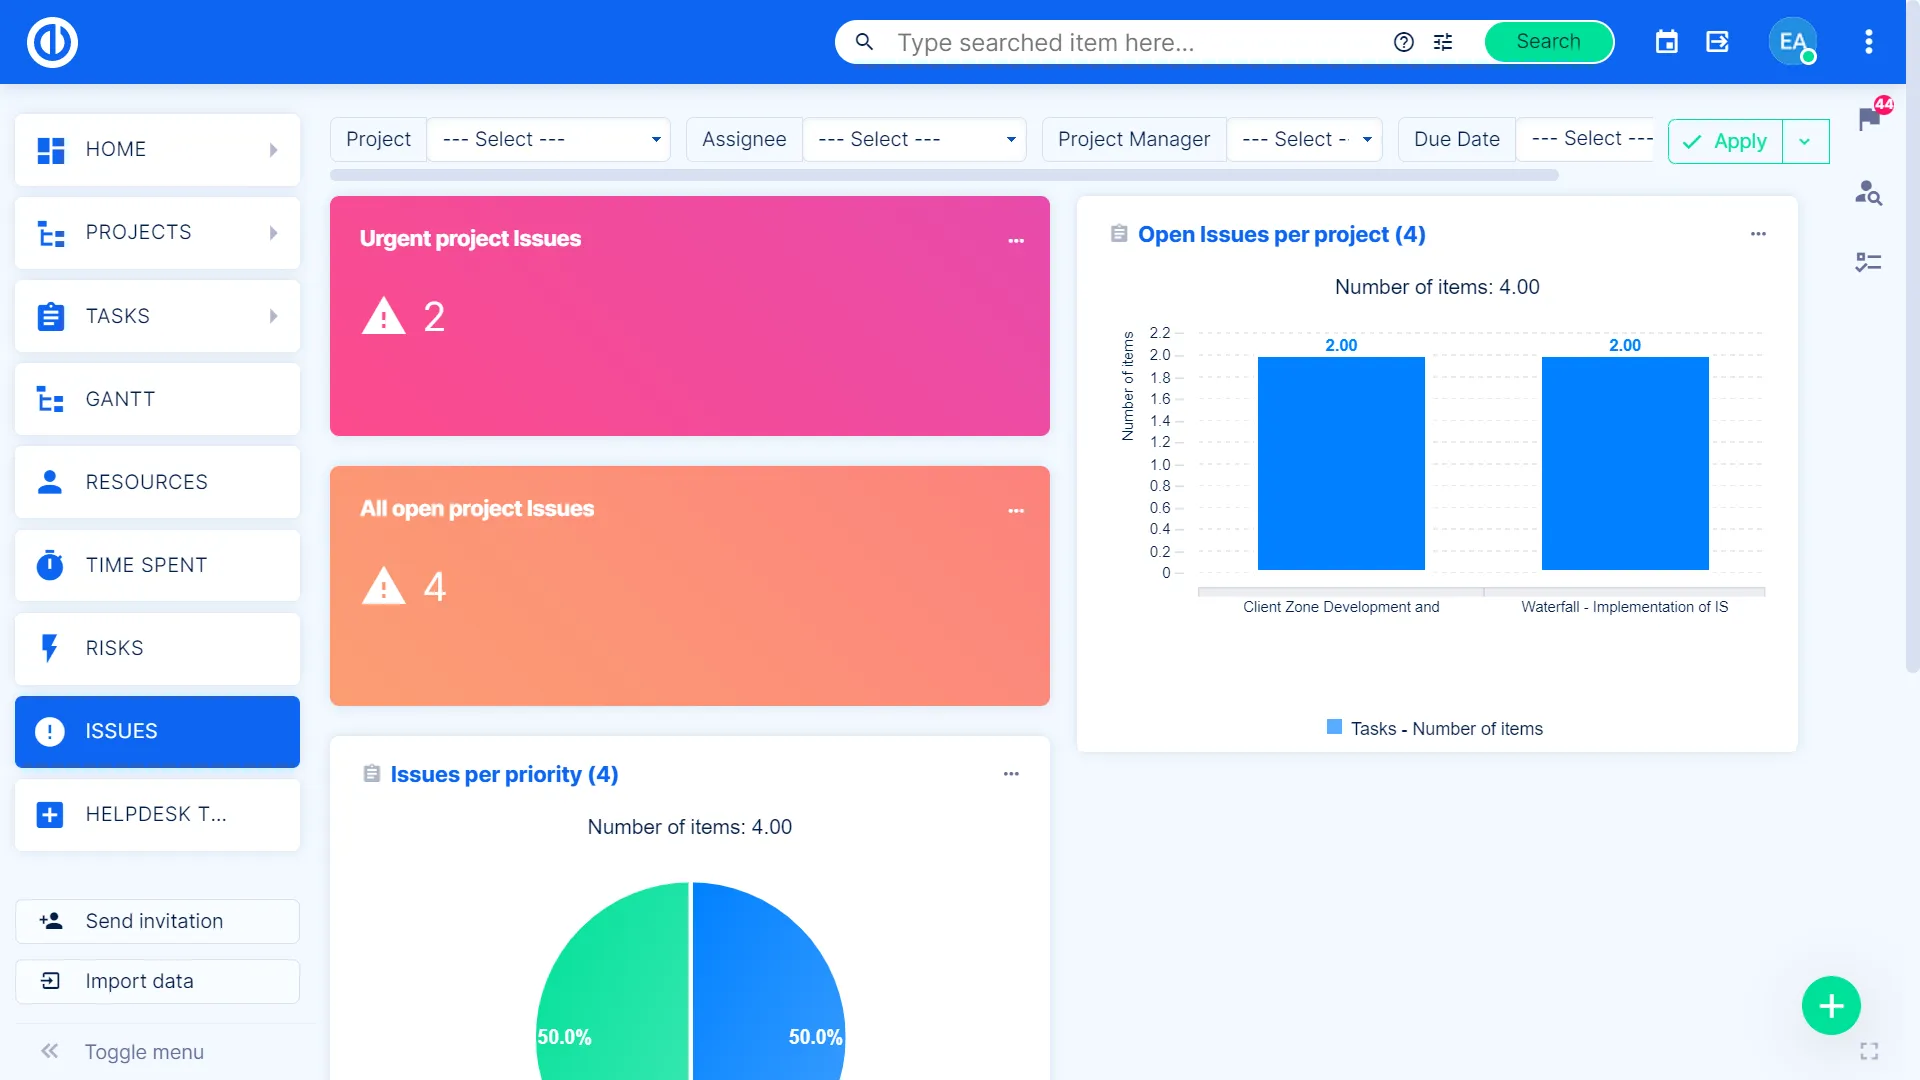
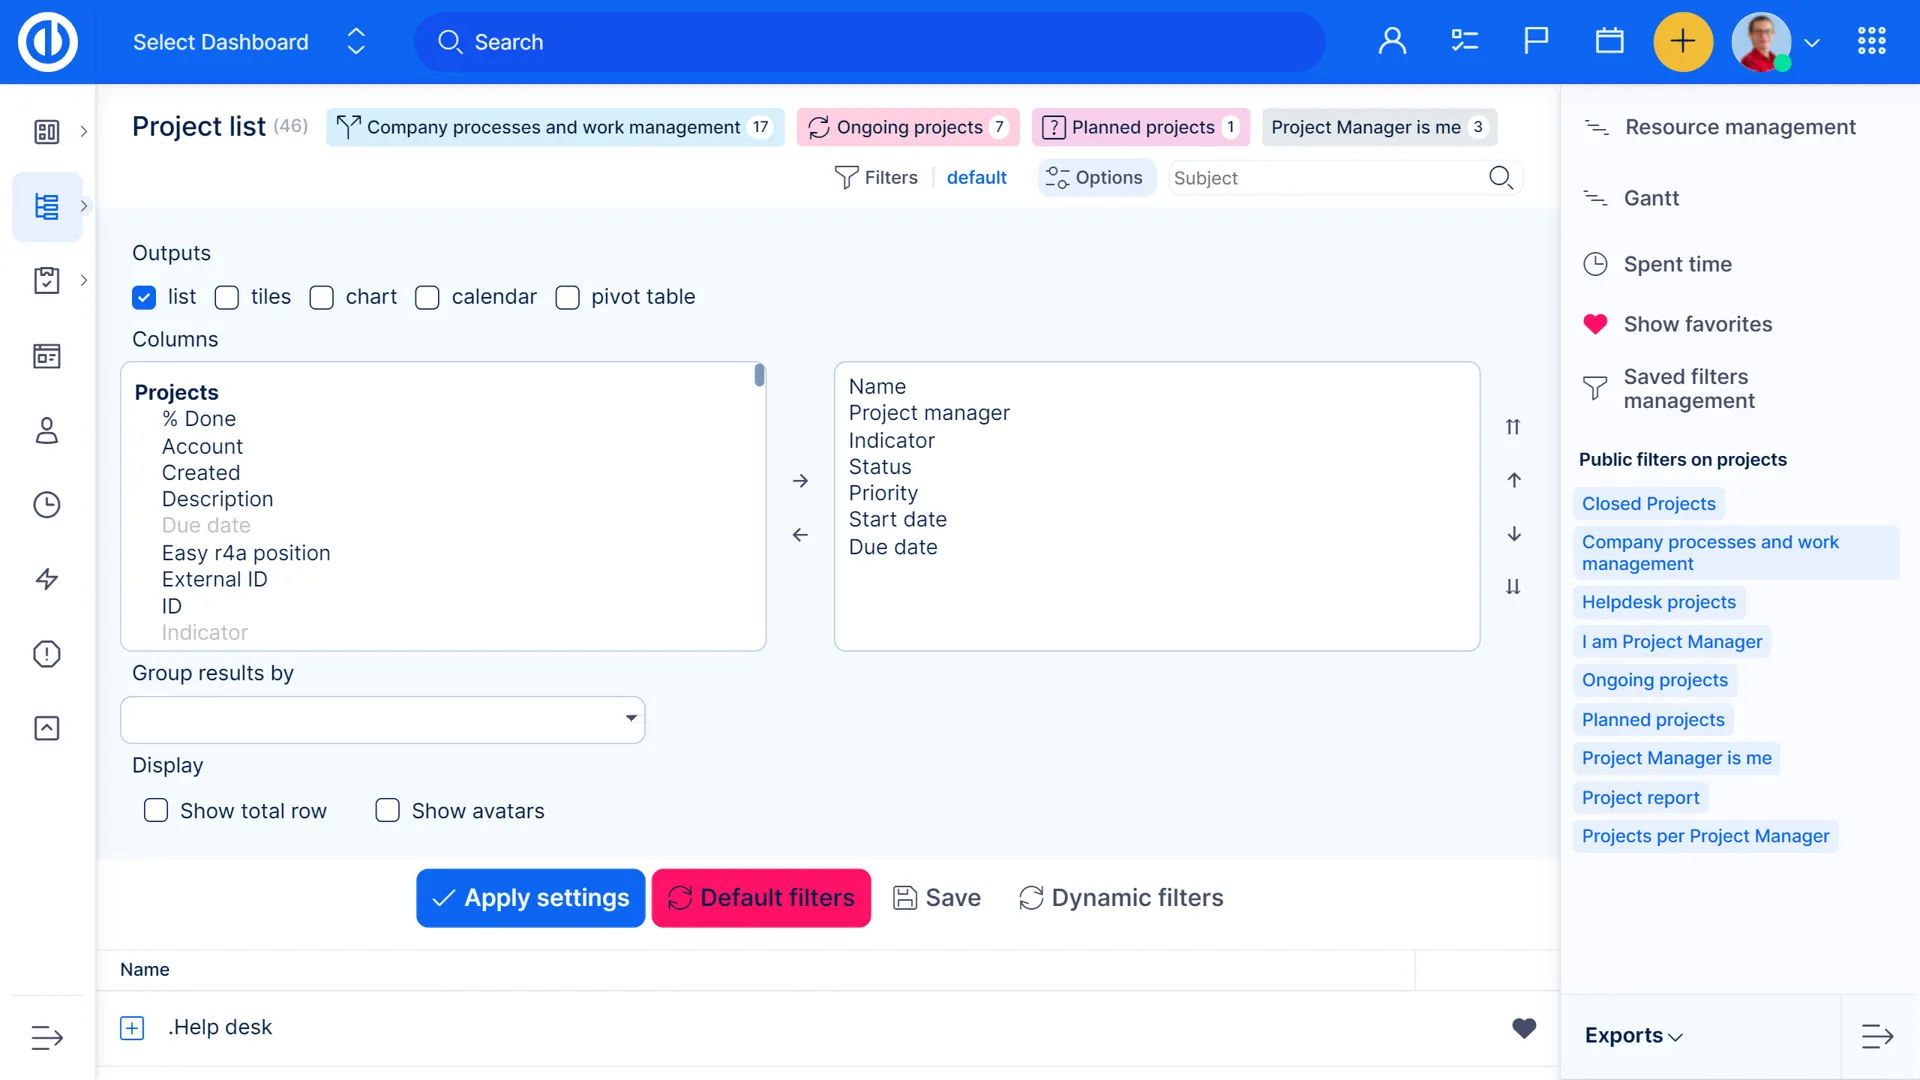
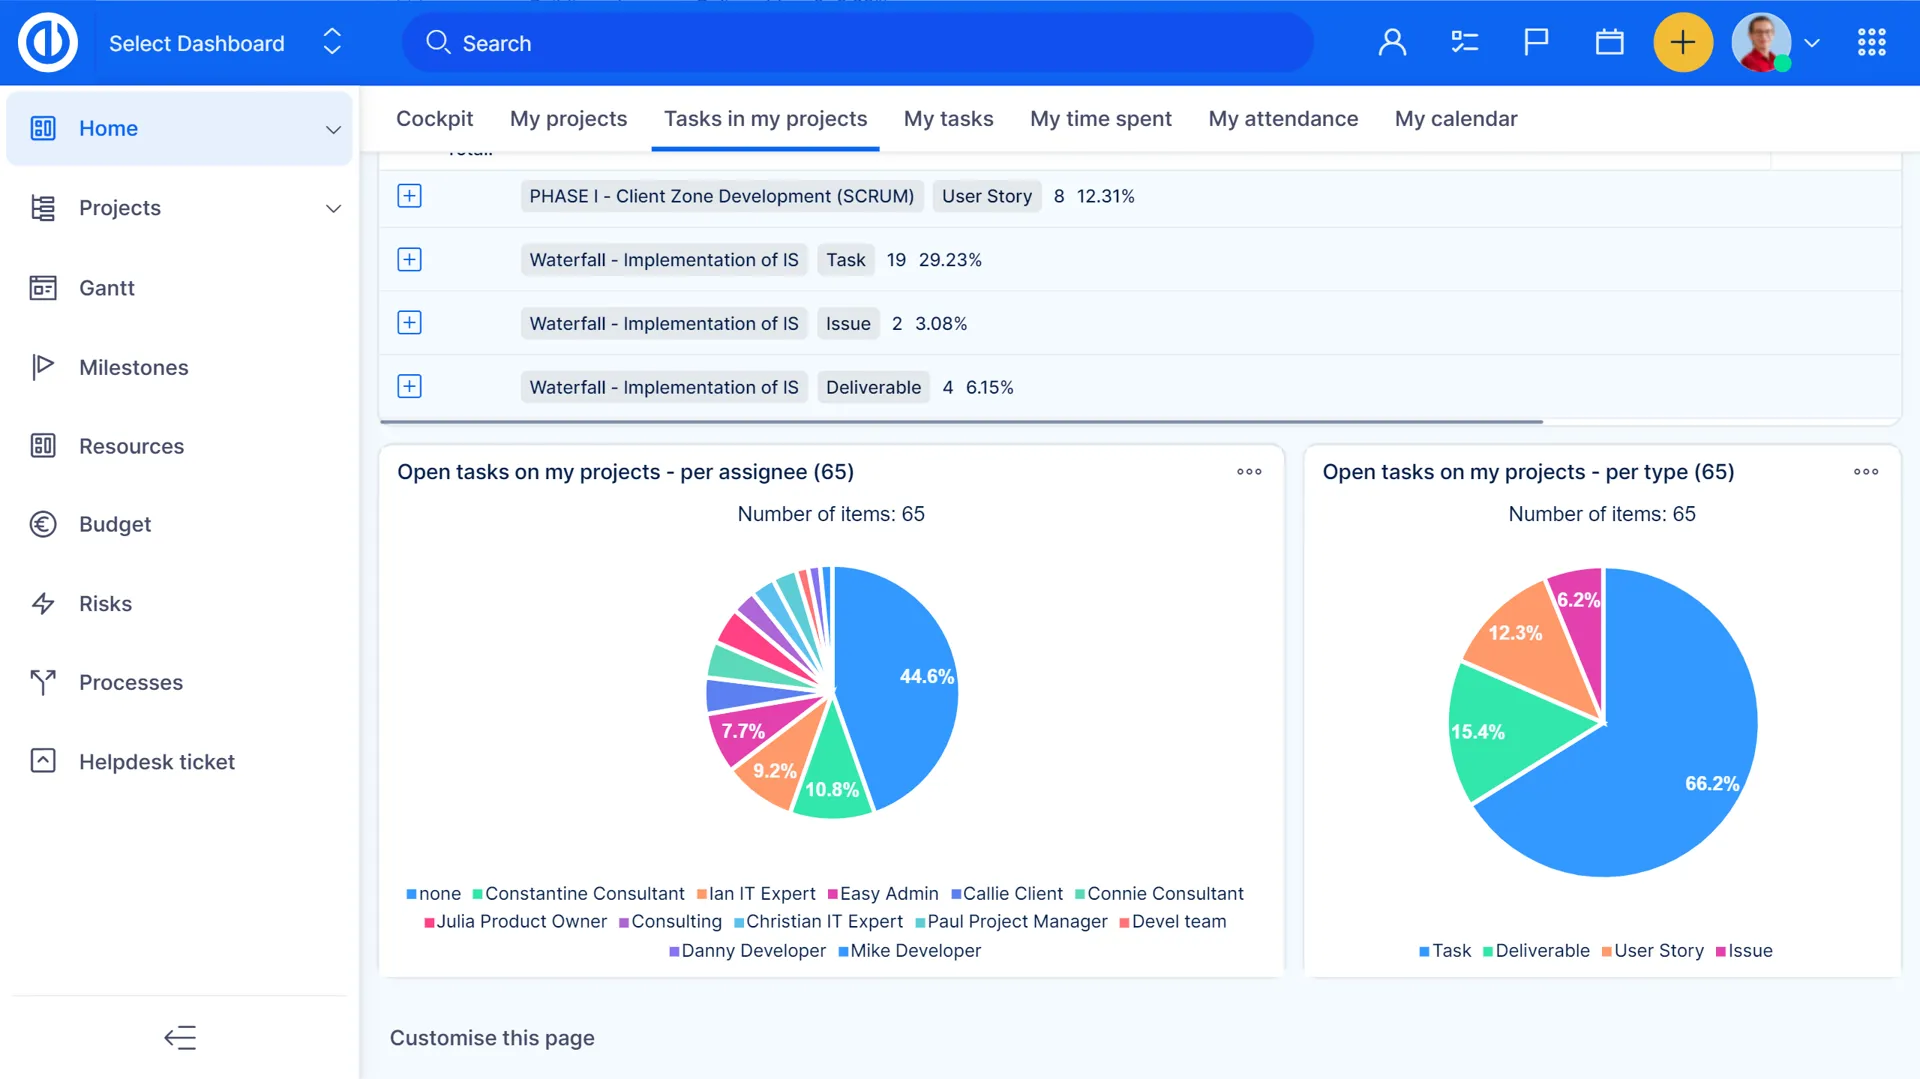
Business Dashboards
Business dashboards consist of three main features - global filters above dashboards, graphs and charts with click-through functionality, and trends. With global filters, a user can apply a filter to all or just selected modules on a personalized page together in just two clicks. Graphs and charts can be configured to show a specific page (dimension) upon a click on the chart values. Moreover, trends give you real-time values and trends overview just after one glance on a dashboard.

Task tracking for up-to-date projects
Update task features according to your permissions, visualize project progress and push tasks through the workflow. Task tracking eliminates the need for status update meetings, since everything can be tracked in Easy Project.

Comment Reactions
Enhance your project management process and maintain tidy, well-structured comment areas with Easy Project's comment reactions feature. Swiftly respond, endorse, and give feedback using an assortment of emojis, preventing overcrowding in the task discussion space. All in one click.
This functionality allows team members to efficiently communicate without inundating the comments section, promoting a more streamlined and visually appealing workflow.

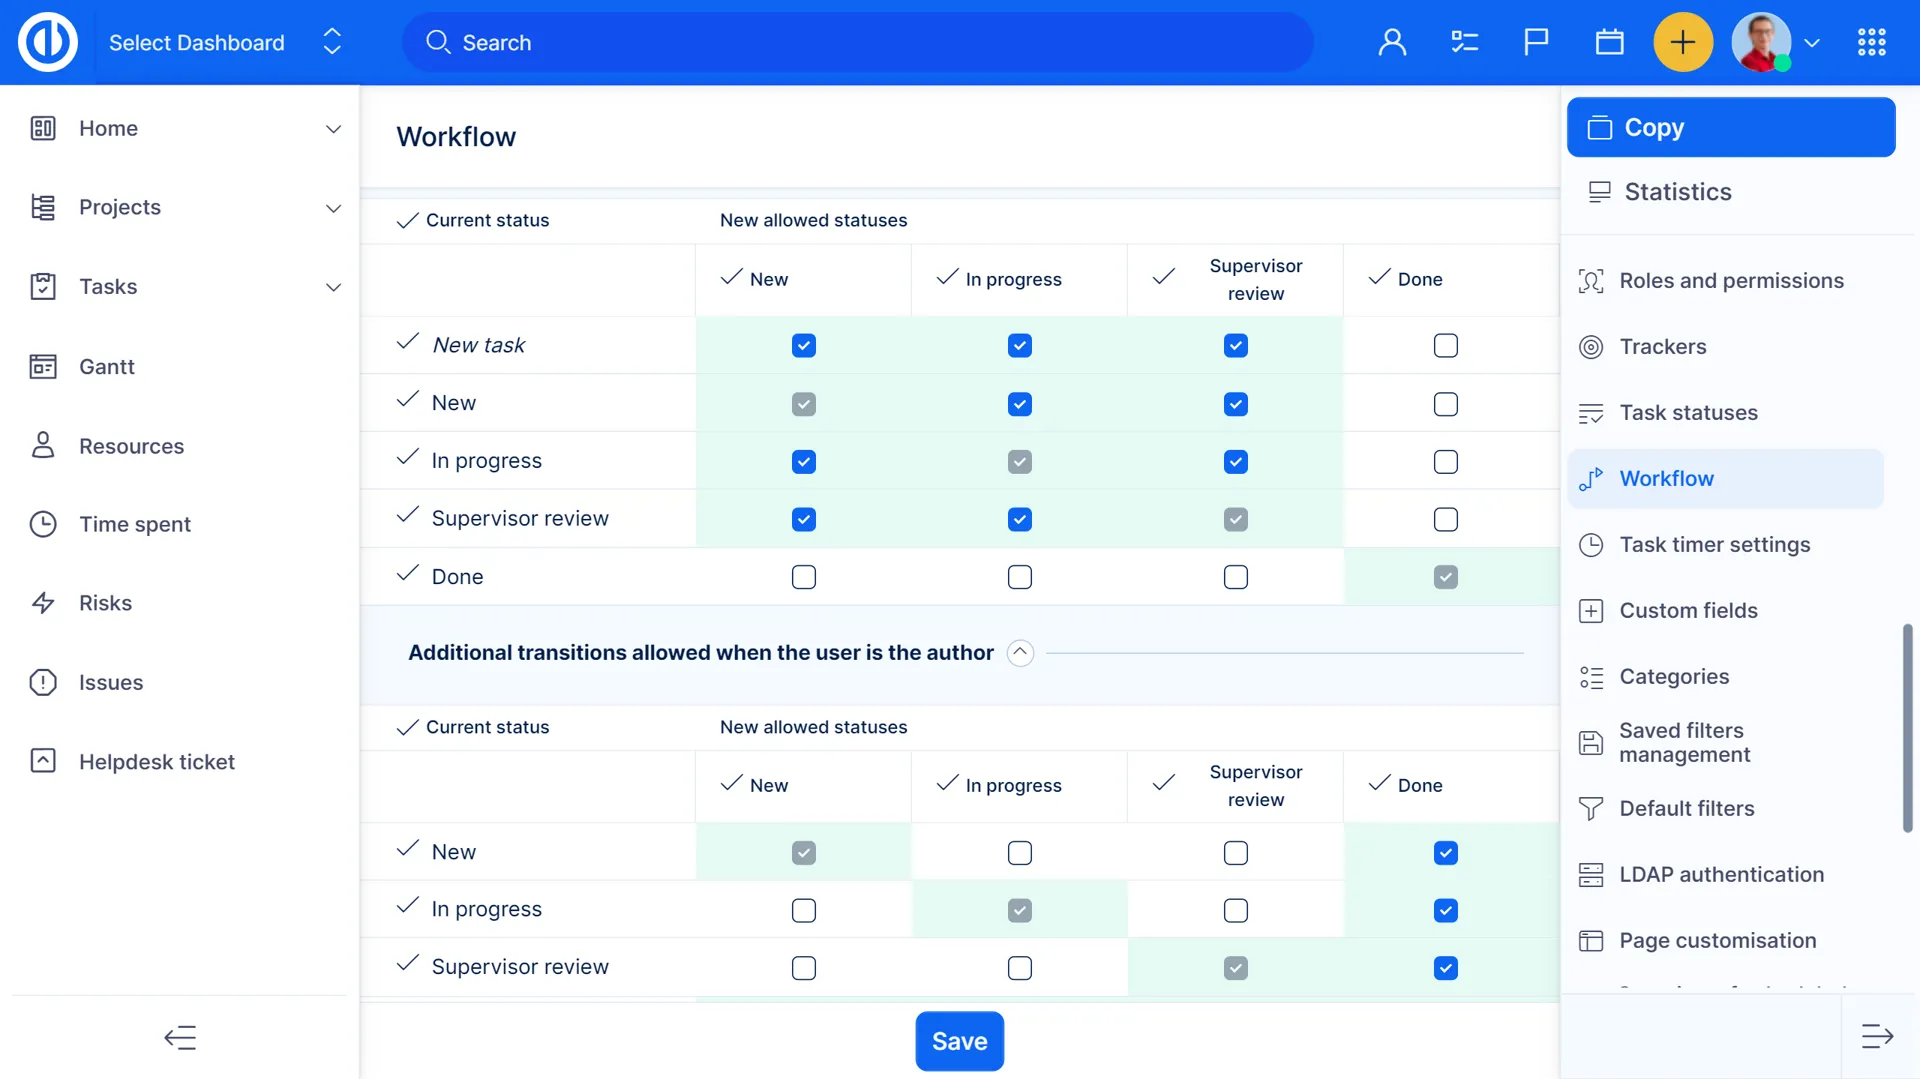
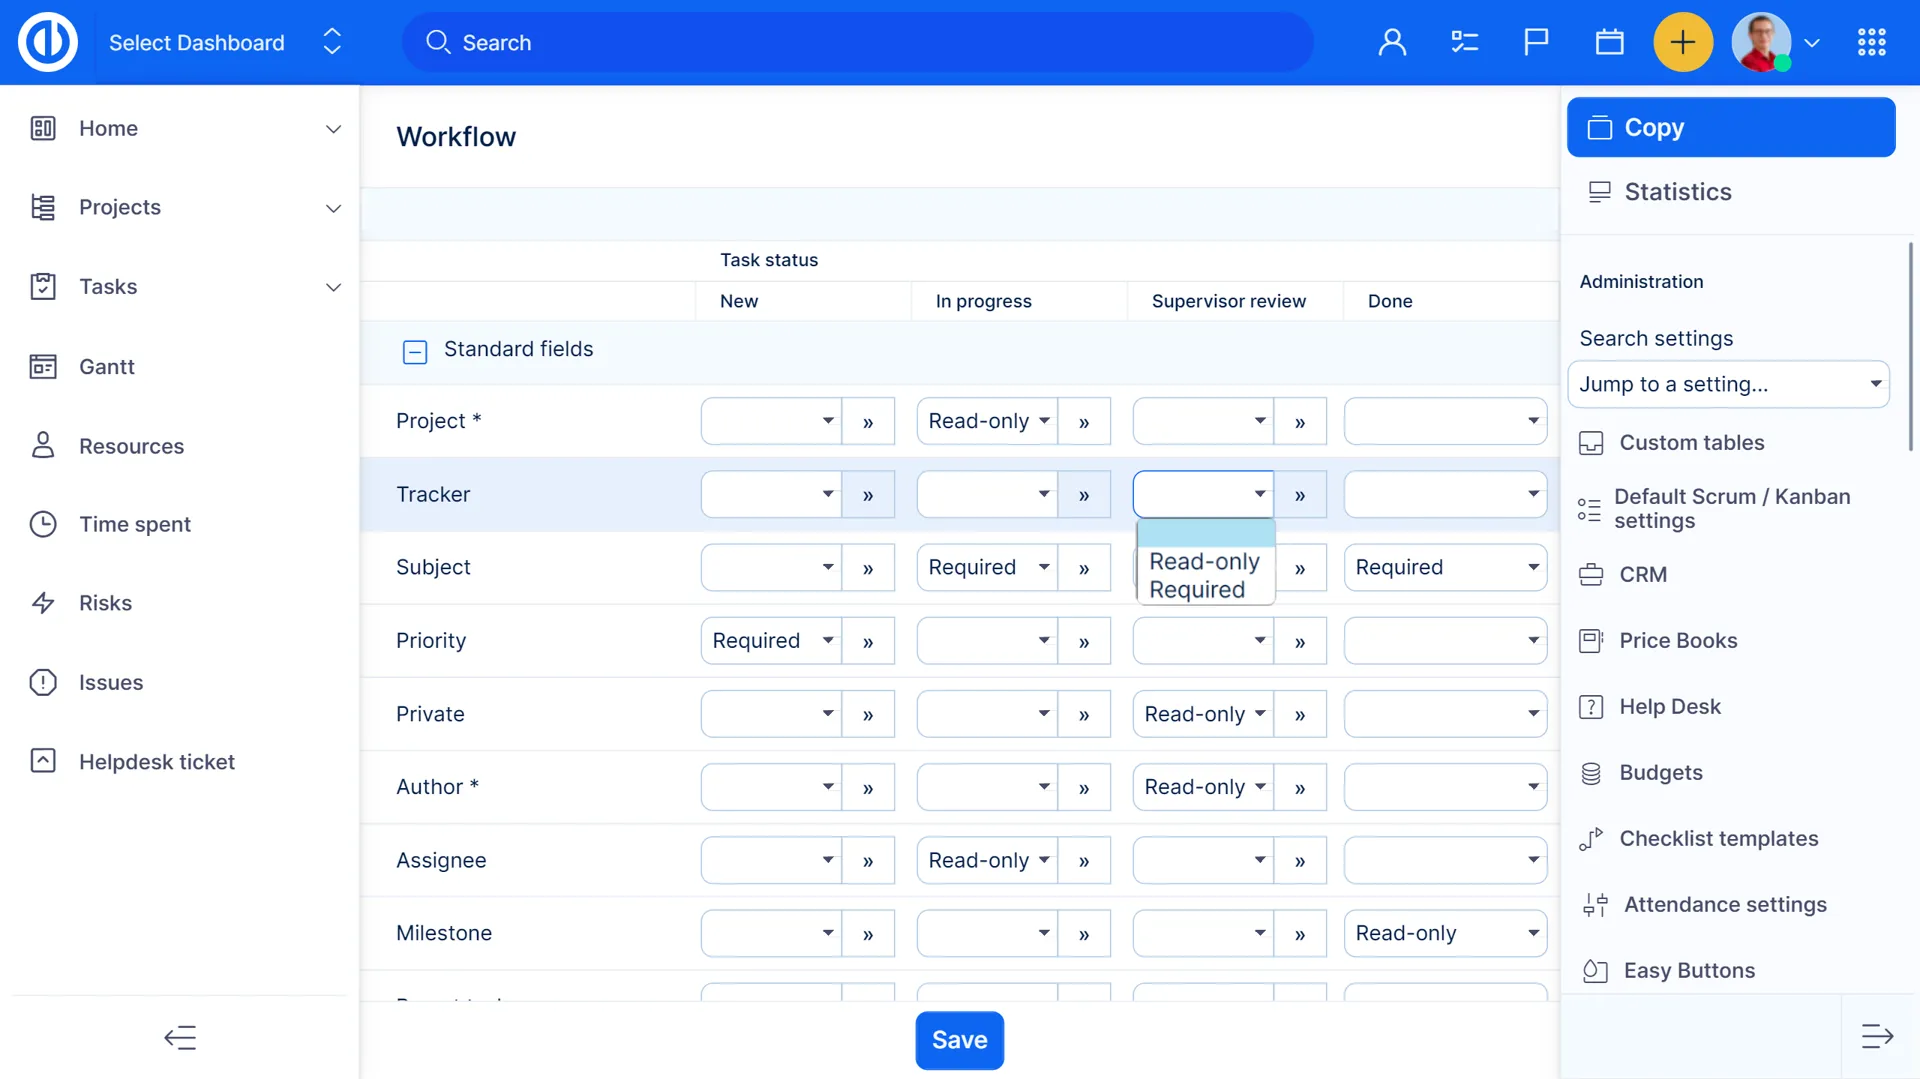
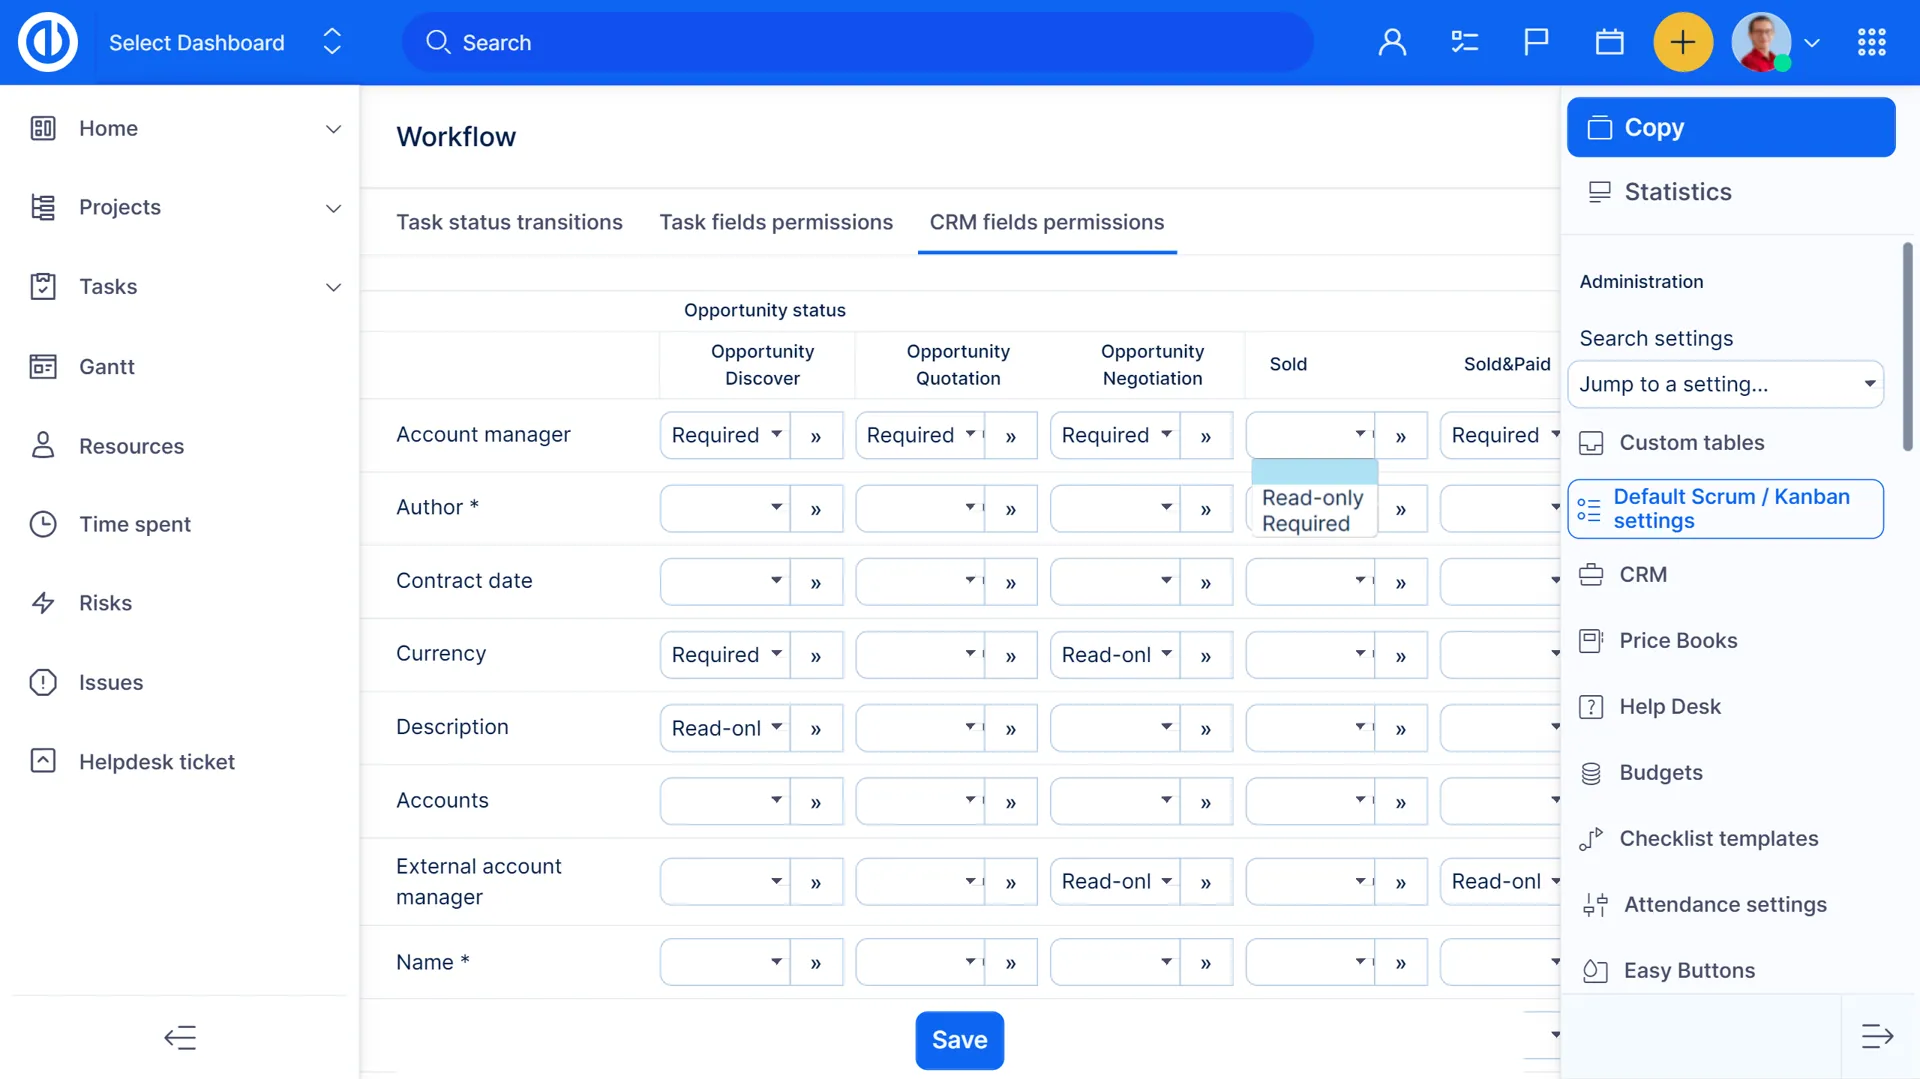
Workflow
Workflow allows you to define, execute, and automate business processes, eliminating chaos and coordinating tasks between employees. Easy Project allows you to set task permissions and workflows based on user types.

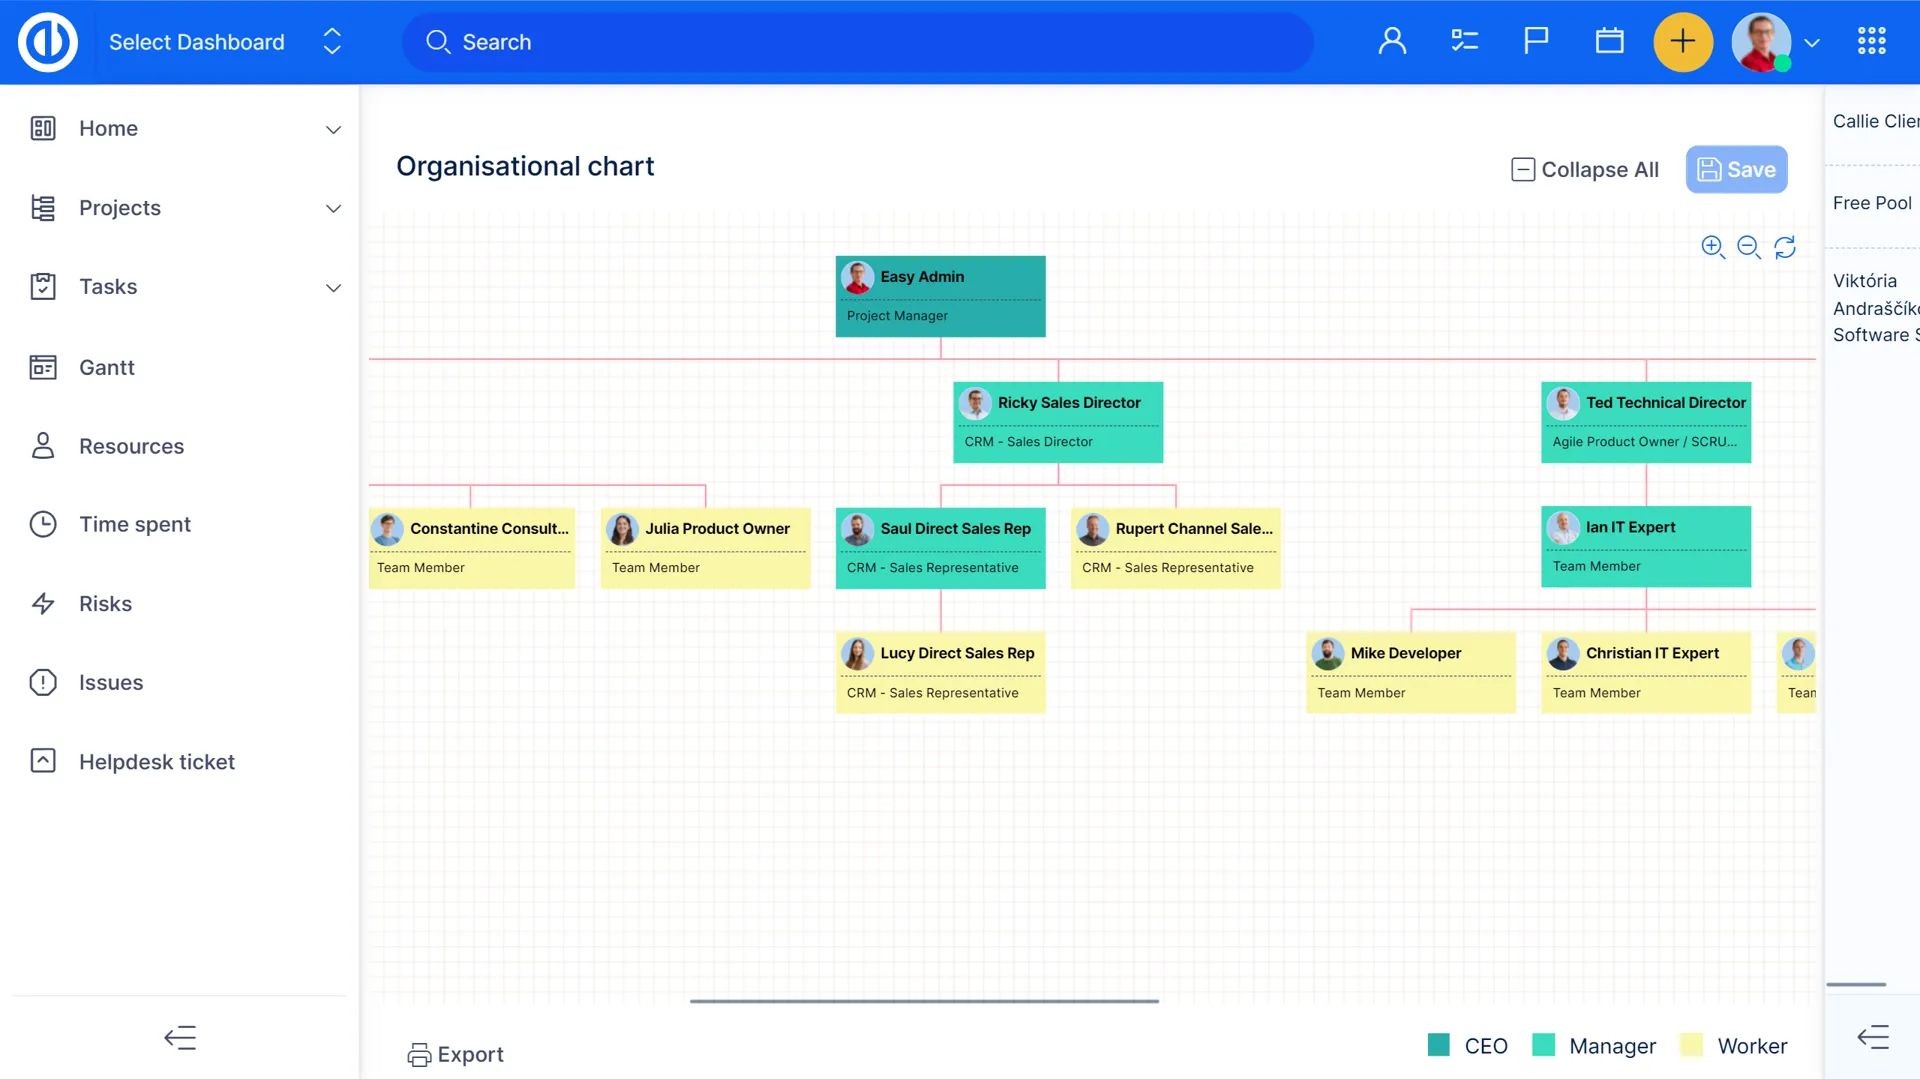
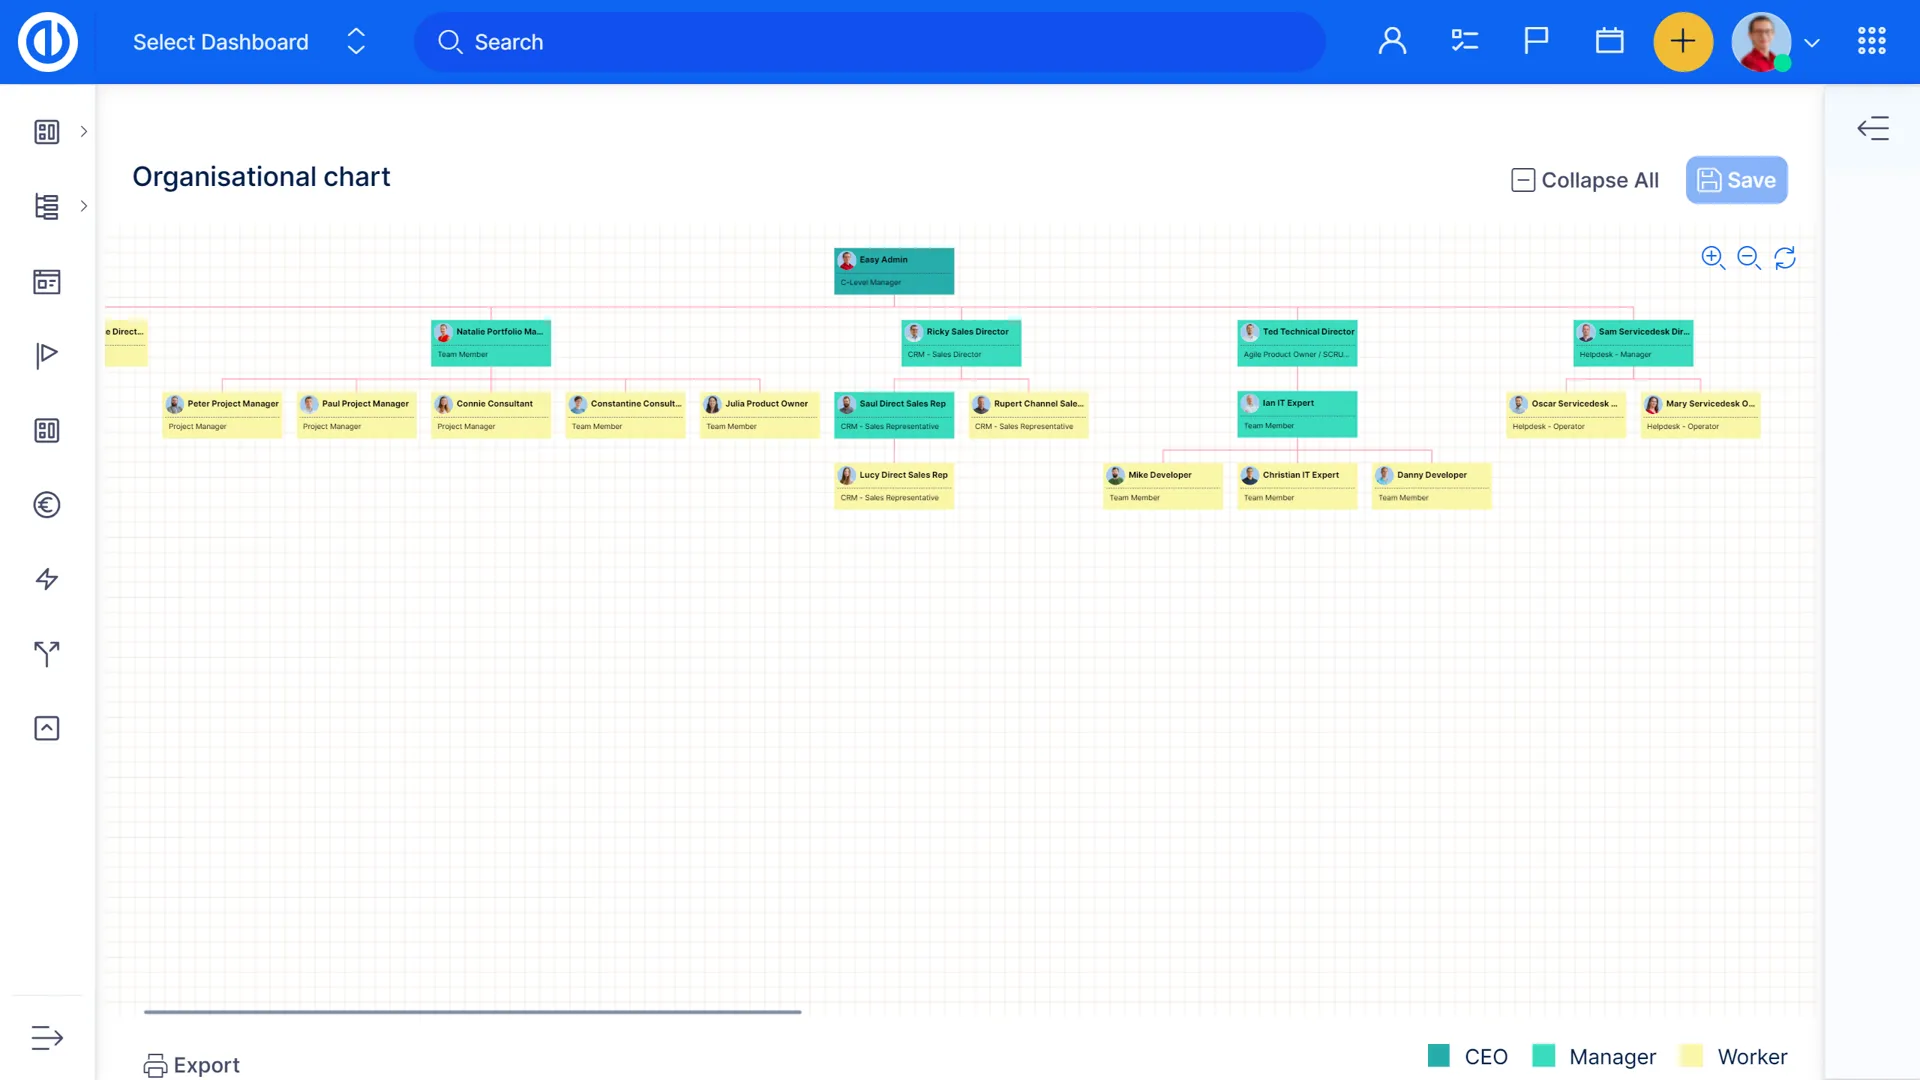
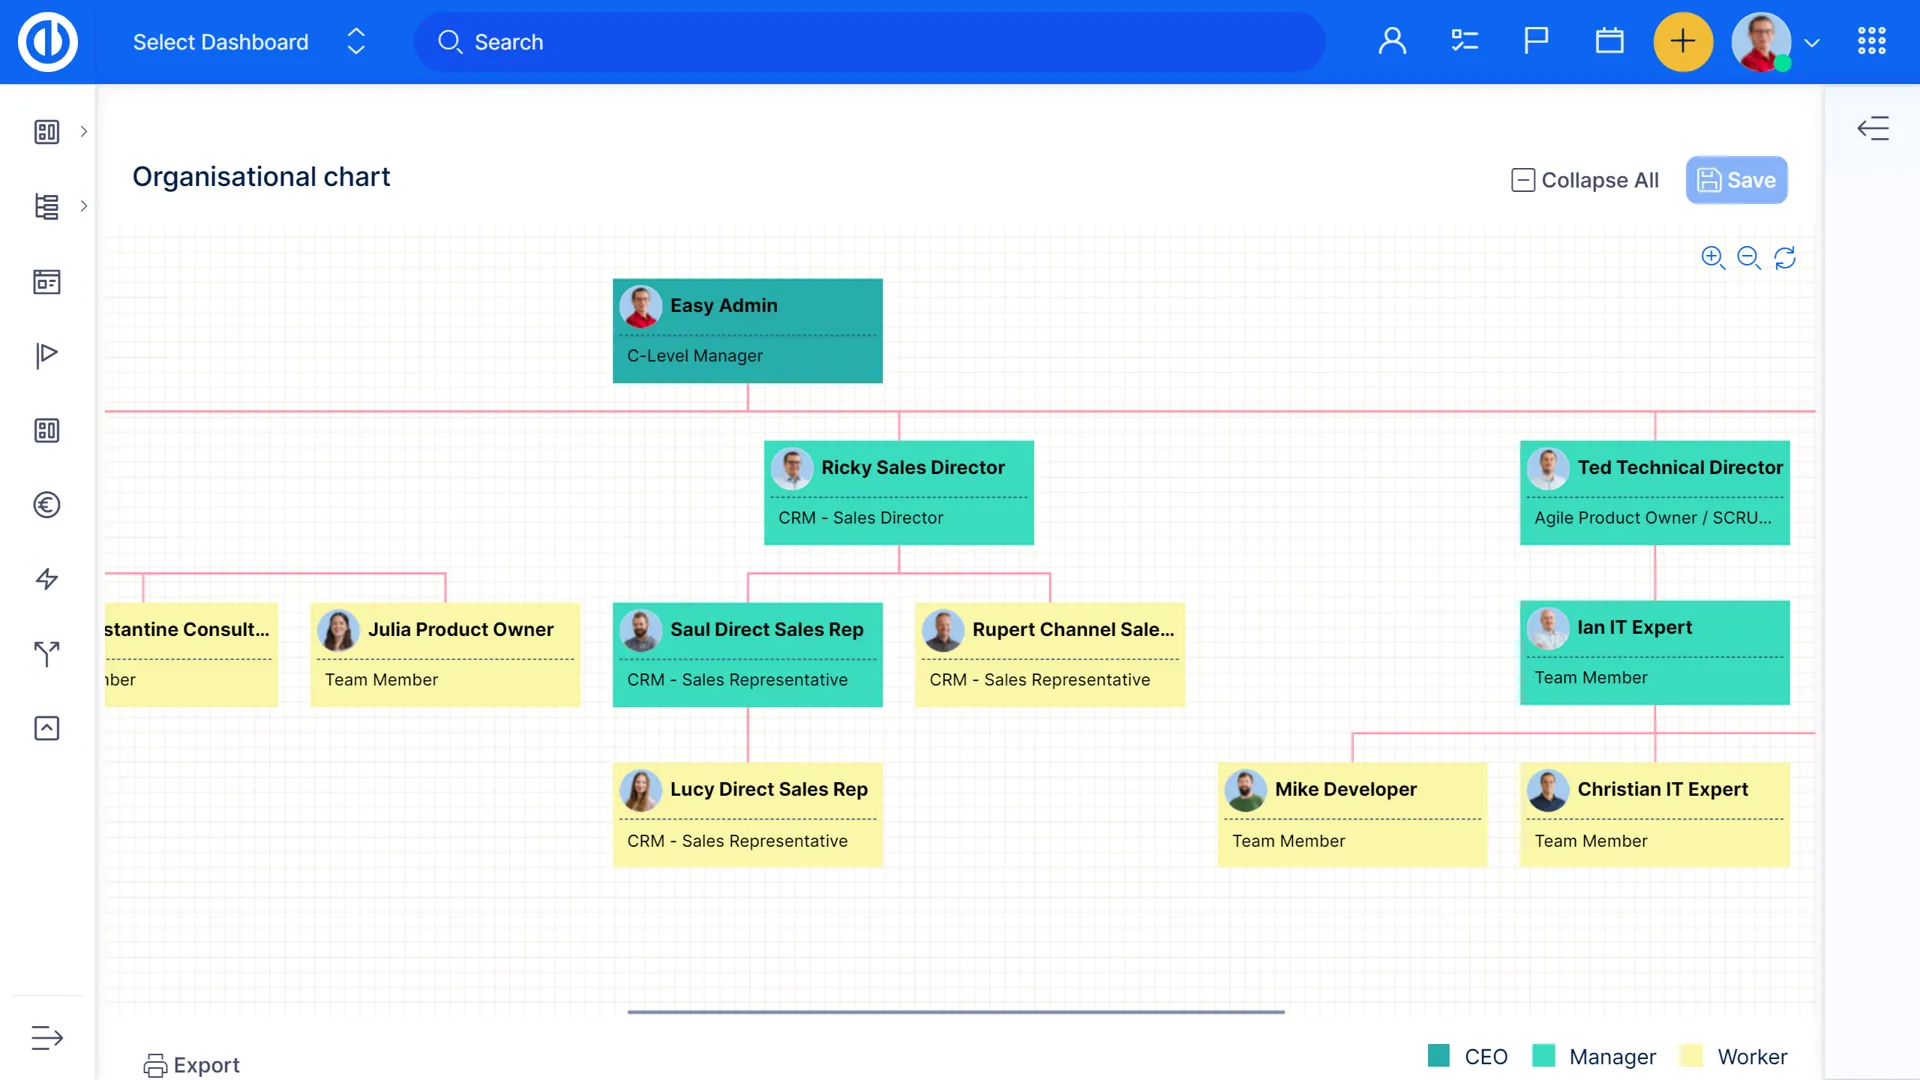
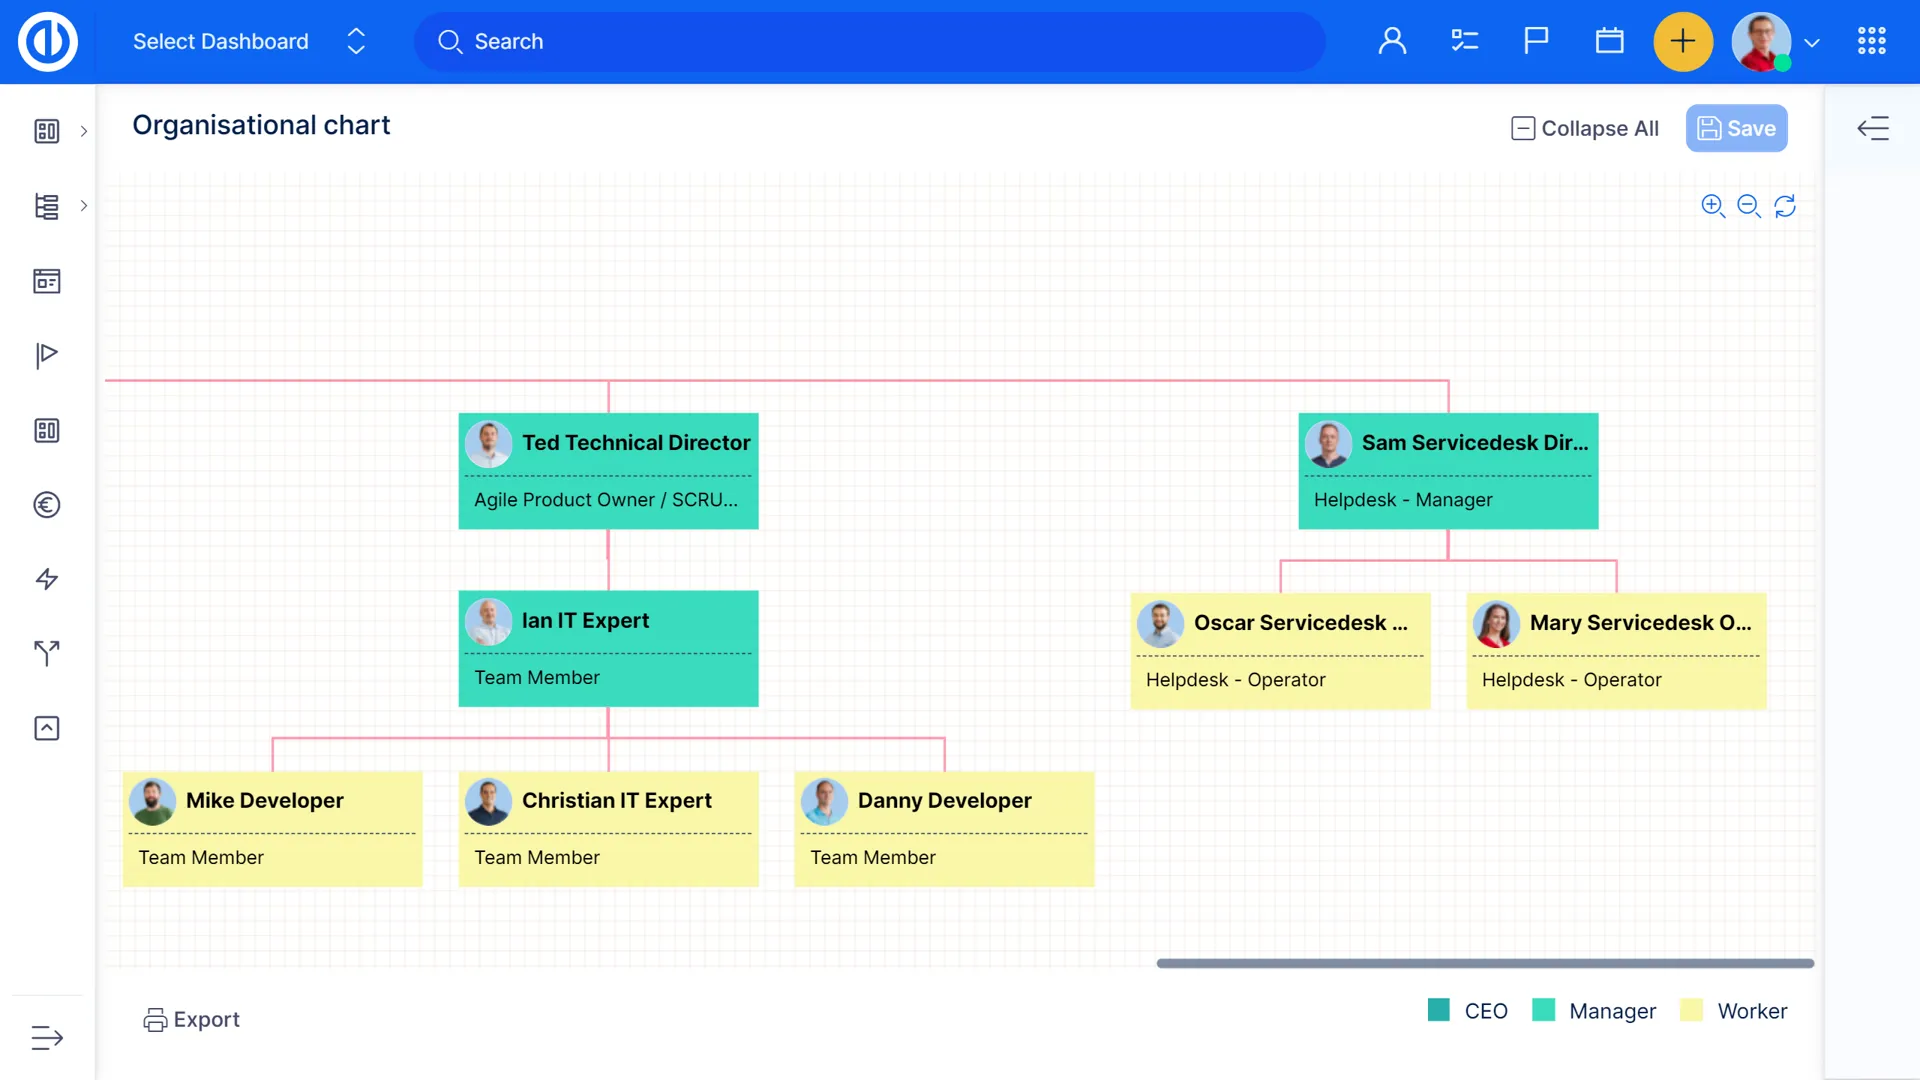
Organizational structure
Organizational structure is a form of a tree hierarchy where every user in the organization, except the top one, is subordinate to a single another user. This arrangement helps define how activities such as task allocation, coordination, and supervision are standardly directed toward the achievement of organizational aims. It also determines who is eligible to approve vacation requests submitted by users.

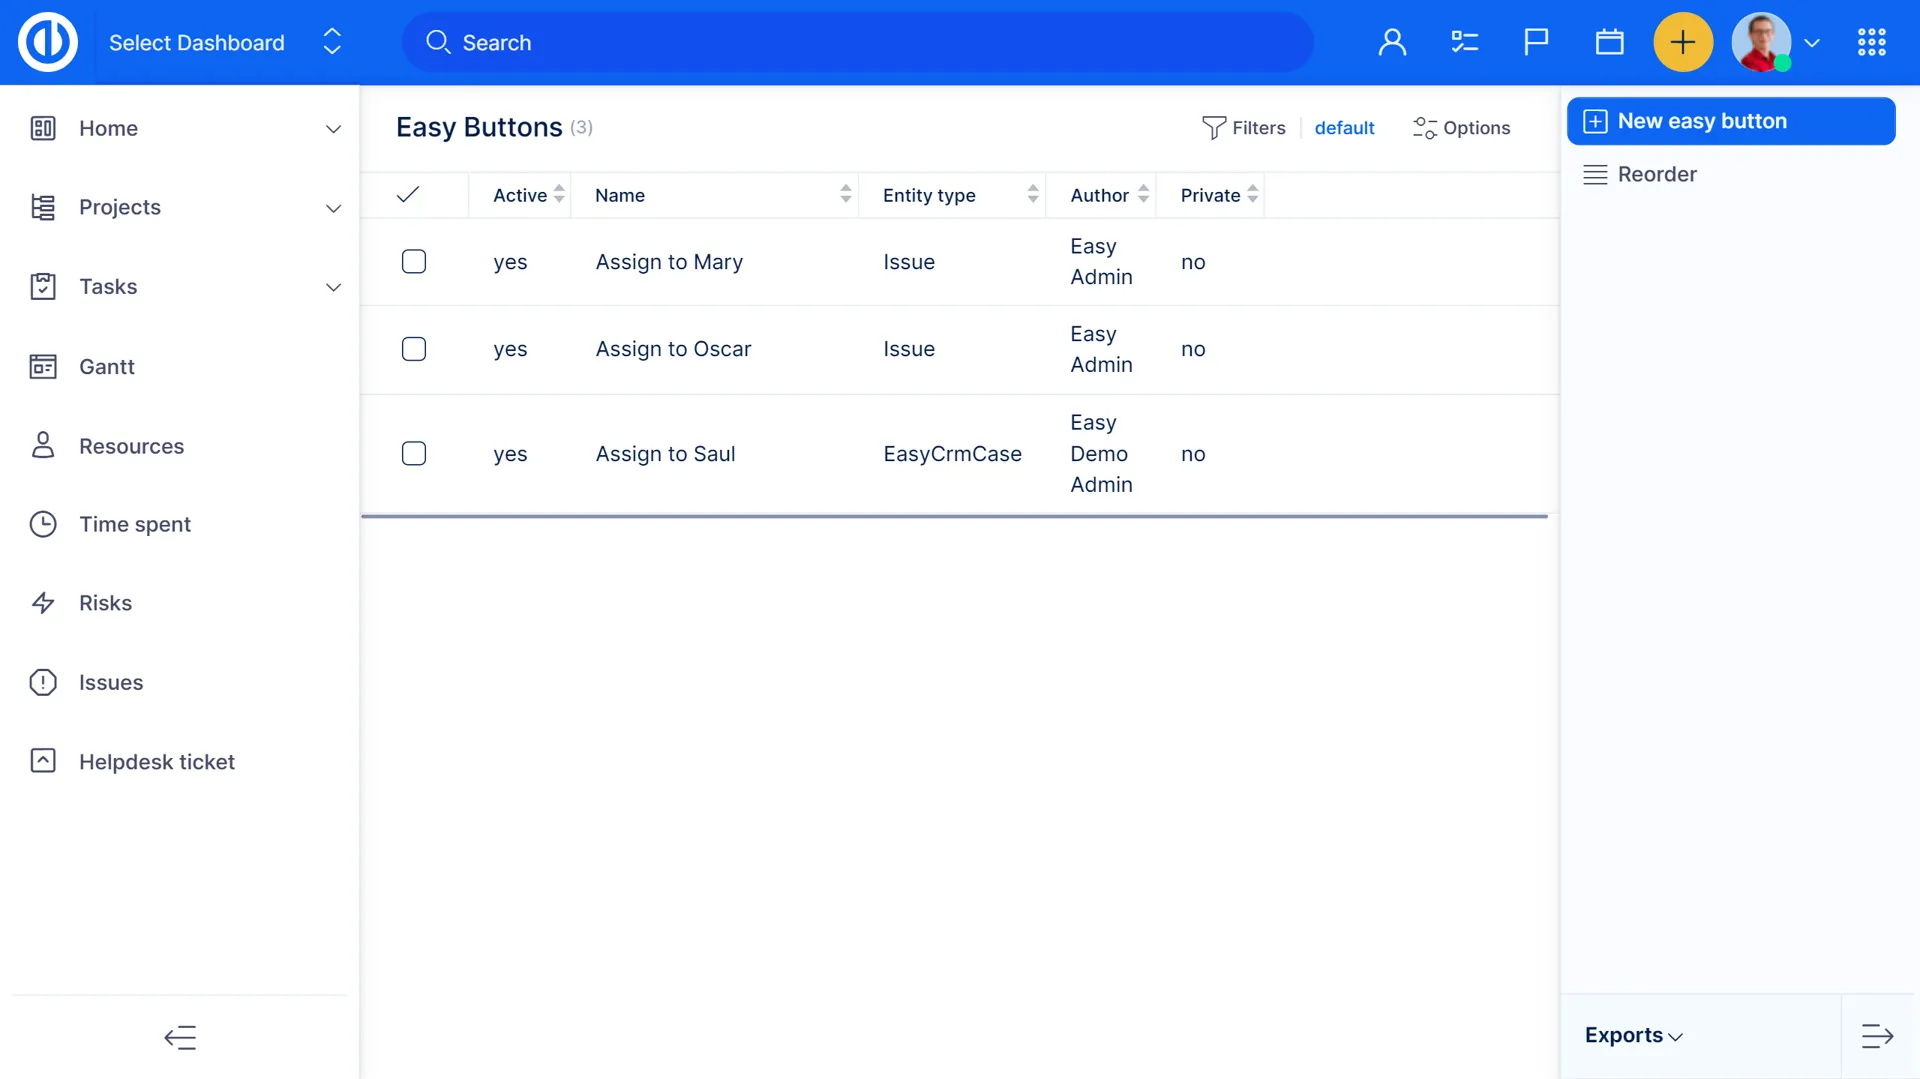
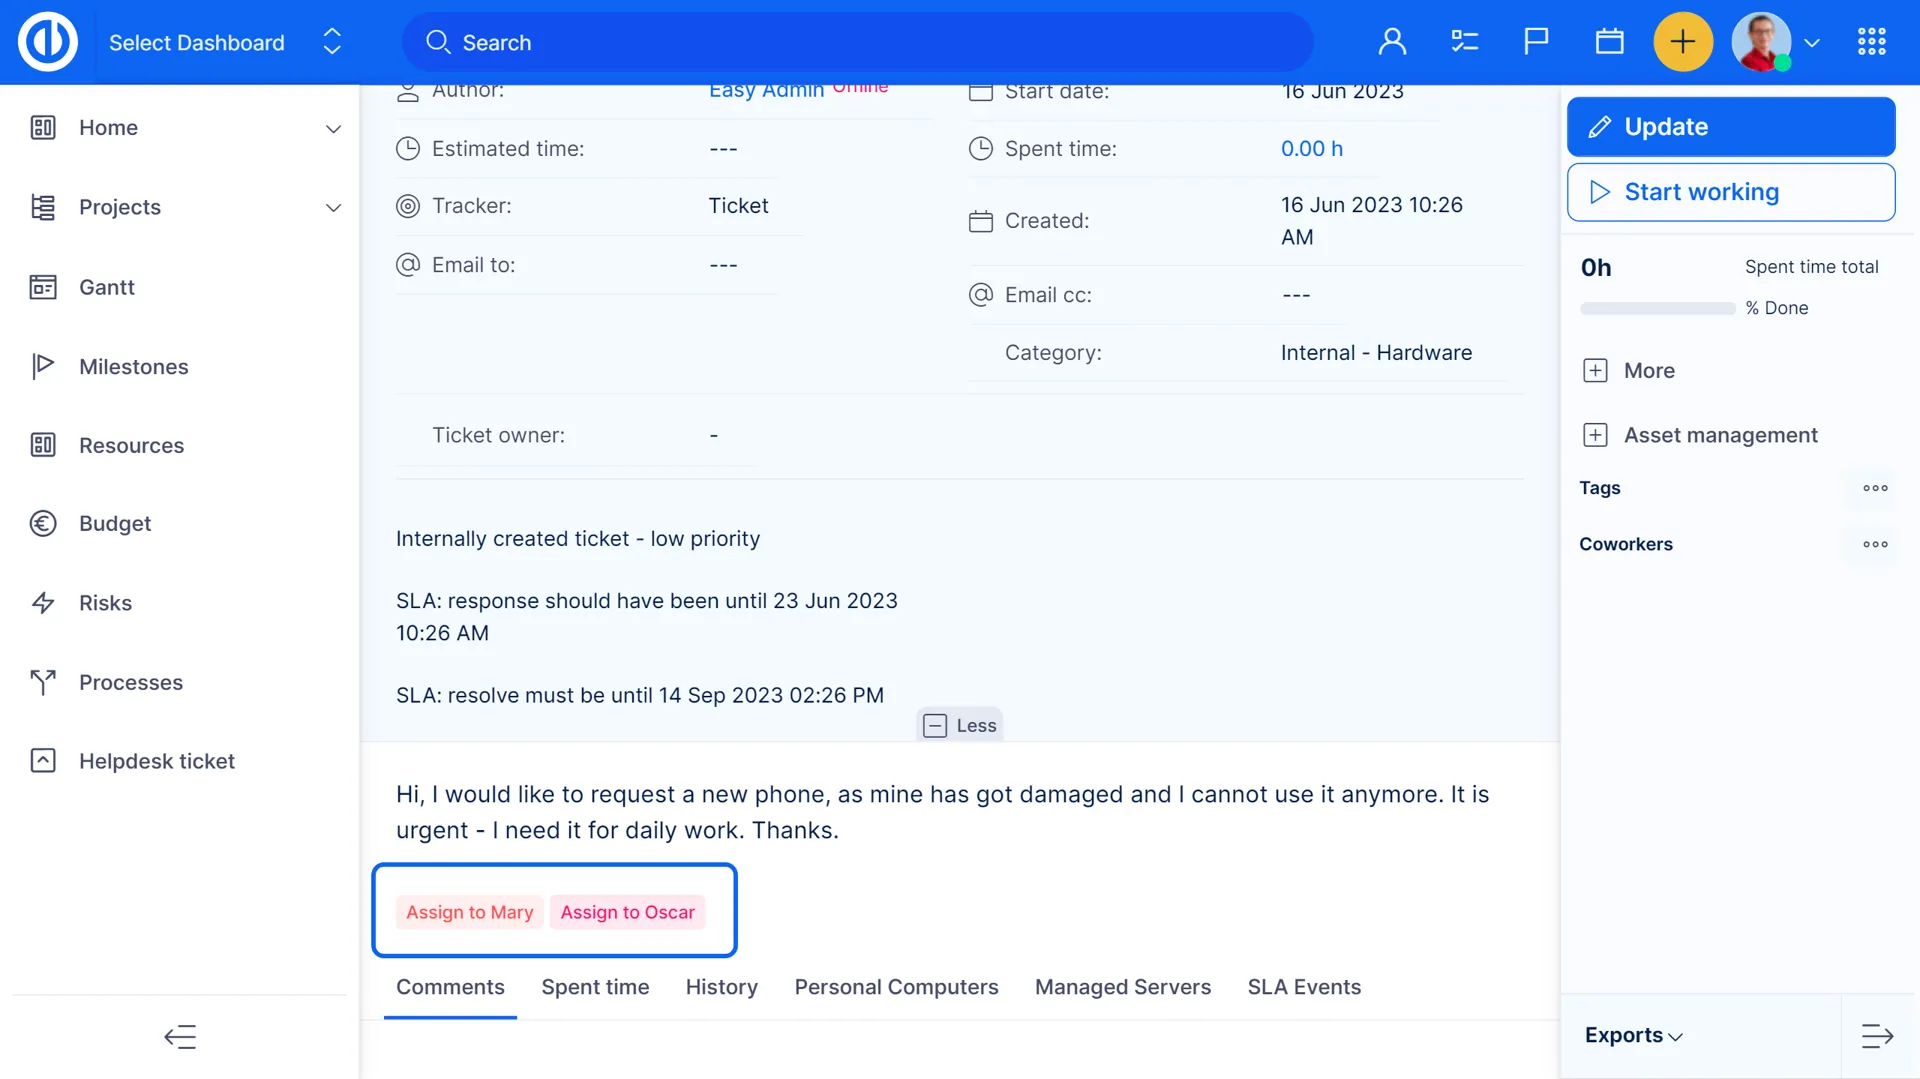
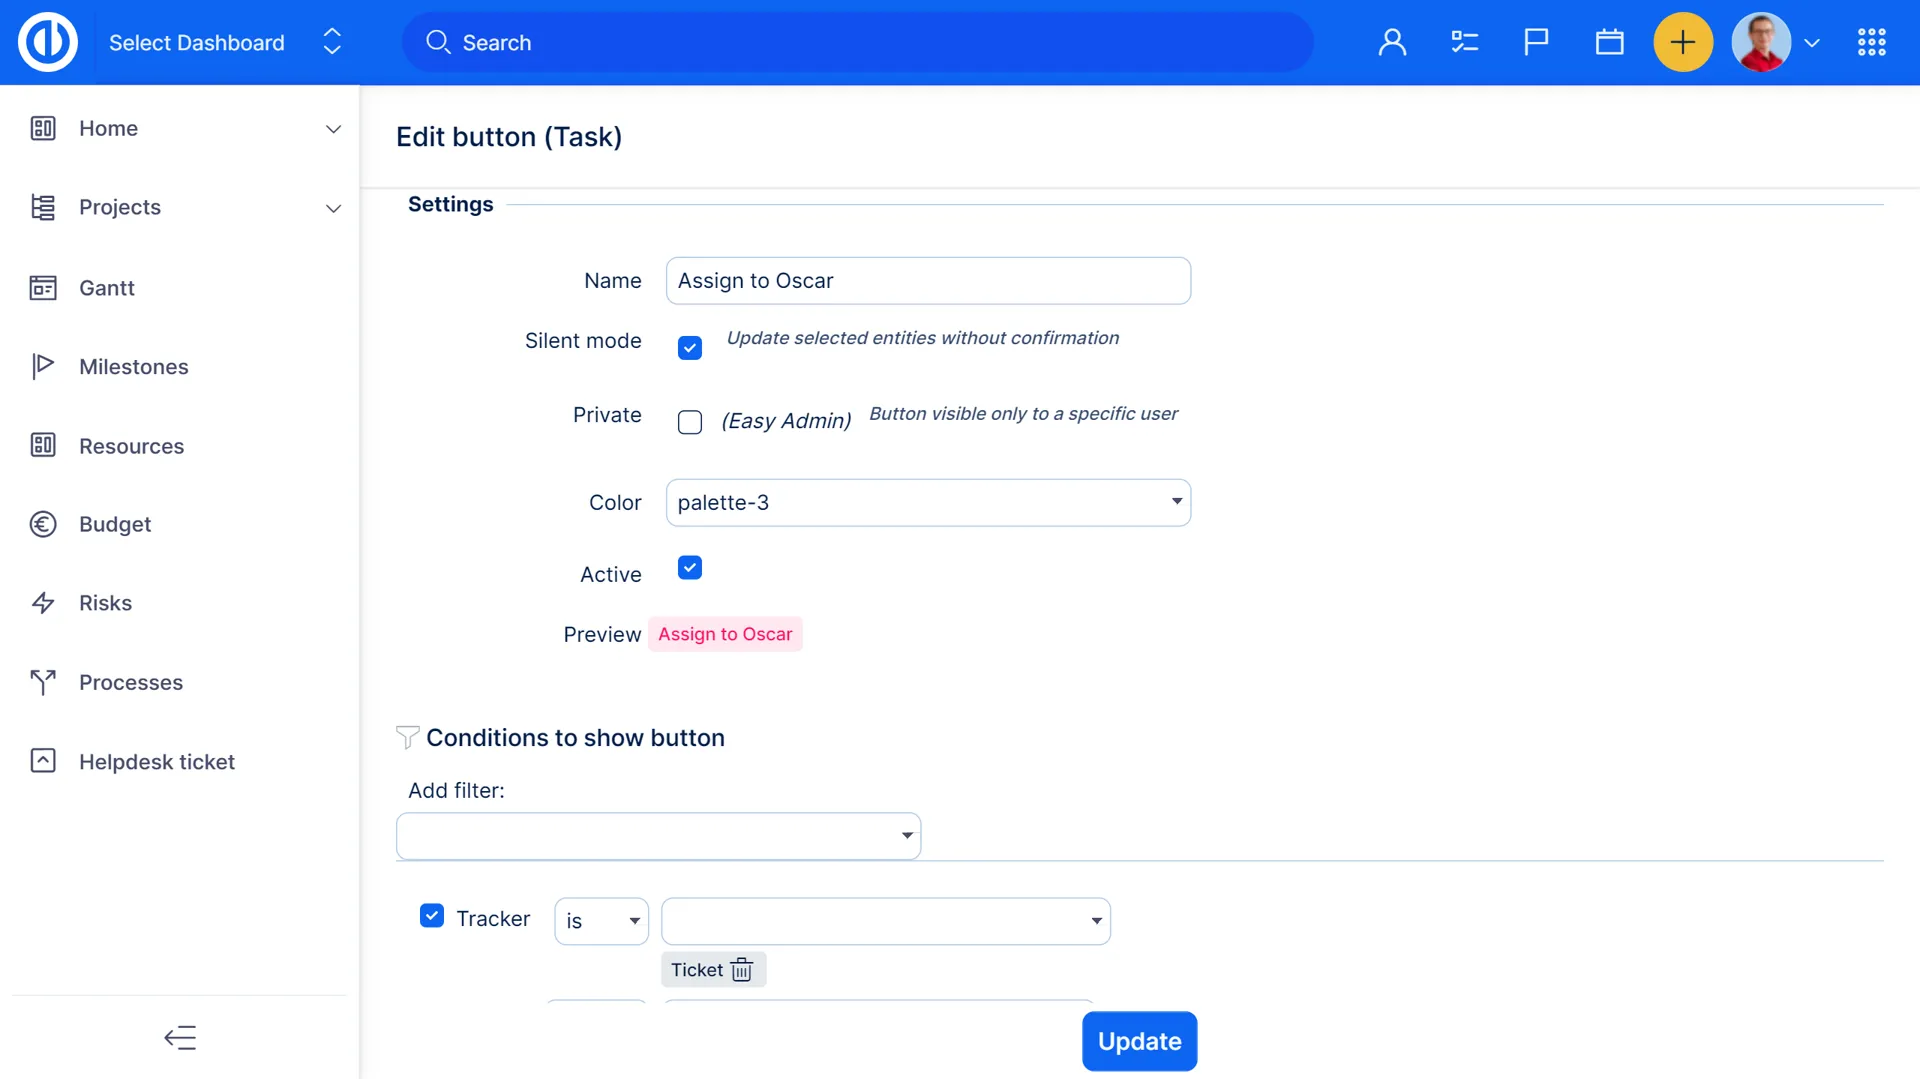
Action buttons
The ultimate tool for quick task sorting and assignment. This feature allows managers to quickly assign tasks from the pool. Action buttons are set to update tasks according to the pre-set configuration. Action buttons are highly customizable and easy to create.

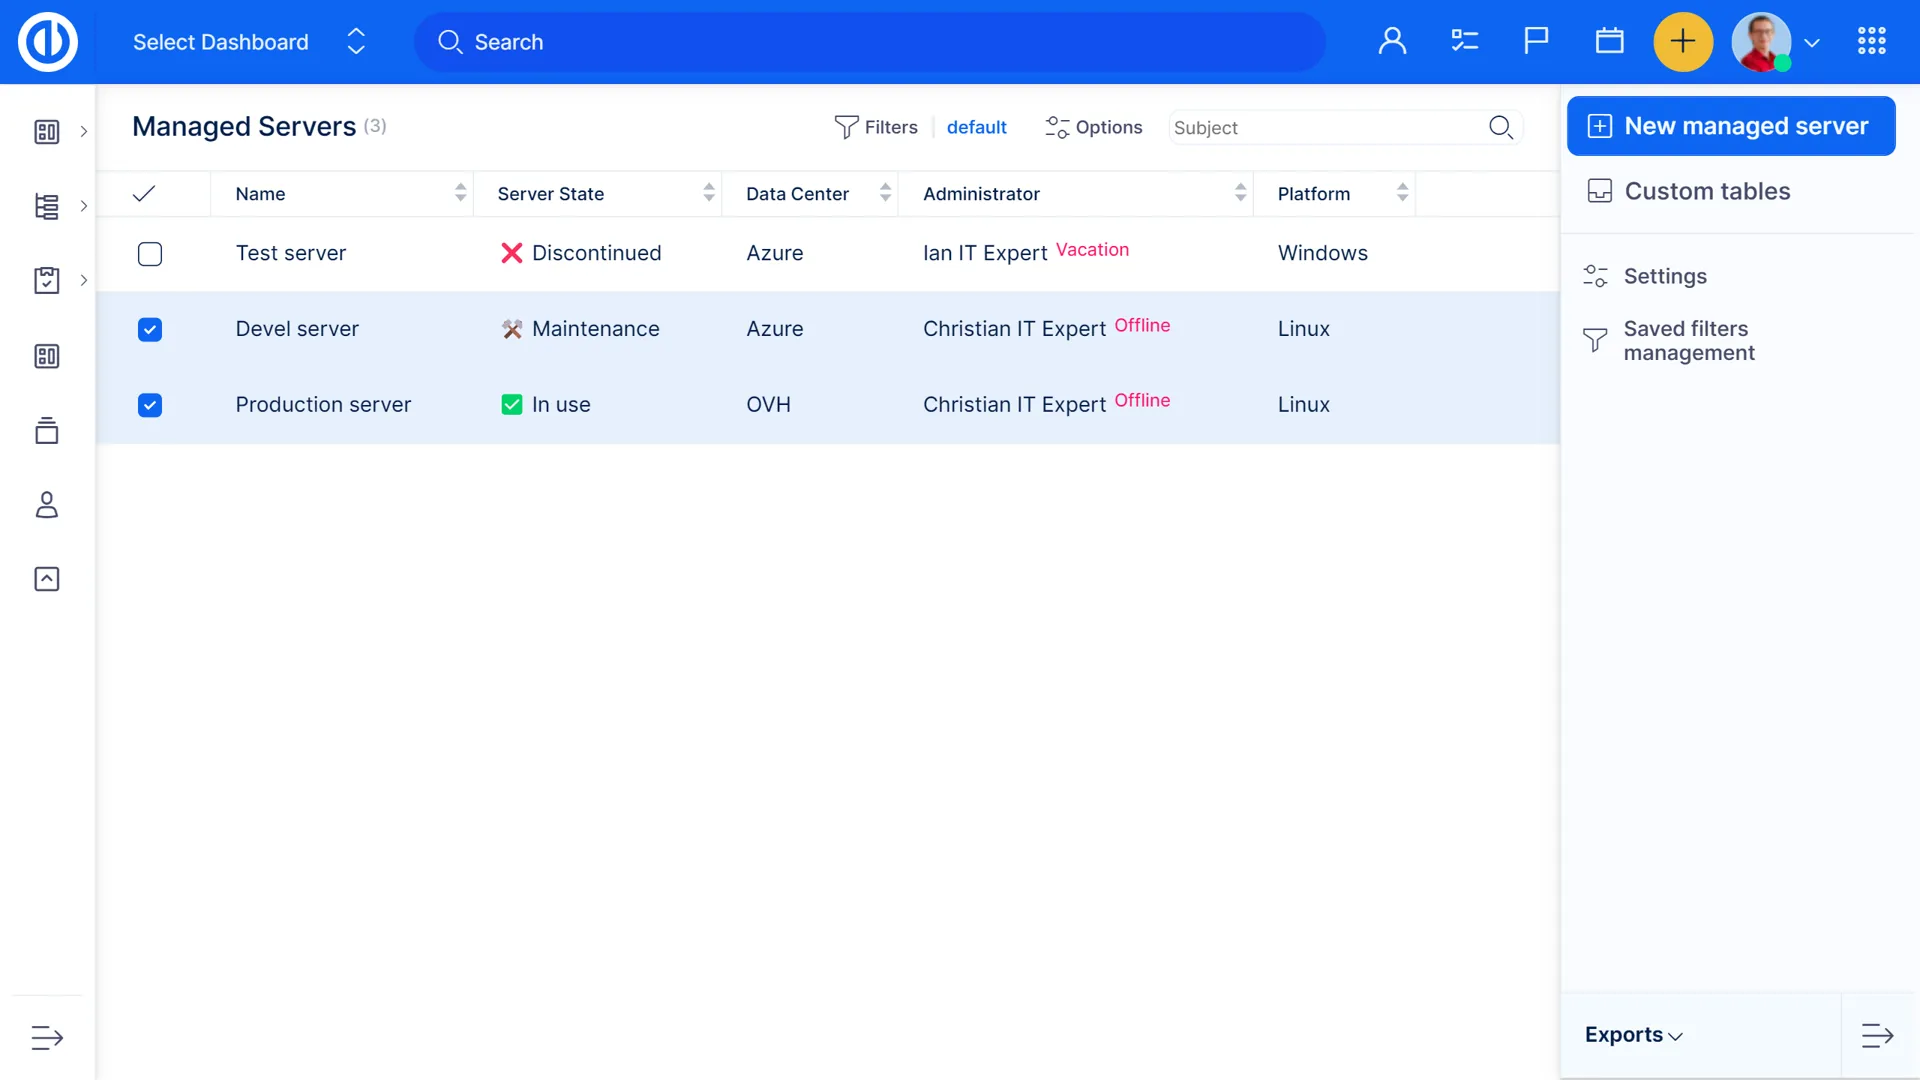
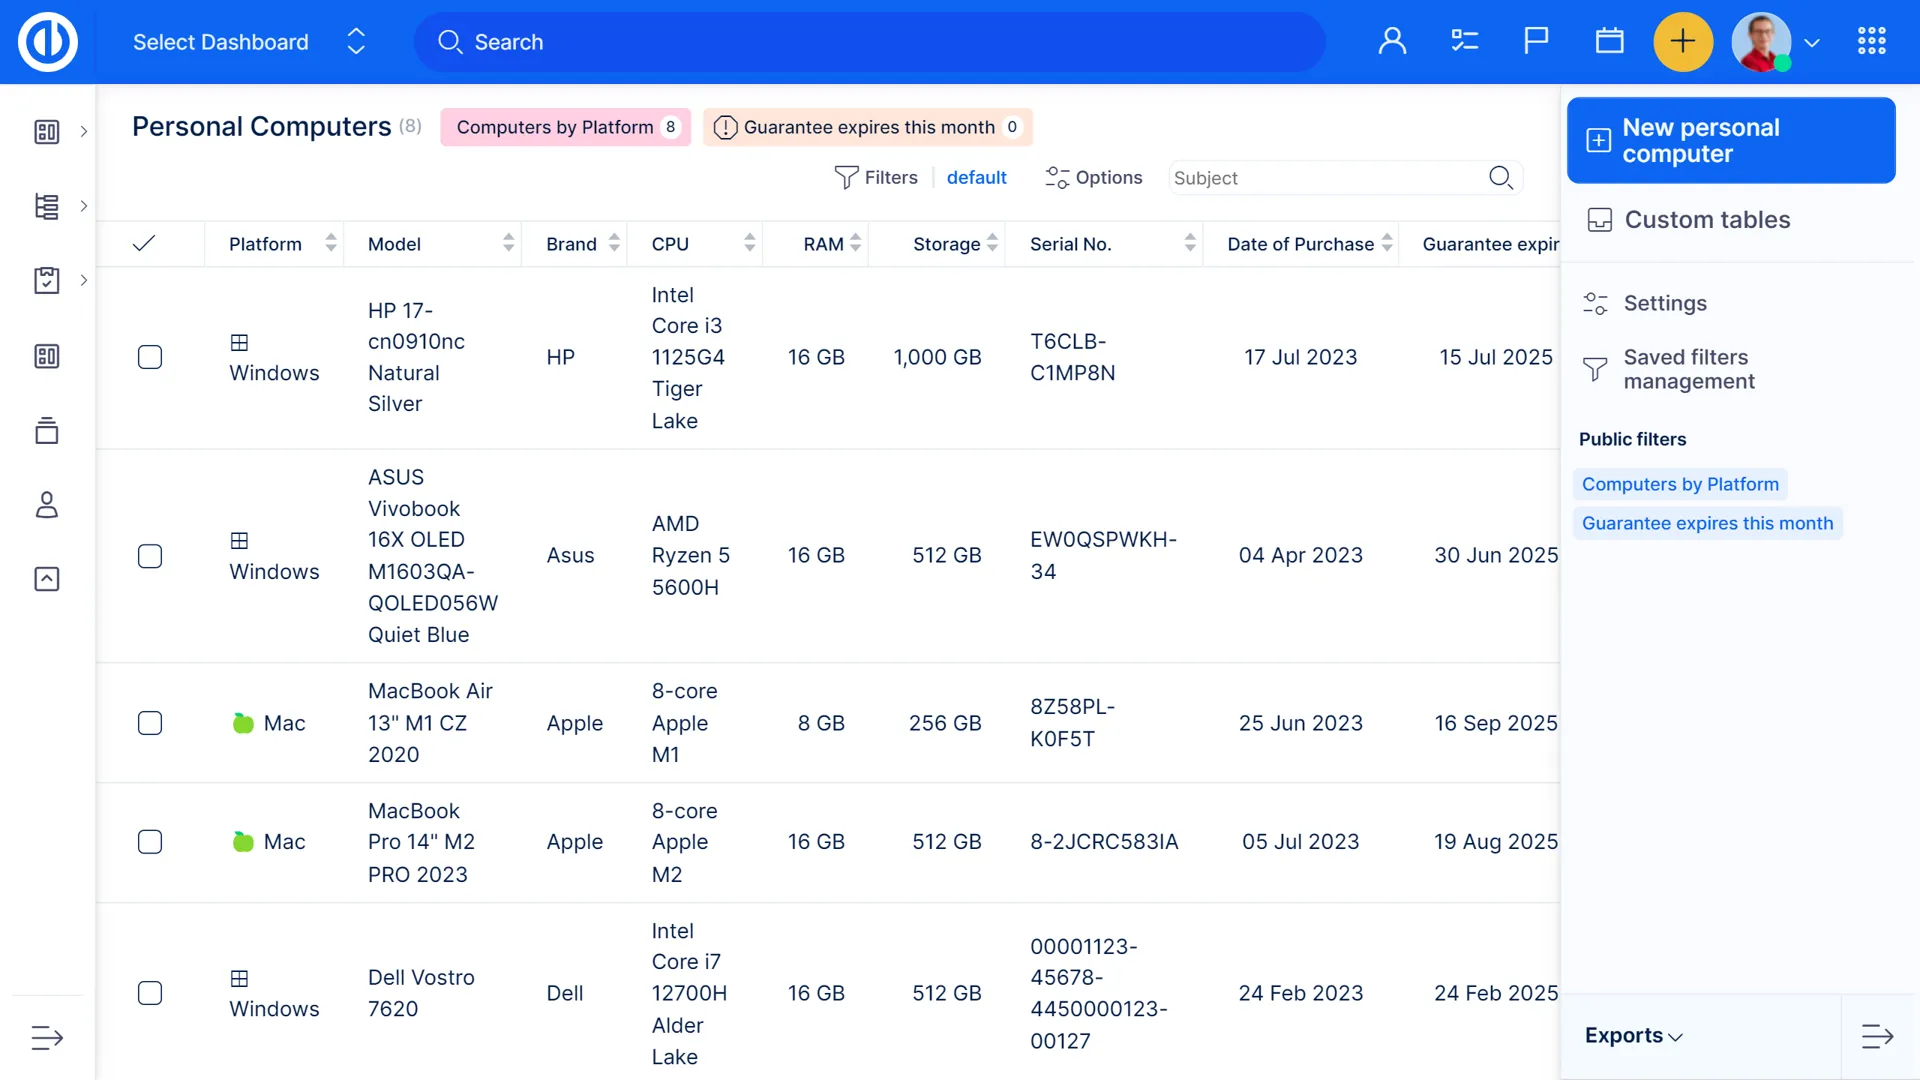
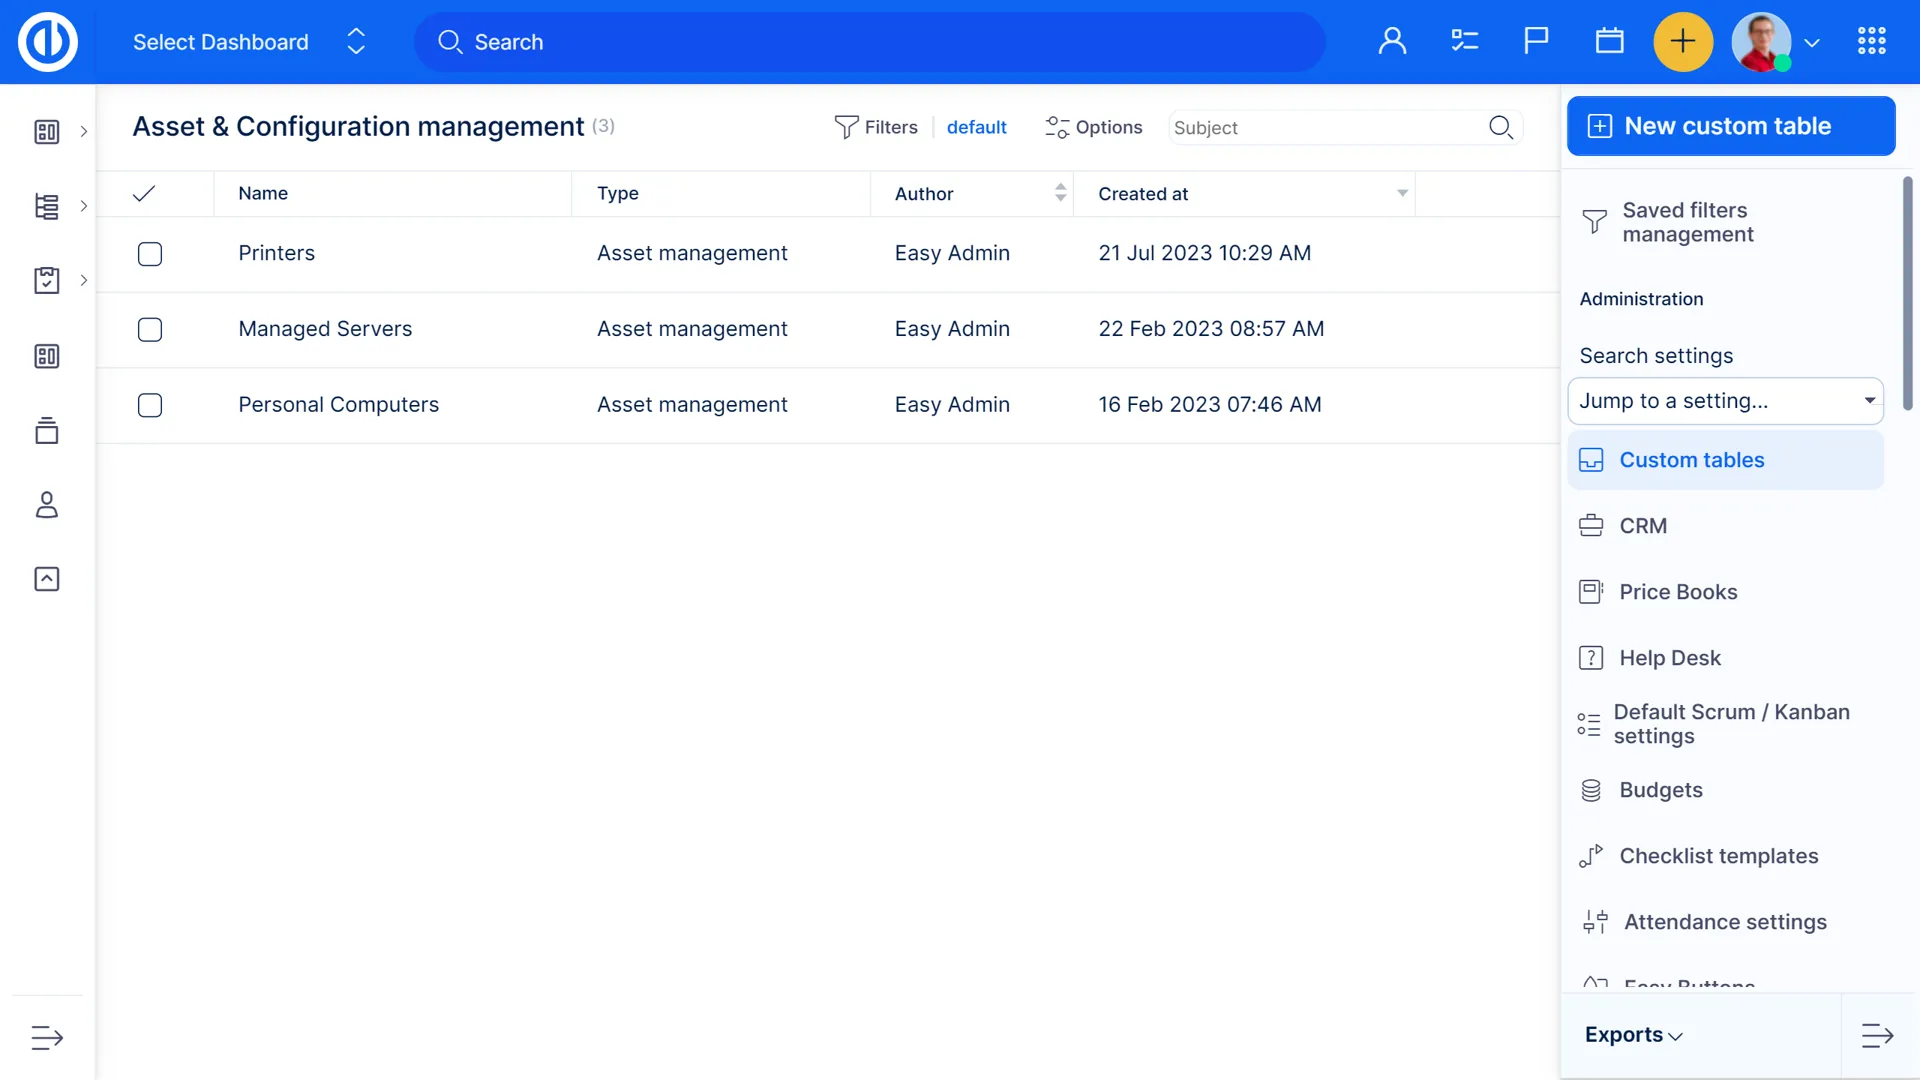
Asset & Configuration Management
Manage your assets and configurations effortlessly with Easy Project's Asset & Configuration Management tool. This powerful feature integrates seamlessly with Easy Project, presenting your data in an intuitive directory structure. Tailor the system to your needs with custom fields, structures, filters, and views for quick access and use. Link assets to any entity, control access through permissions and oversee everything from one central point. With this tool, you'll keep your assets and configurations up-to-date and easily accessible at all times.

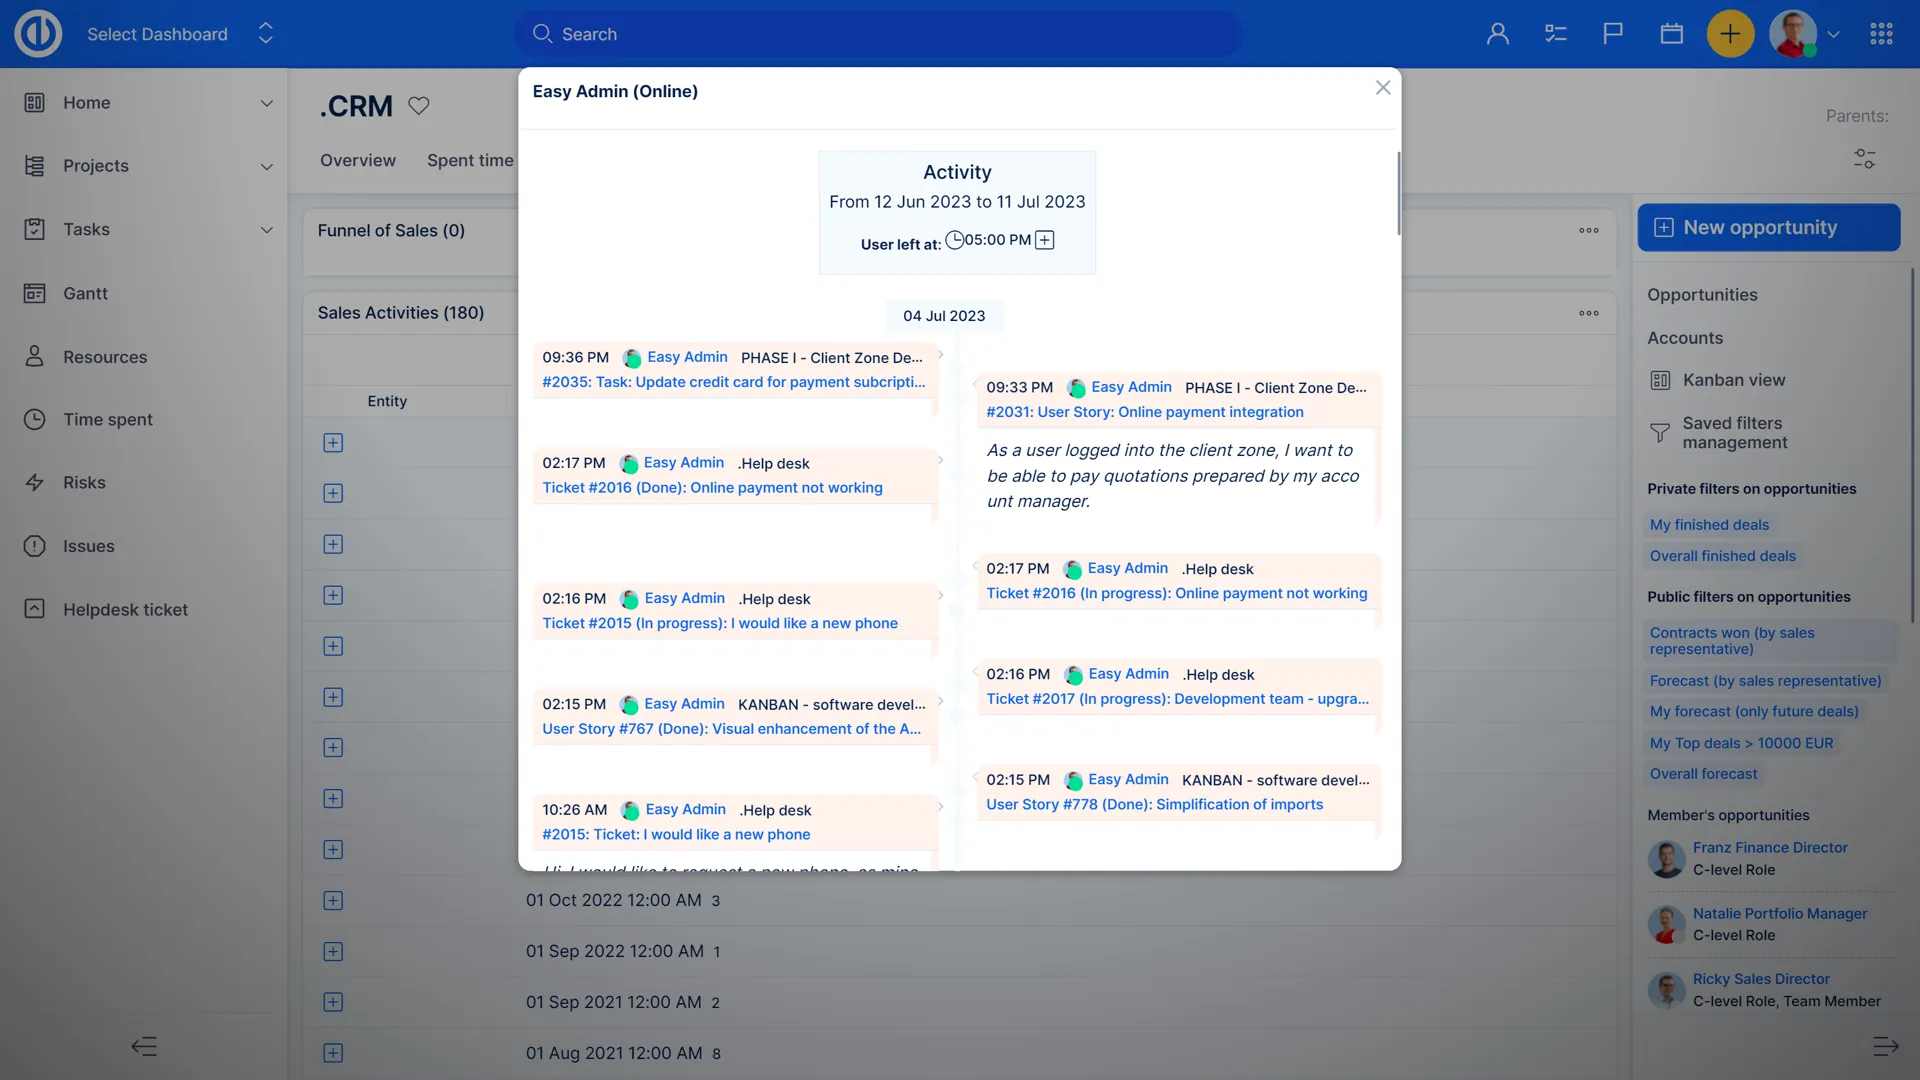
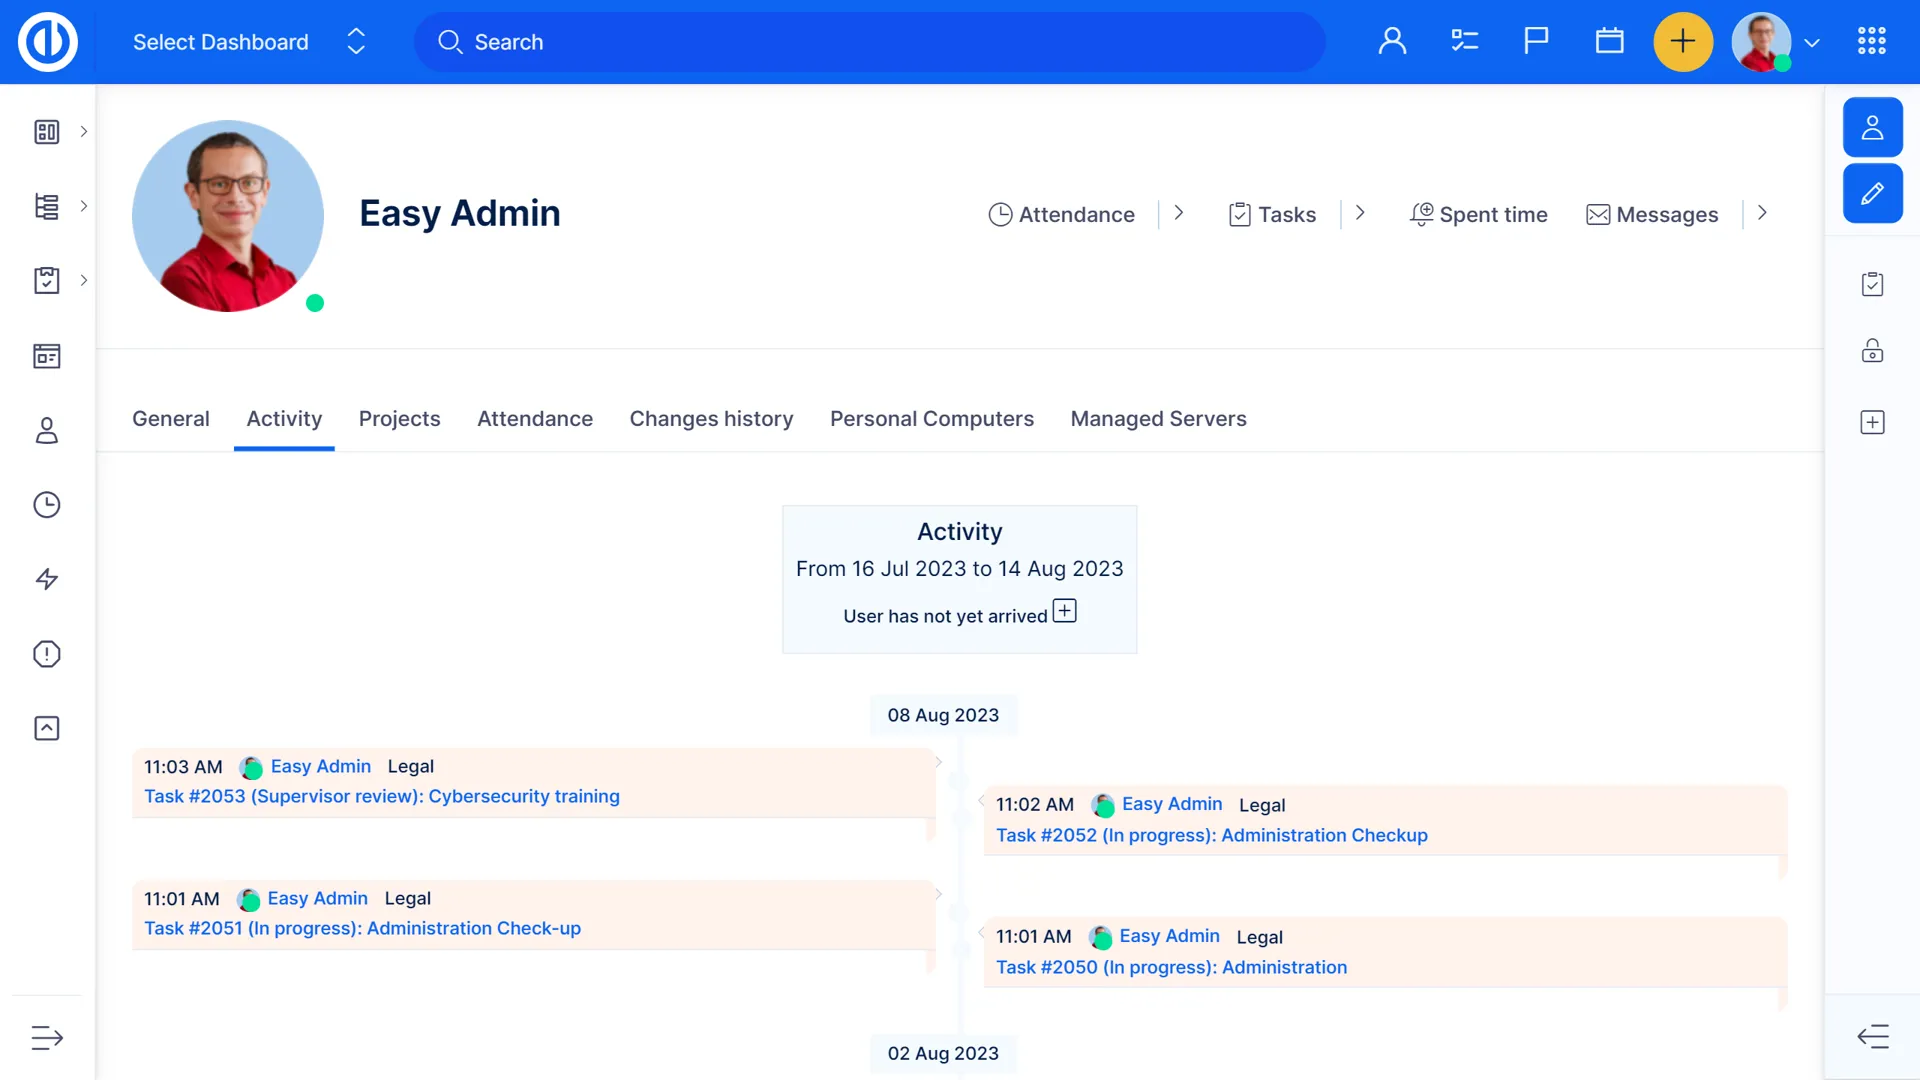
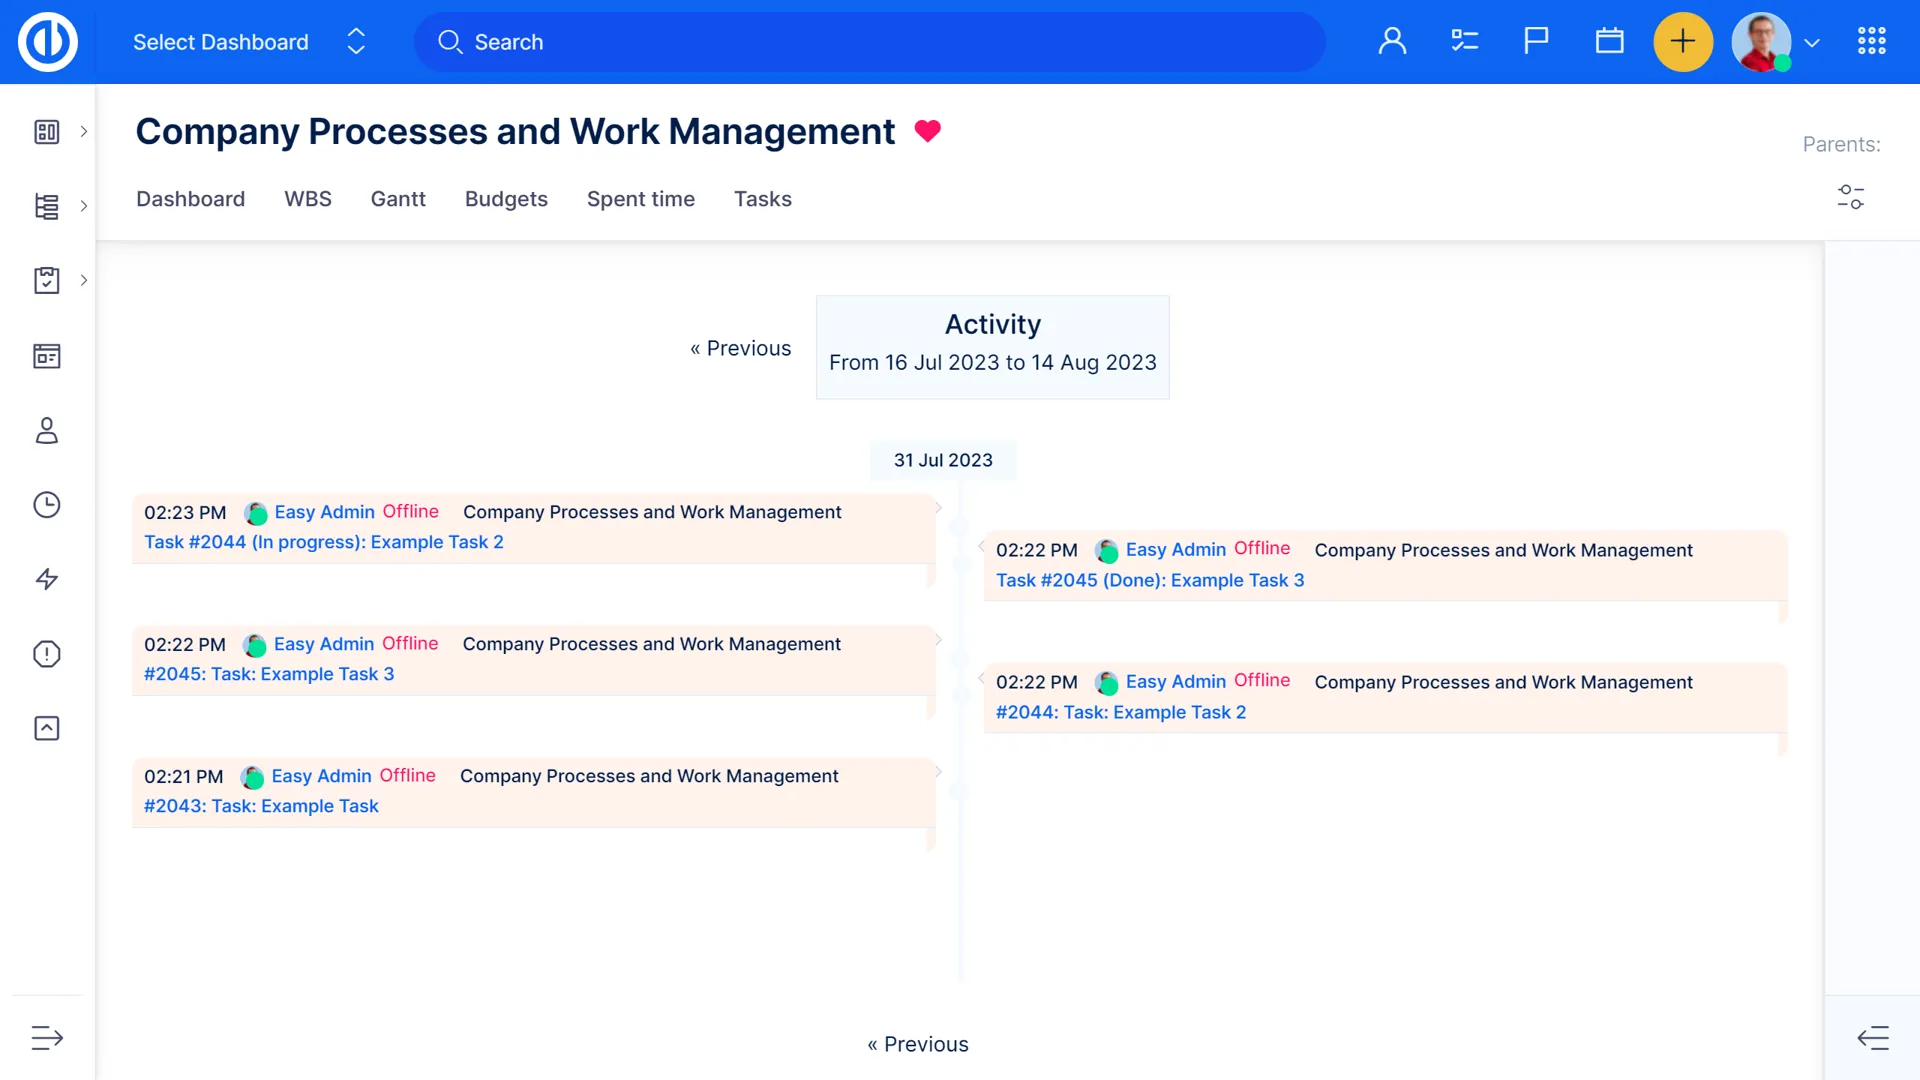
Activity Feed
An activity feed is the fastest way to find out about the latest task updates. It is always accessible on your sidebar, where you can see updated tasks and recent comments, completely eliminating the need for email notifications.

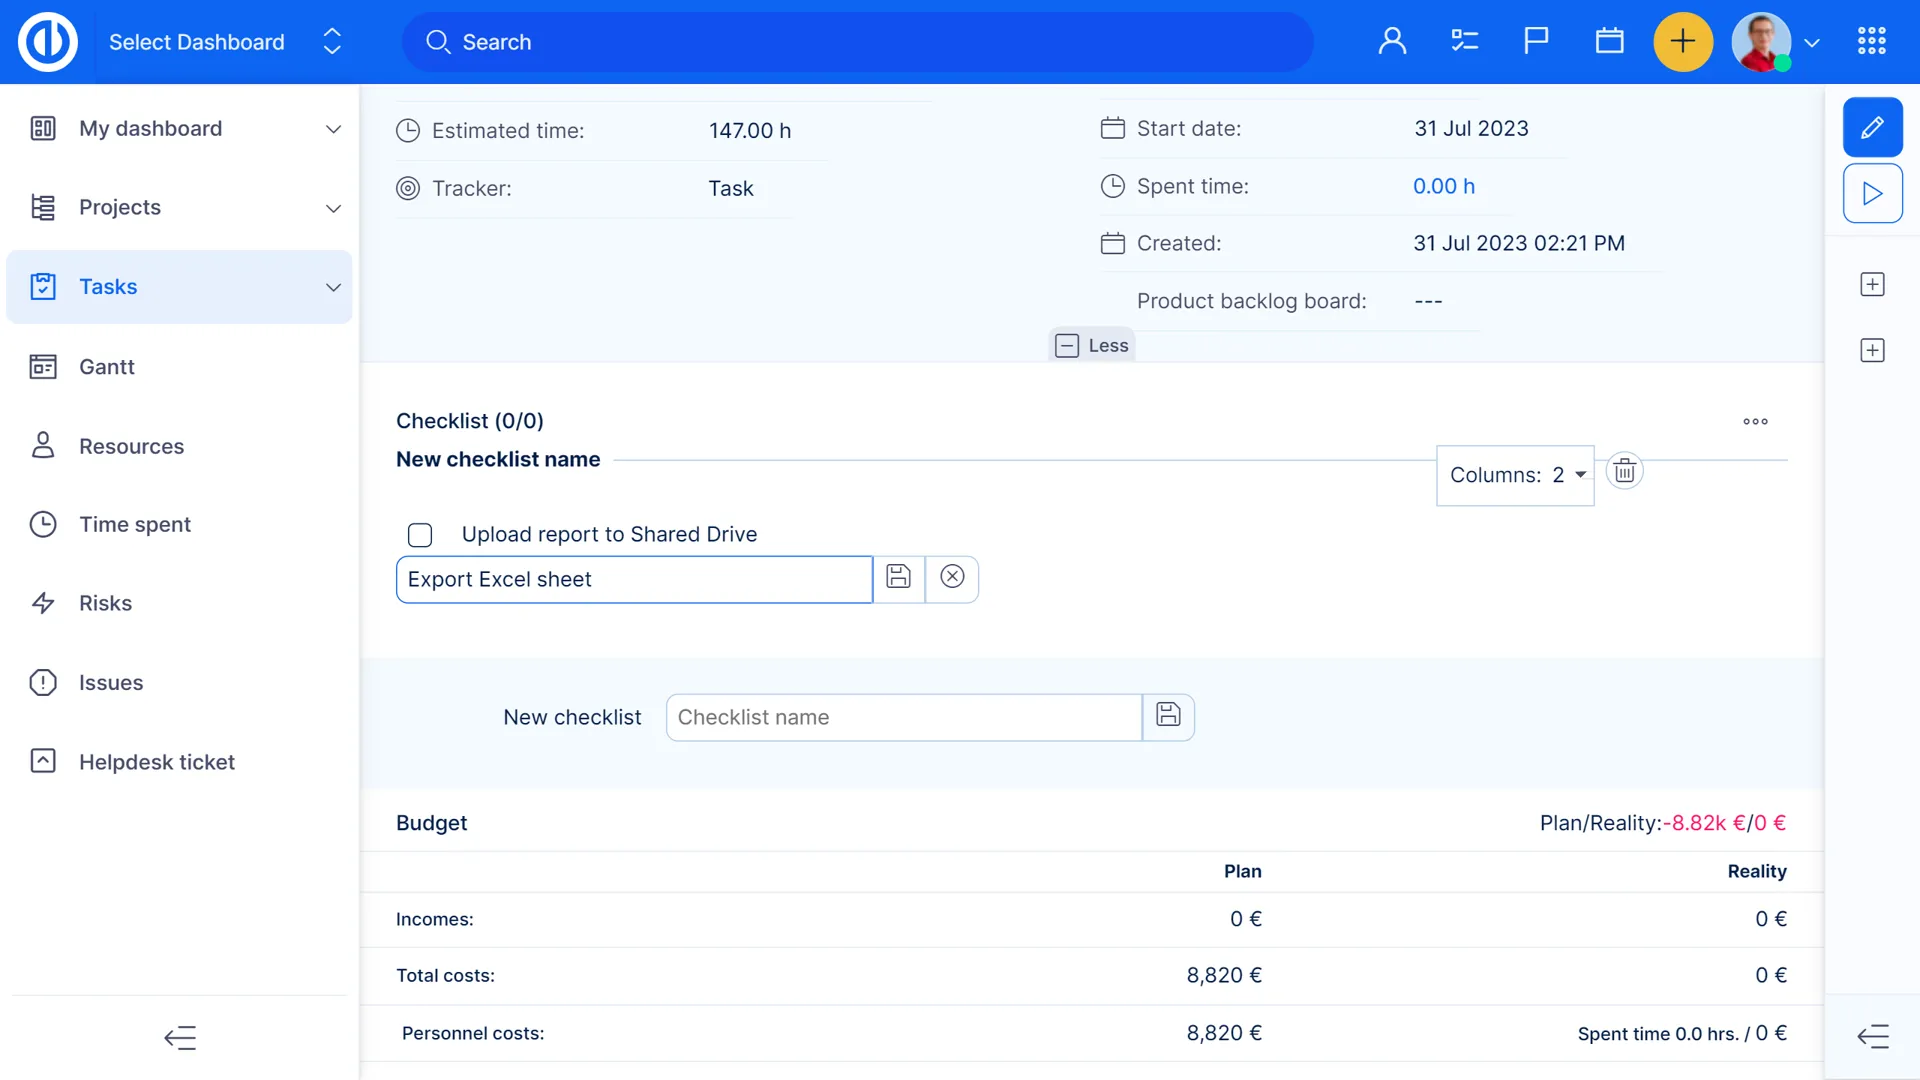
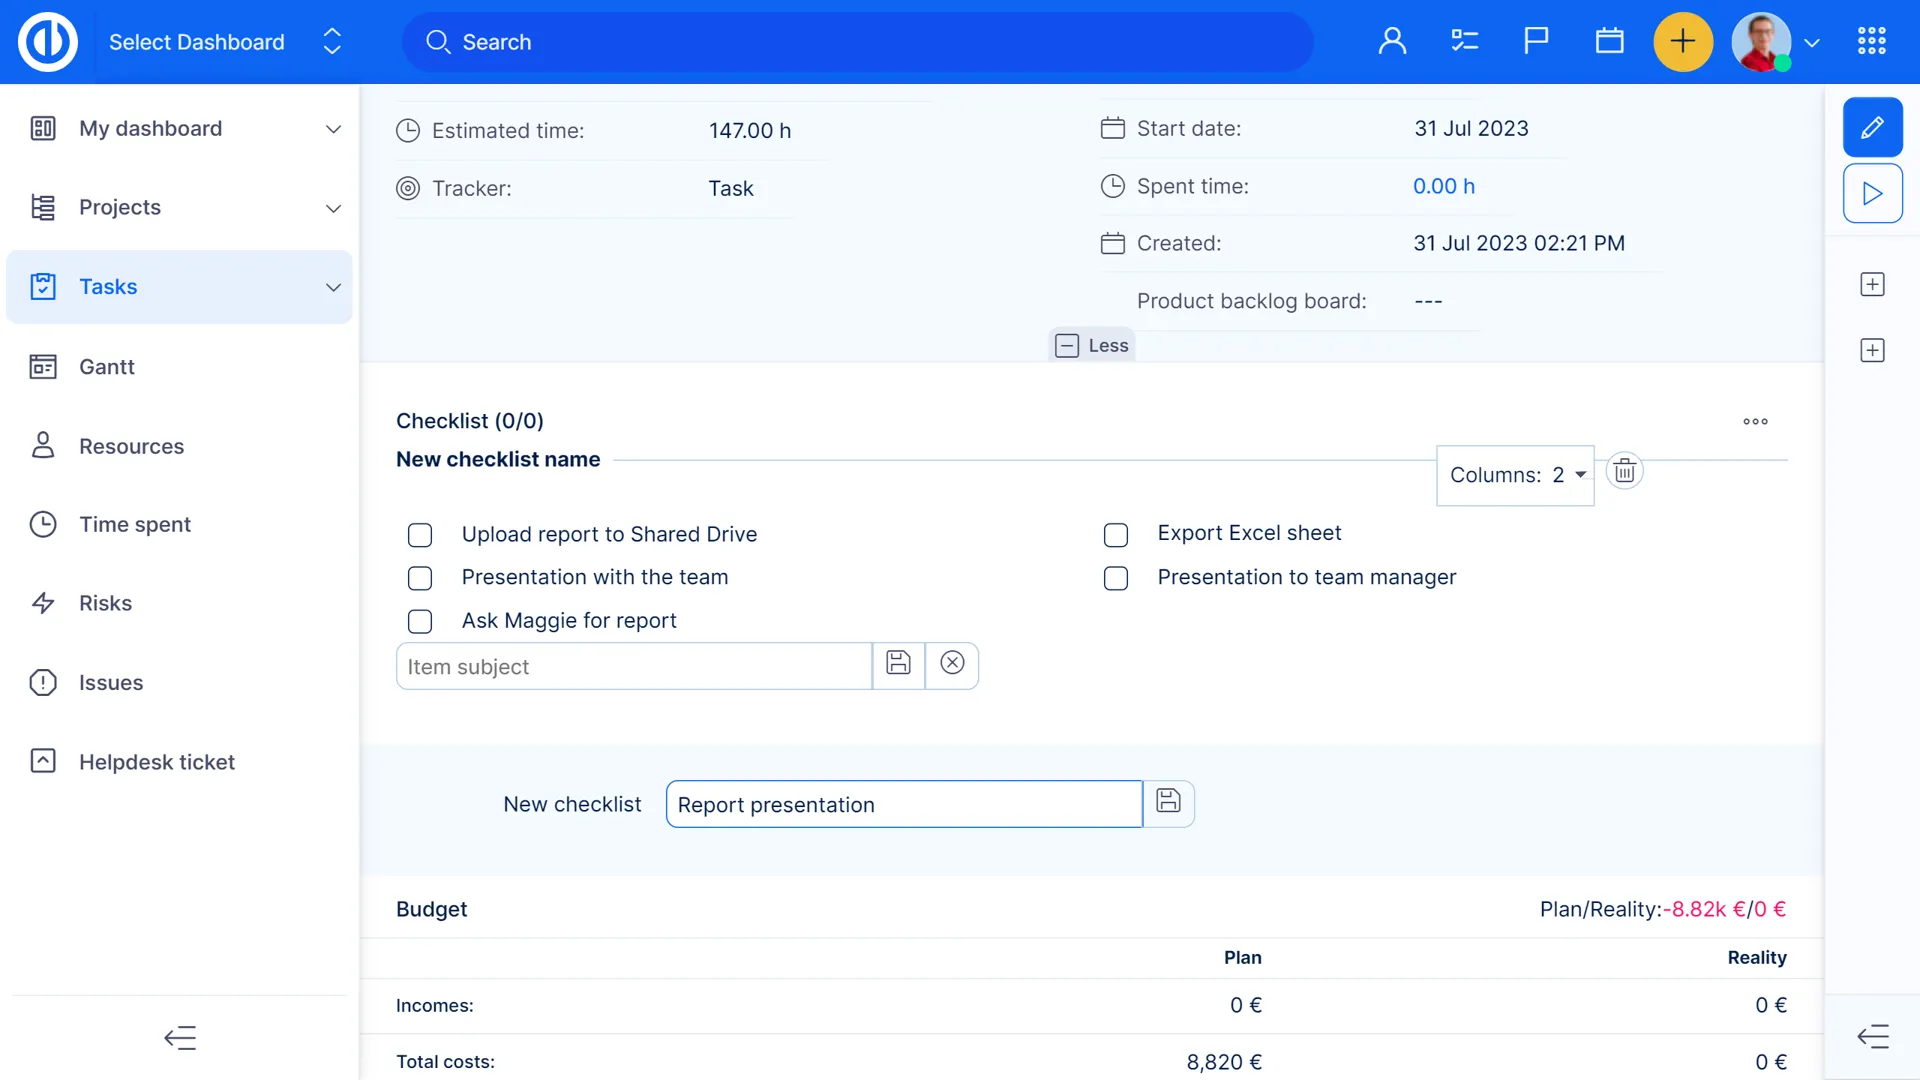
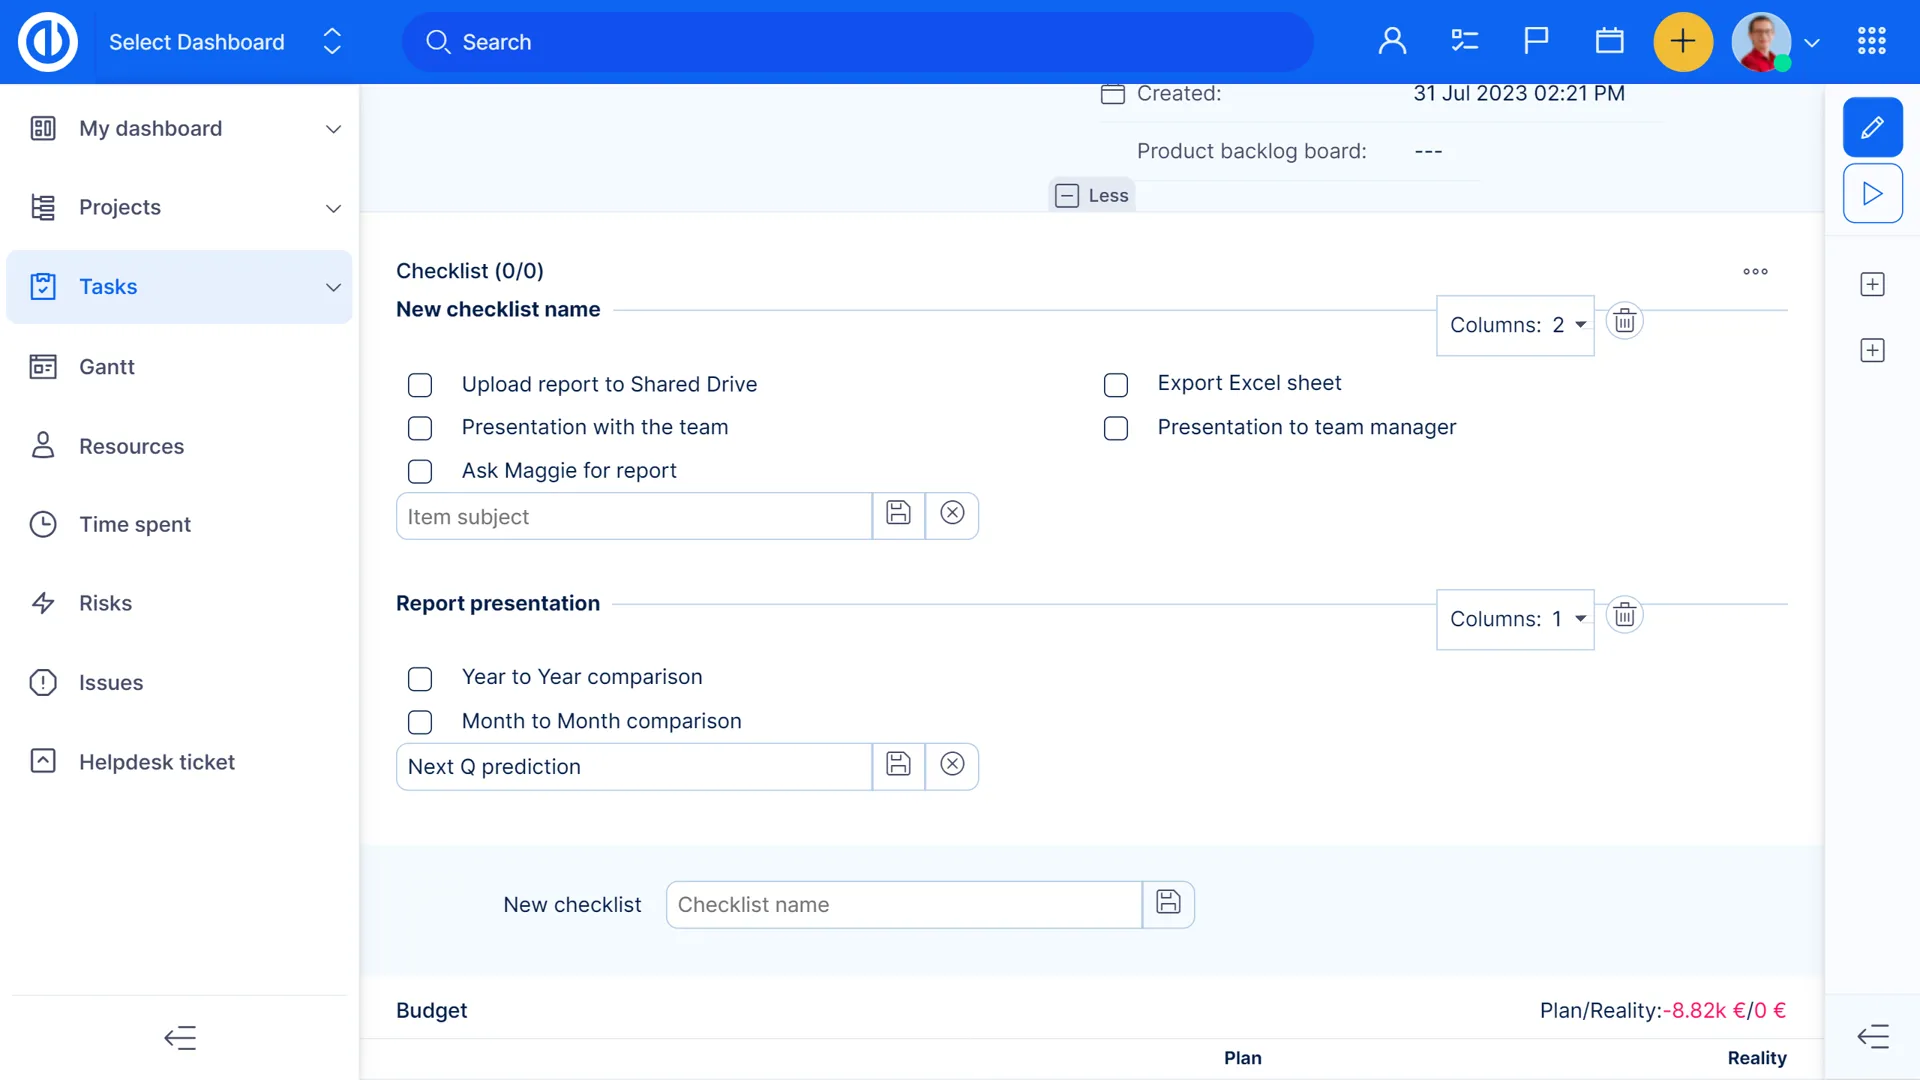
Checklists
Checklists can easily increase work organization, motivation, and productivity. They eliminate the possibility of forgetting a step and make the delivery of repetitive tasks more efficient and with fewer mistakes.
Agile Management

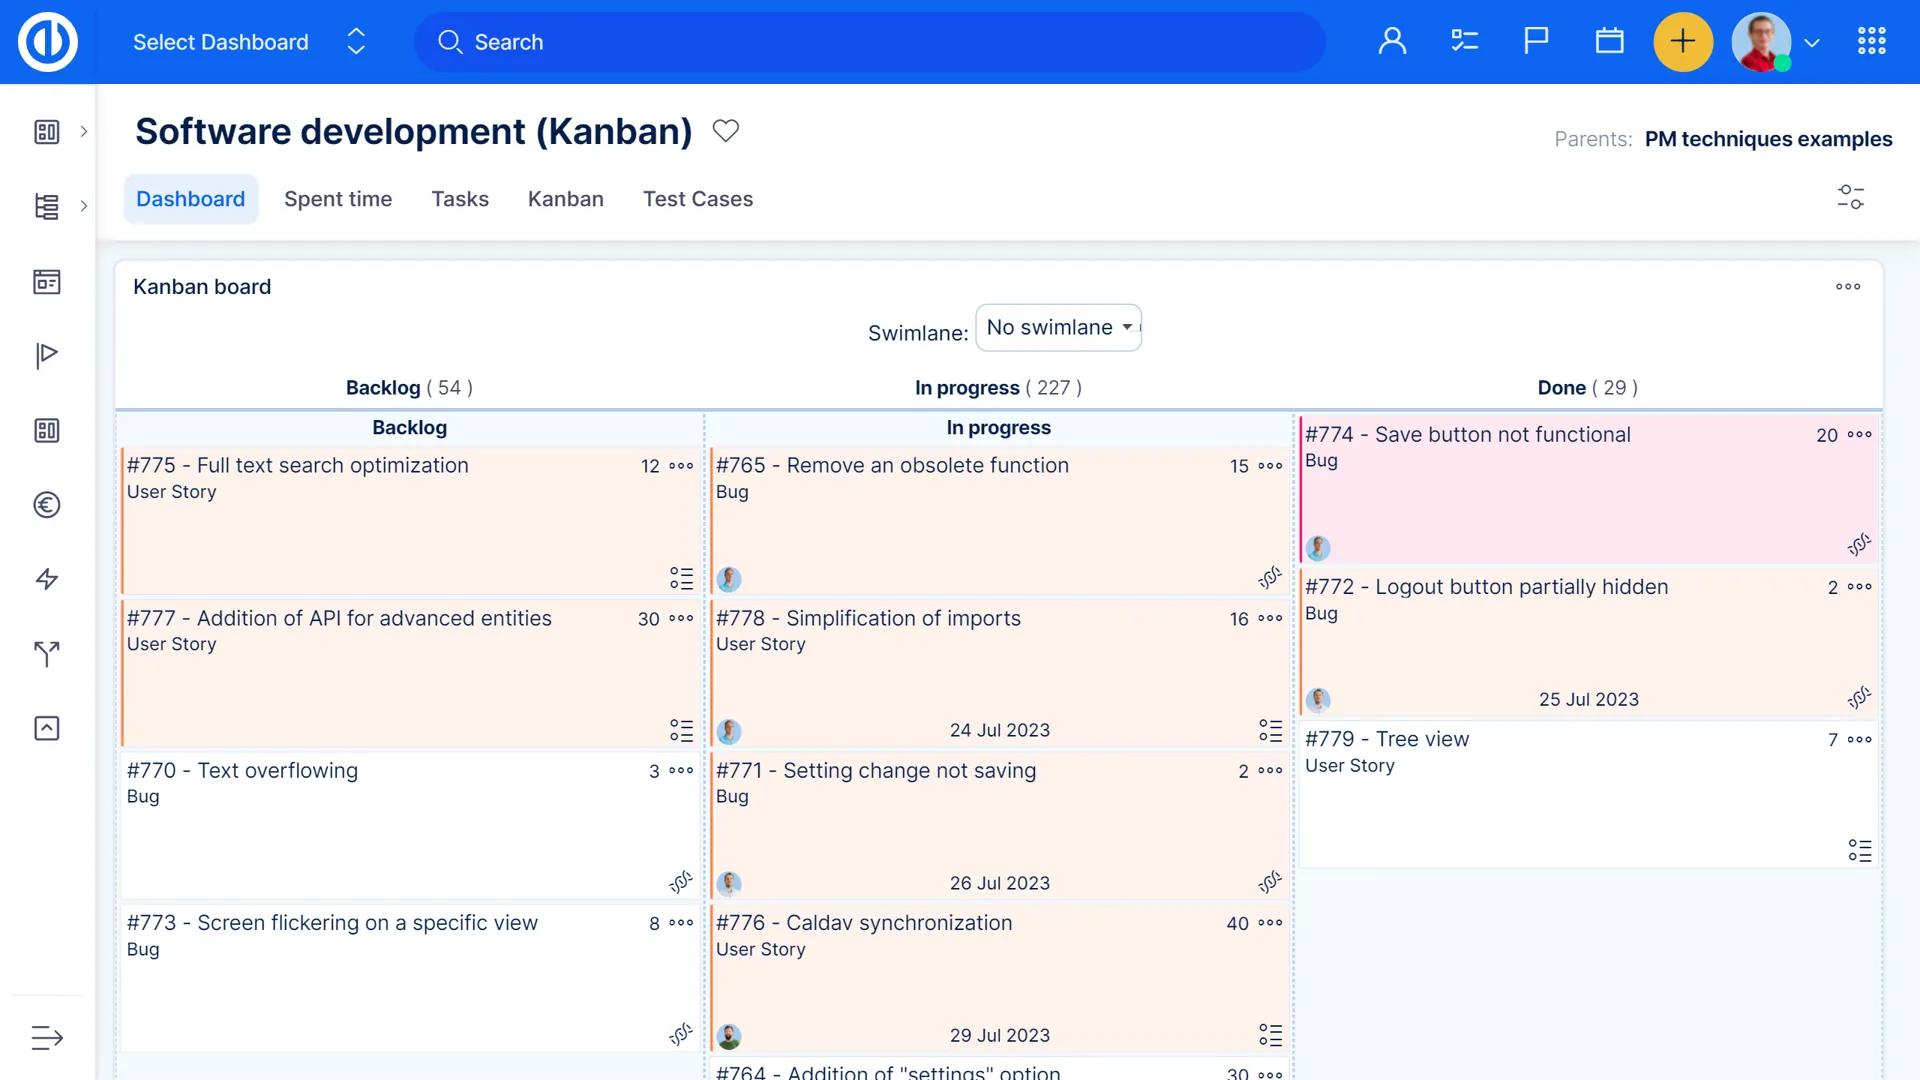
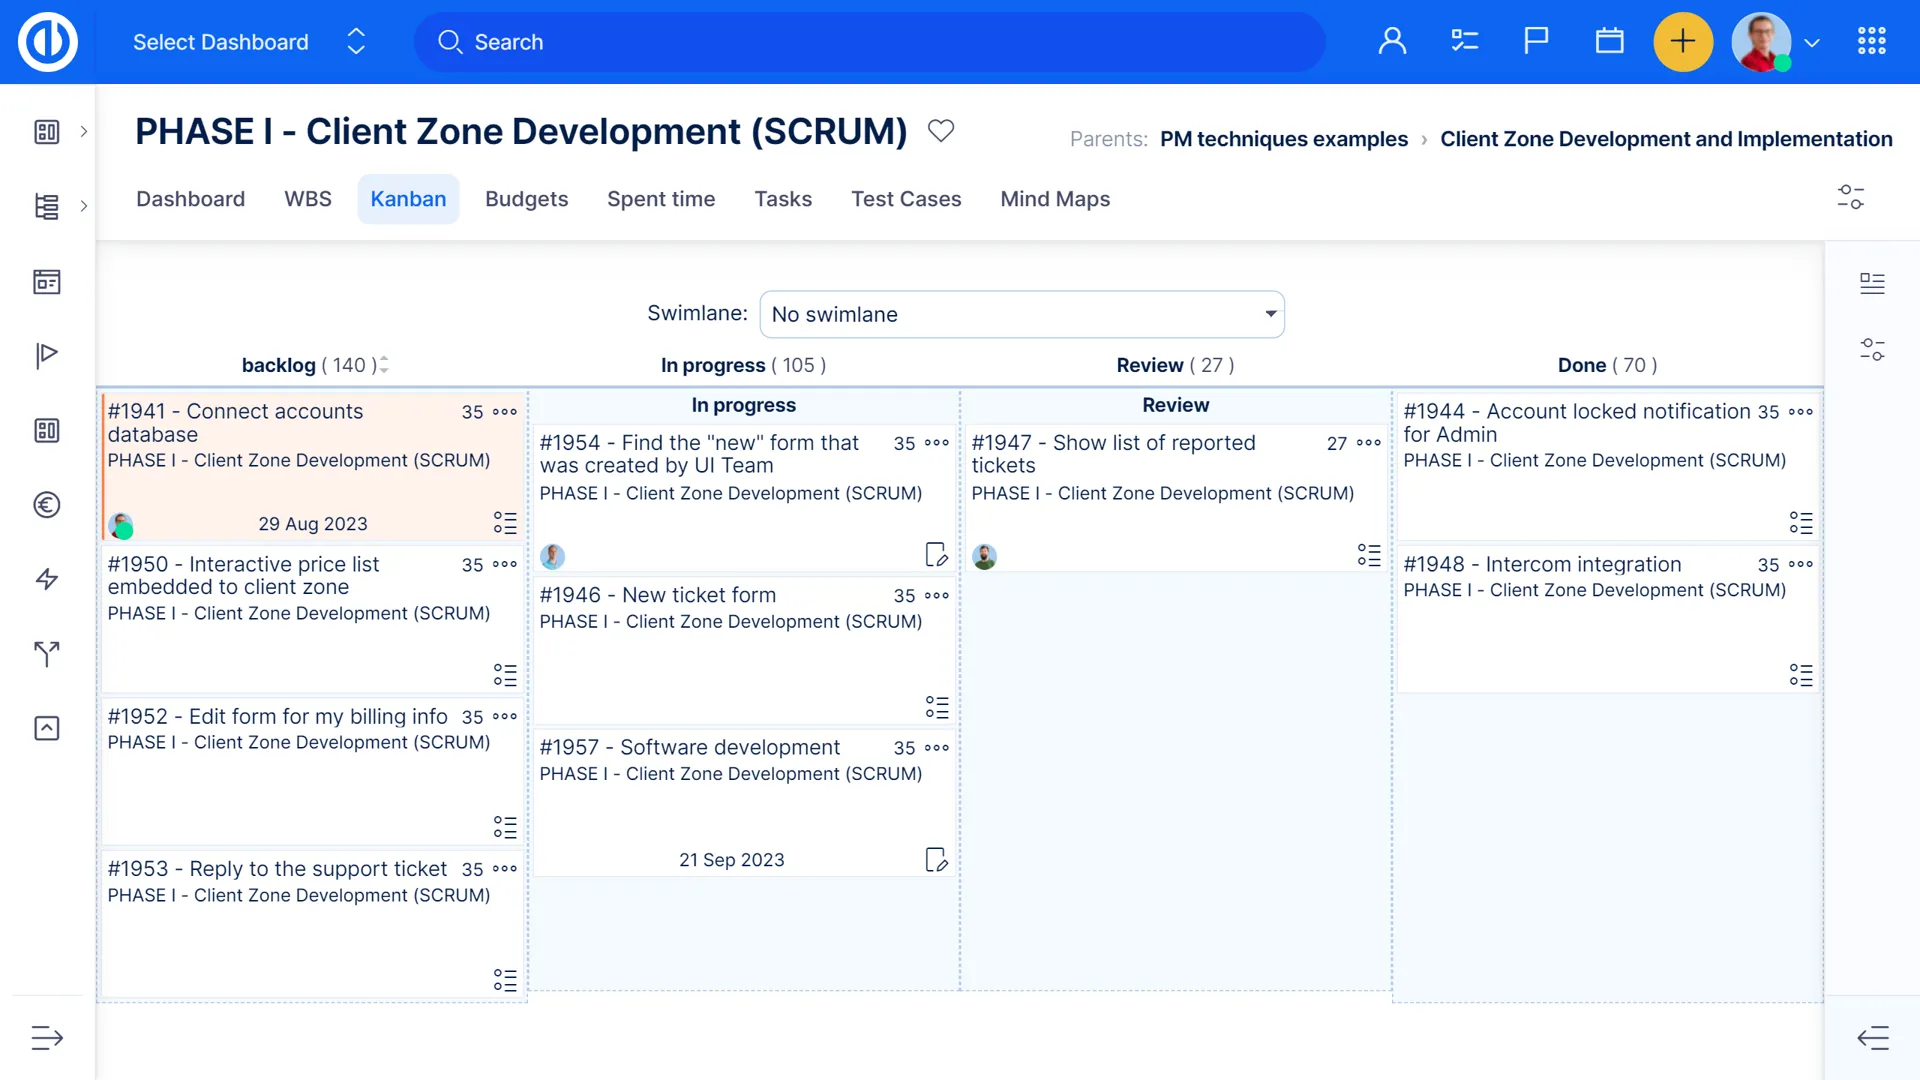
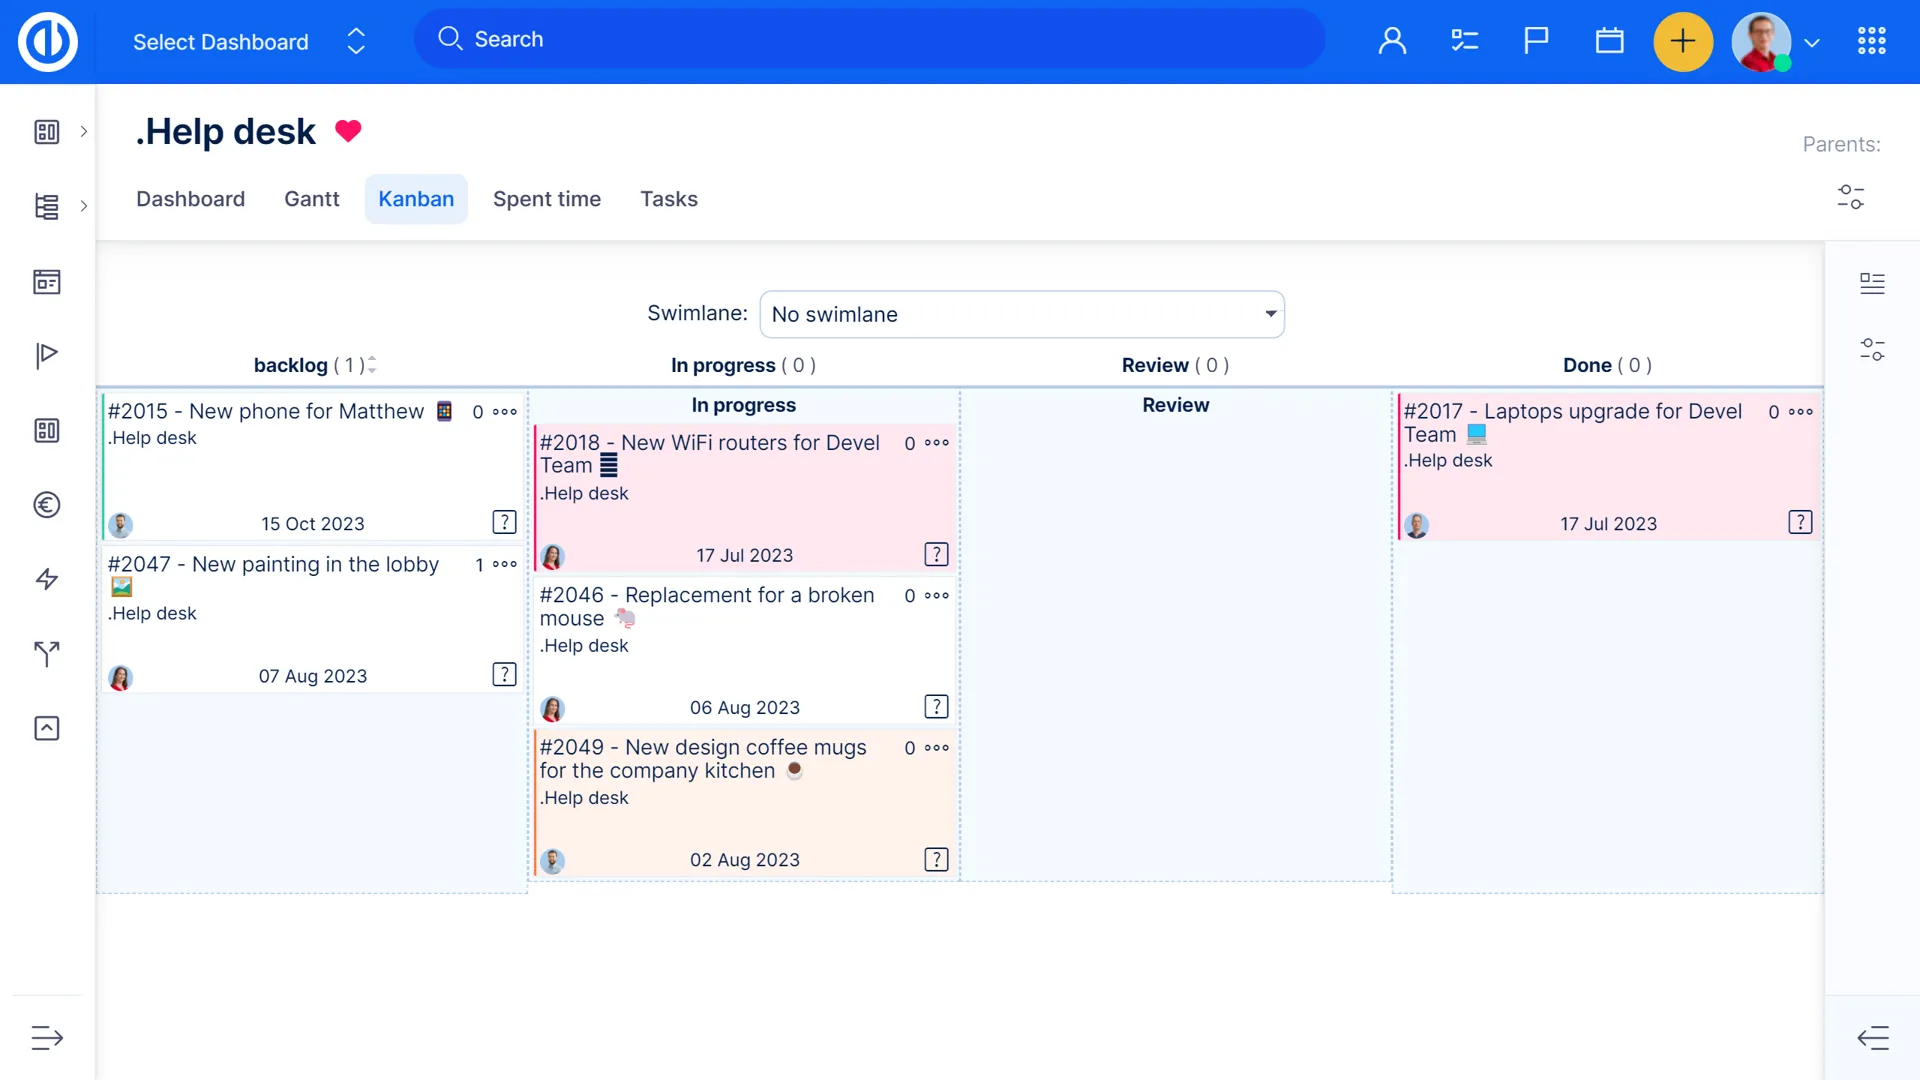
Kanban Boards
Get an overview of work to be done and the current status of tasks with personal & team Kanban Boards. Simply implement these on your personal or team dashboard and update and re-assign tasks via drag & drop without leaving your dashboard. It can be used to support processes in other departments like HR or Finance.
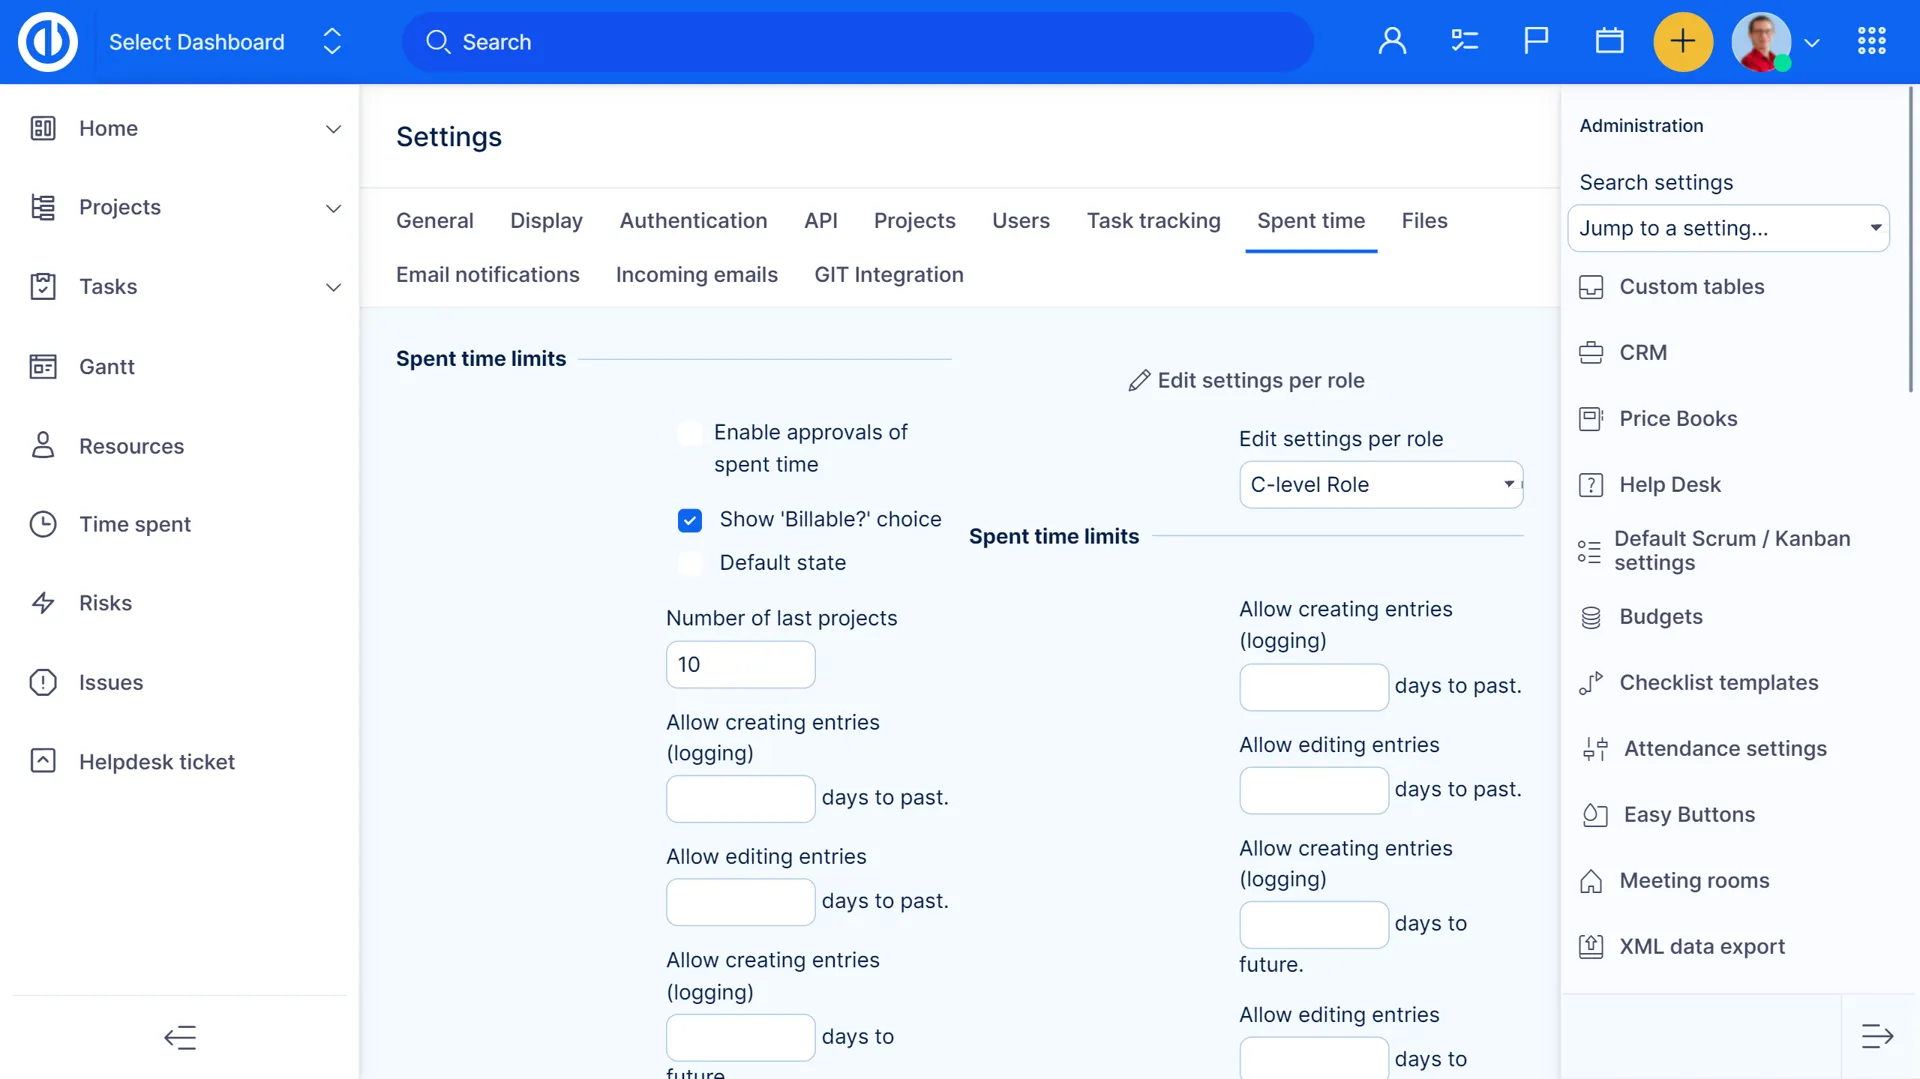
Time Tracking

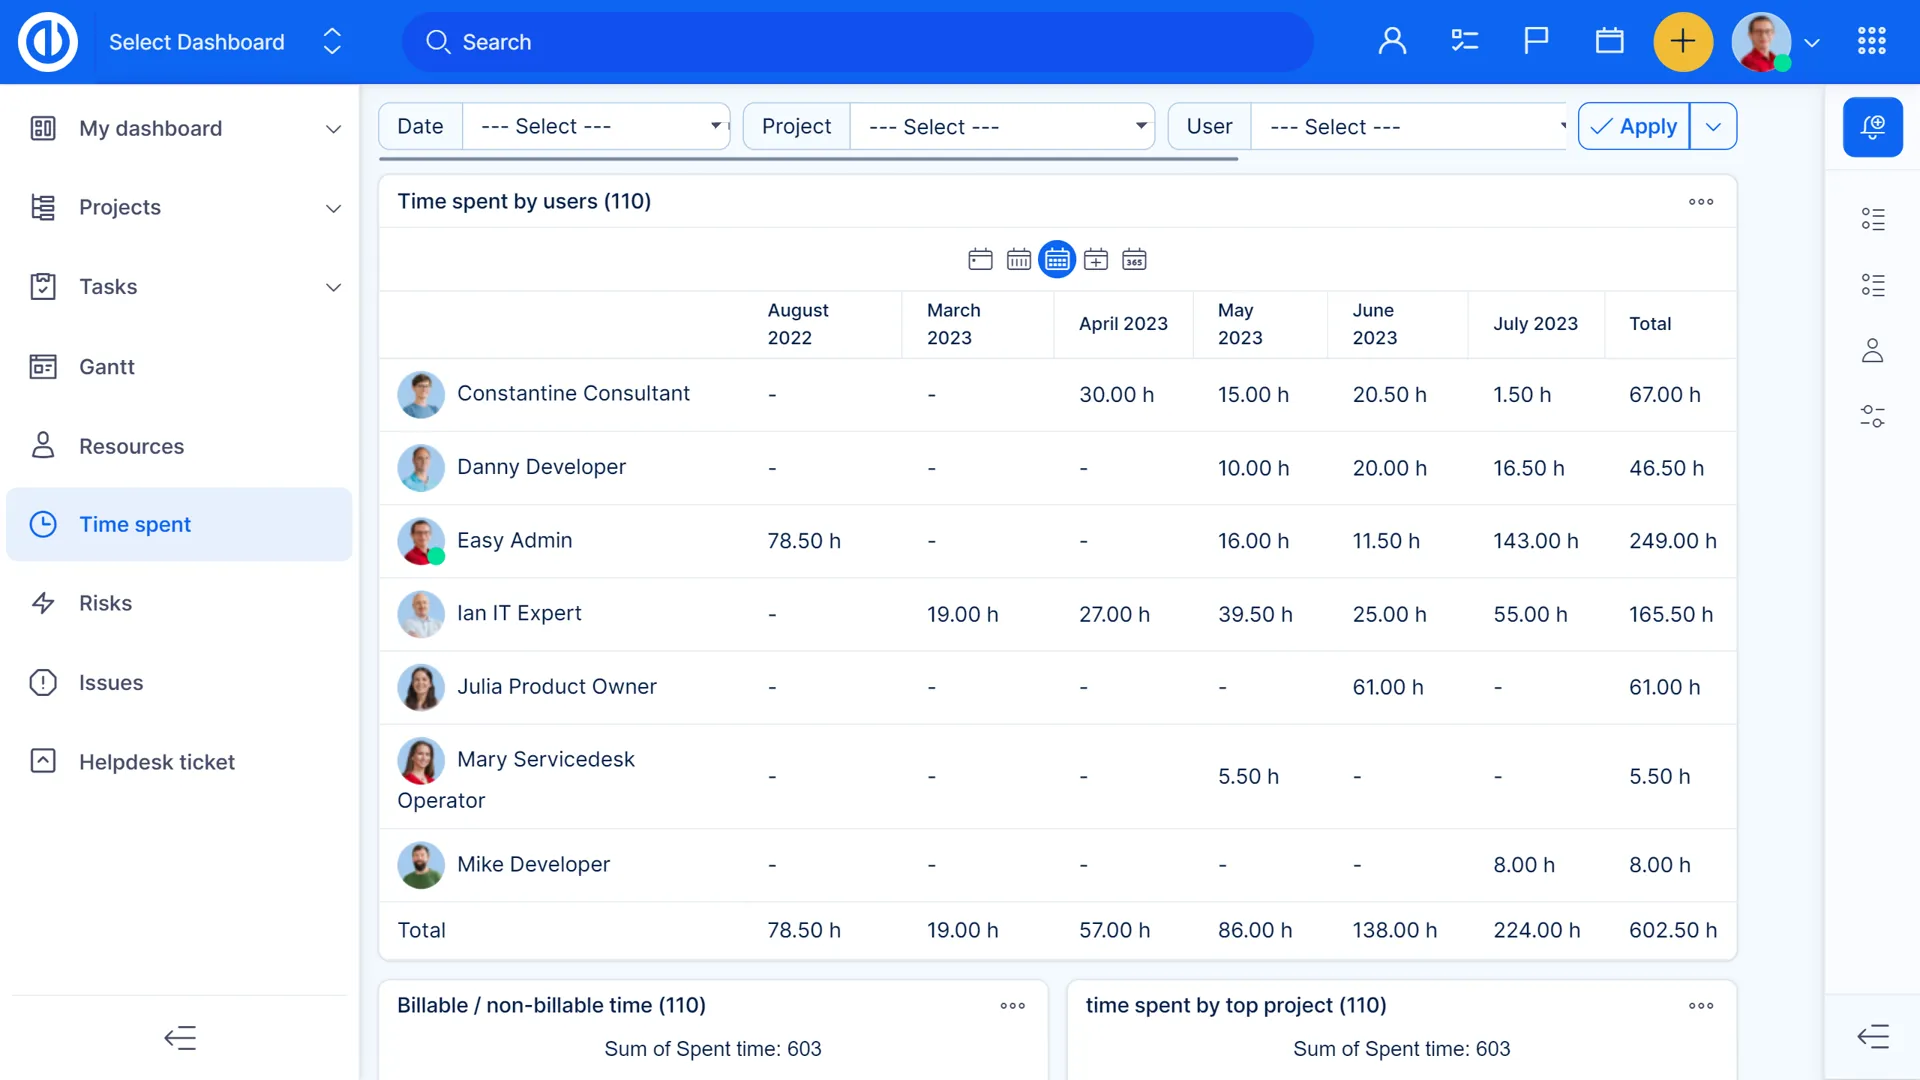
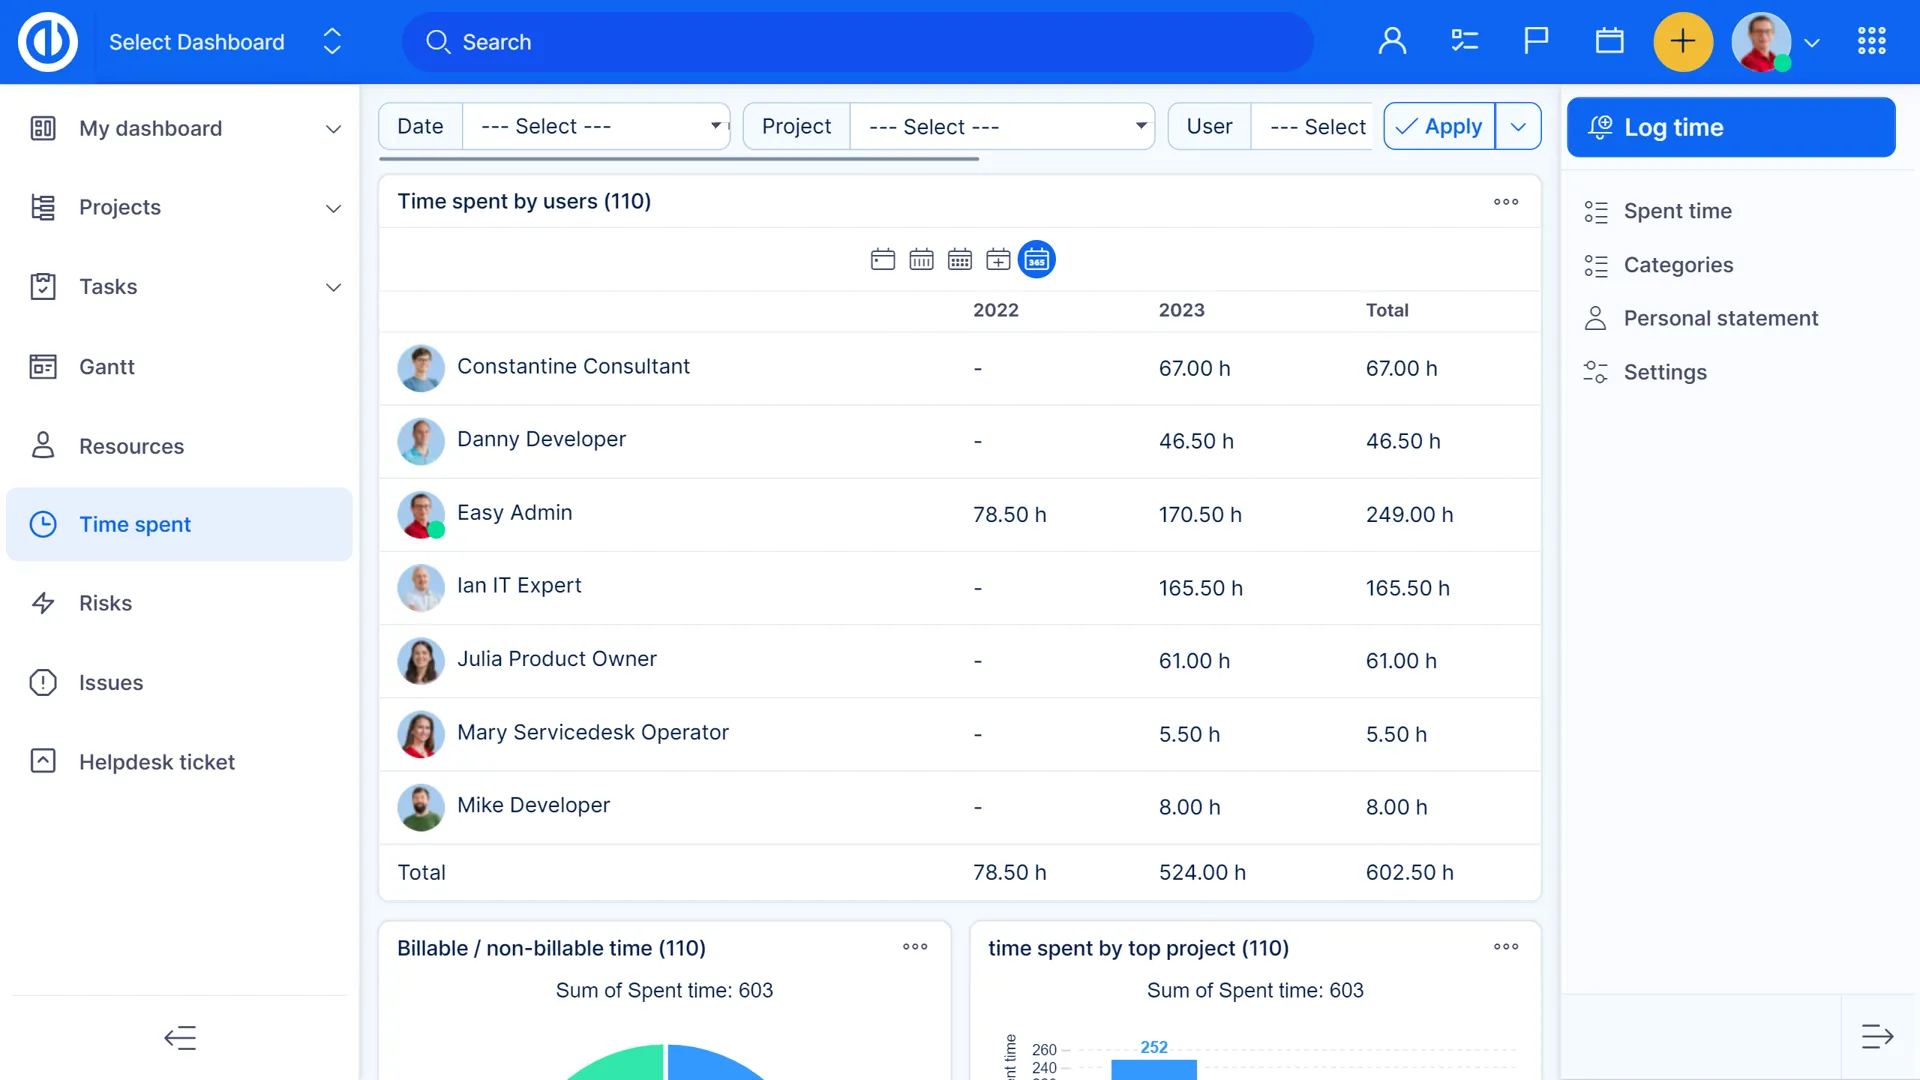
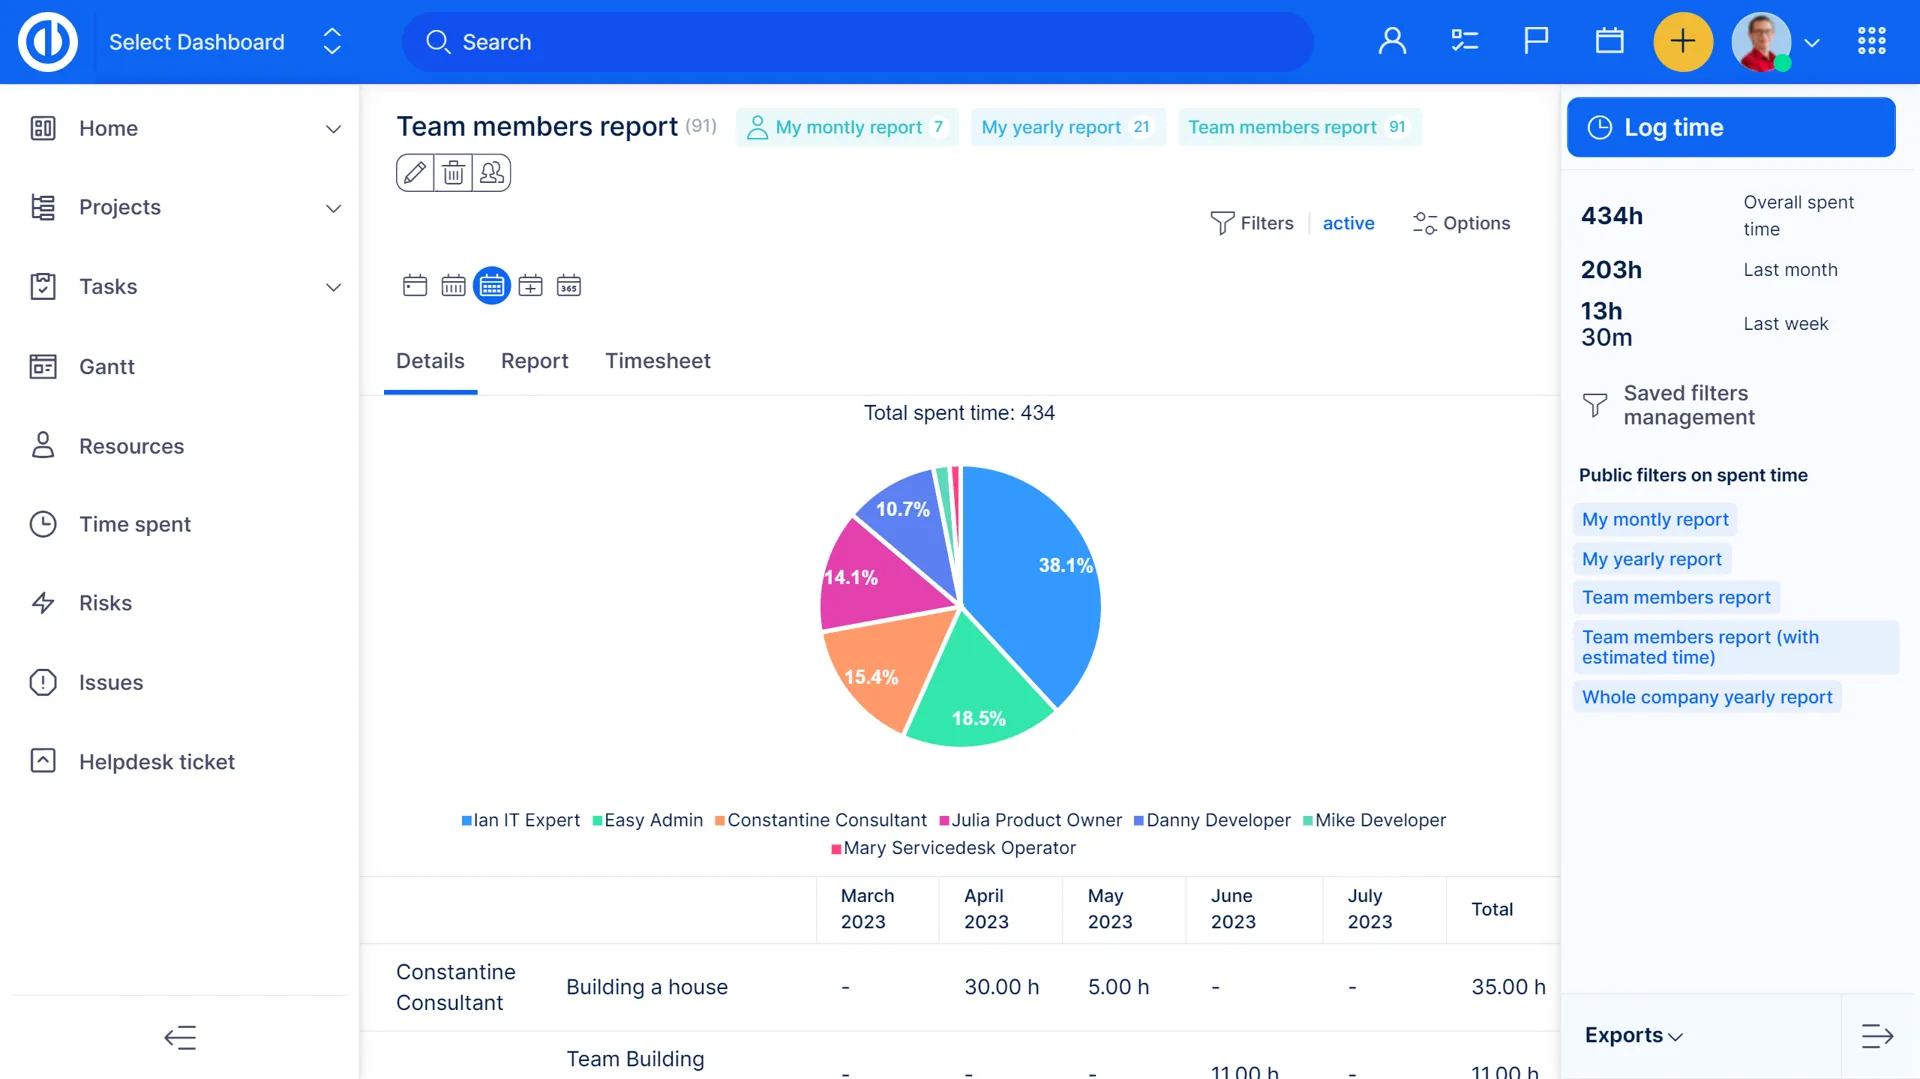
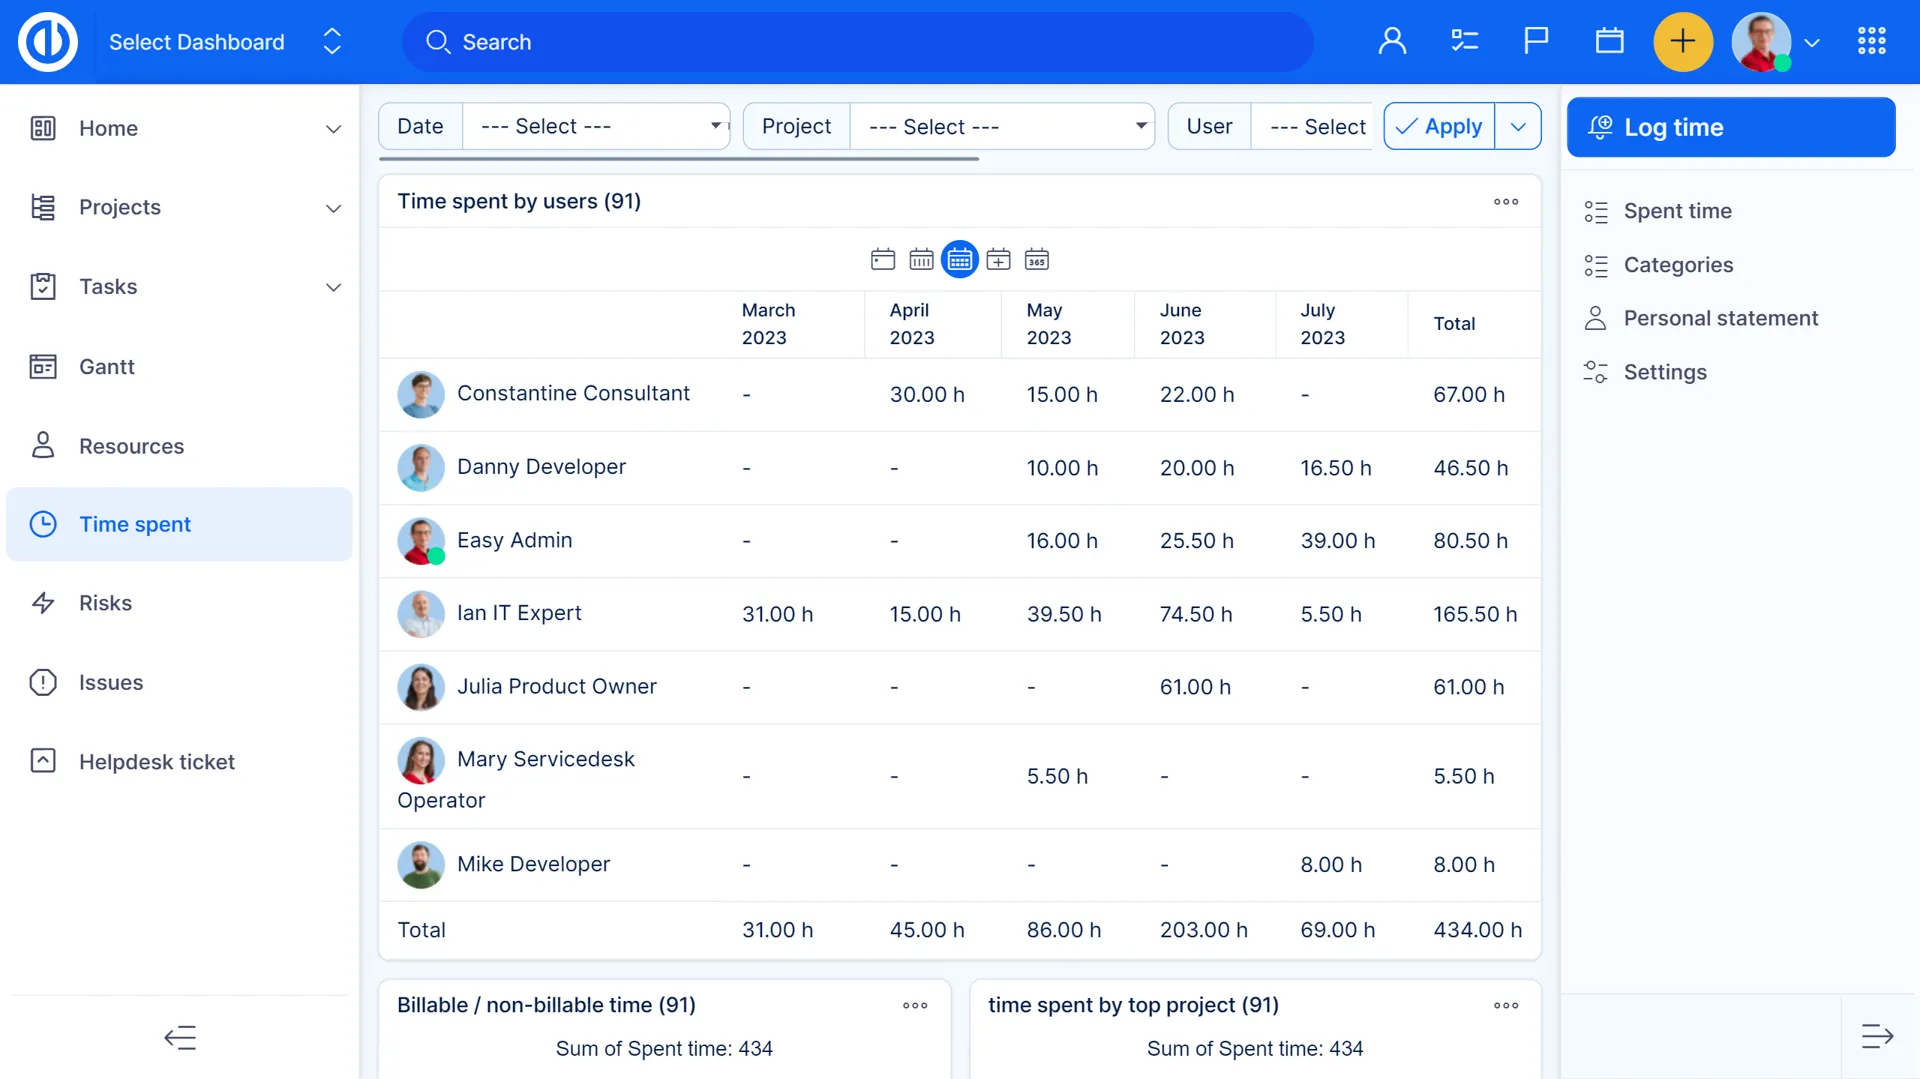
Time Report Dashboard
Time reporting should be a crucial part of any project management. Have you ever wondered how much of your and your team’s time last month has been billed? Or how many hours individual team members have worked last week? How many hours were spent on specific projects? Time Report Dashboard is here to tell you.
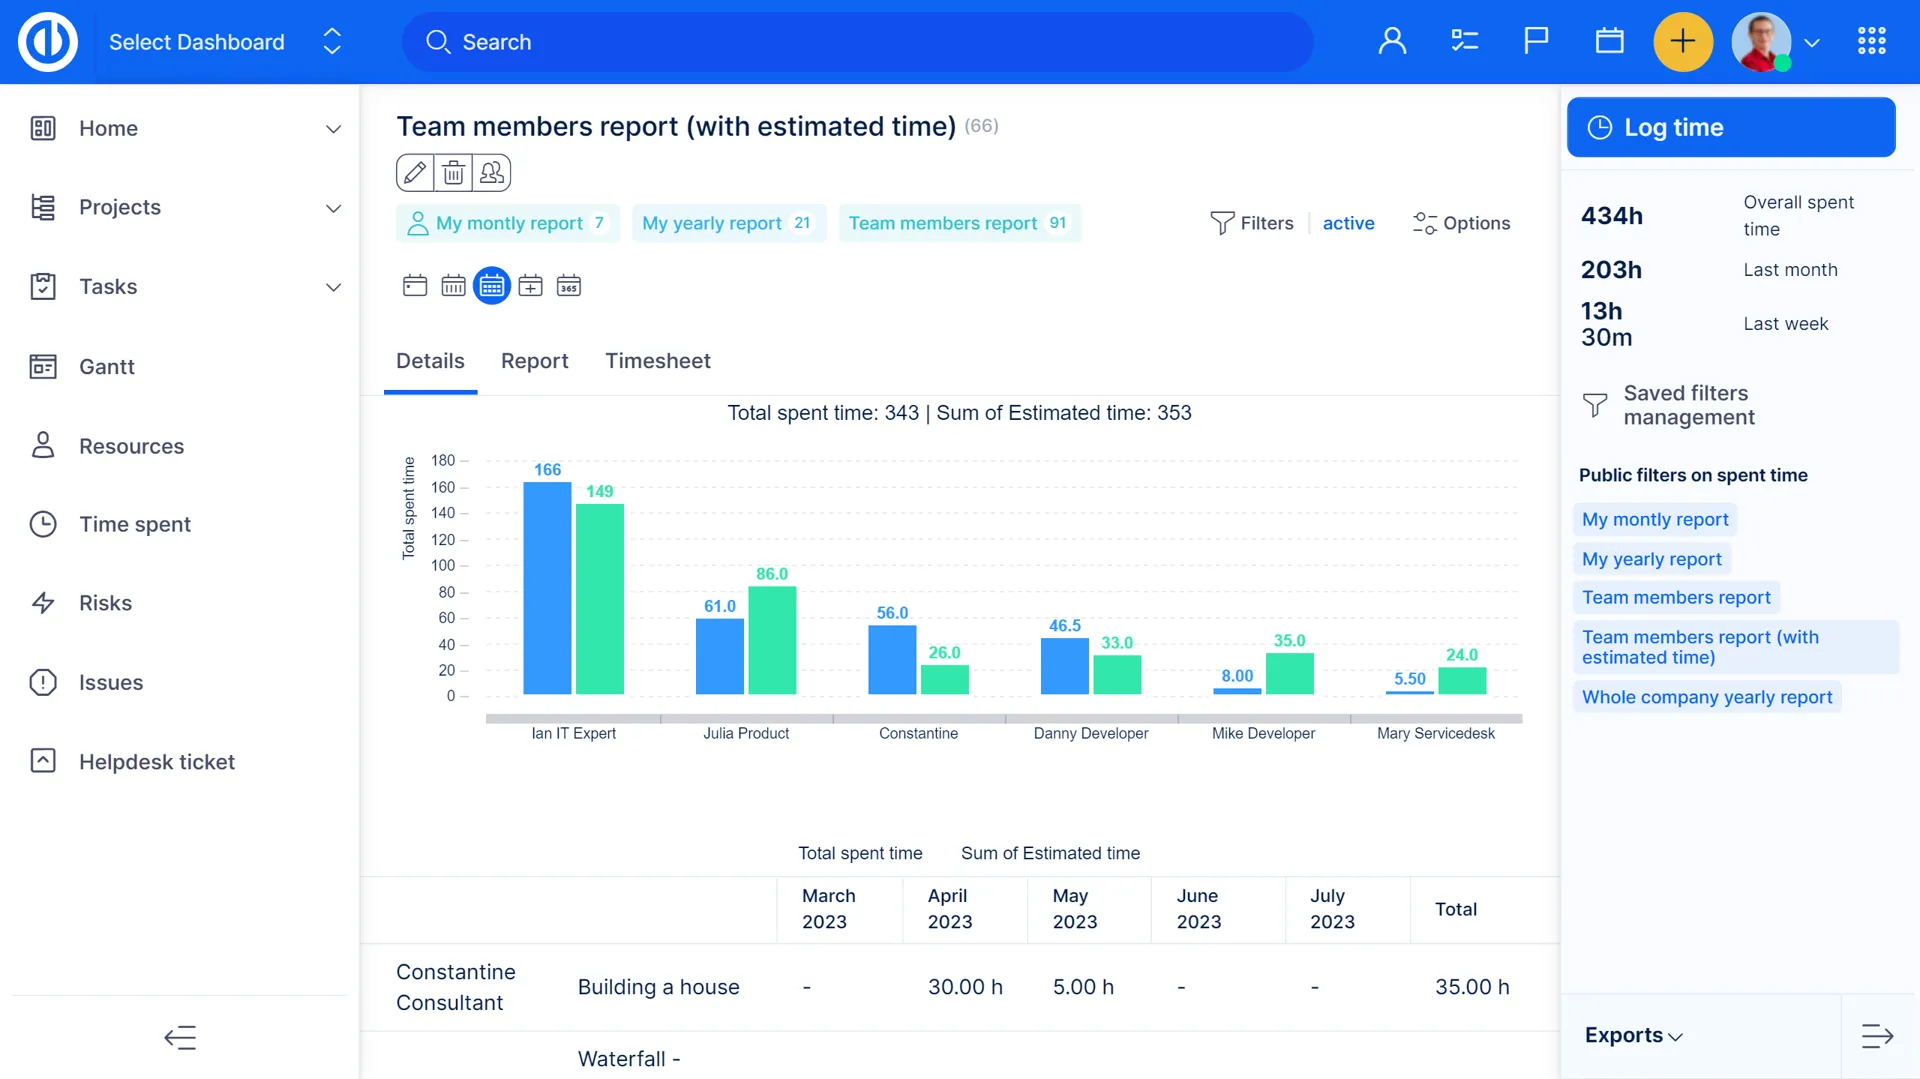

Time tracking and reporting for efficiency and planning
Time tracking and reporting is the key to efficient time management and planning. It allows employees to efficiently utilize and report their time, and managers can monitor spent time and use it as a reference for future project planning.

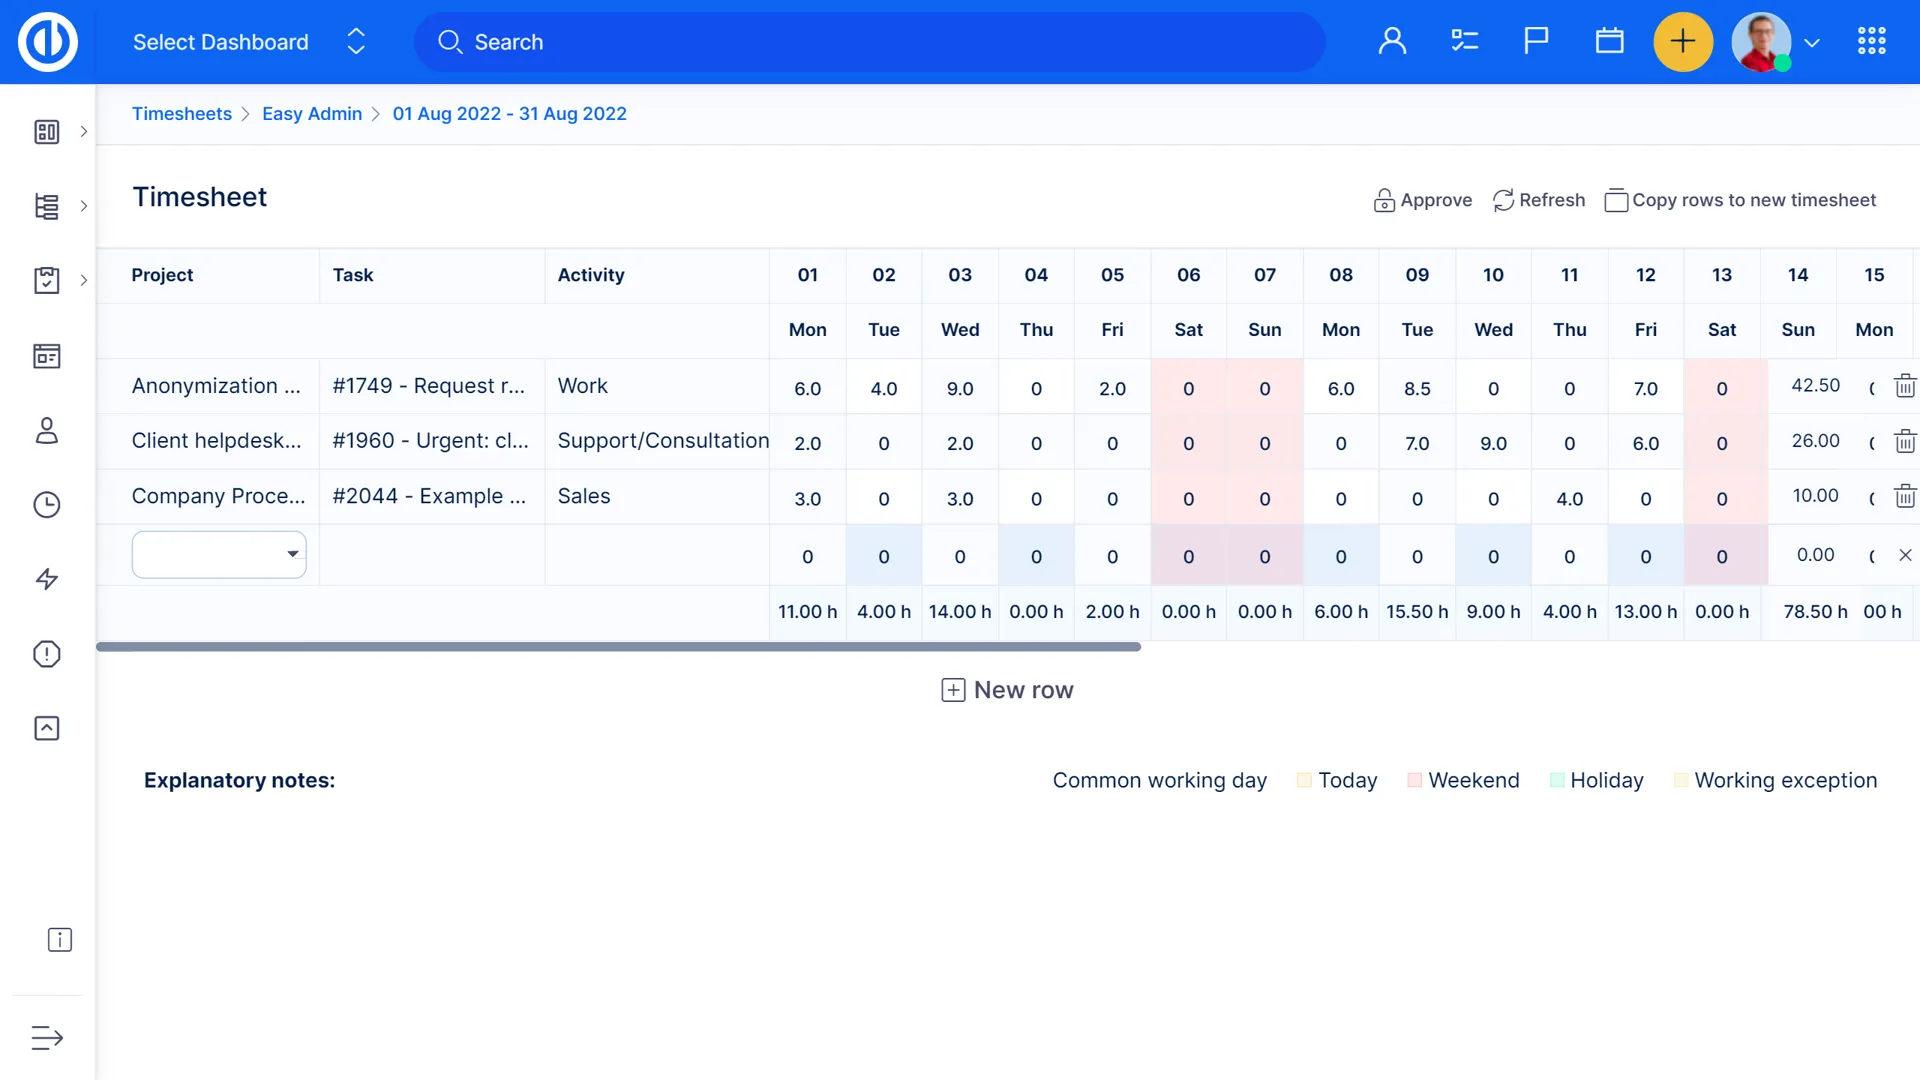
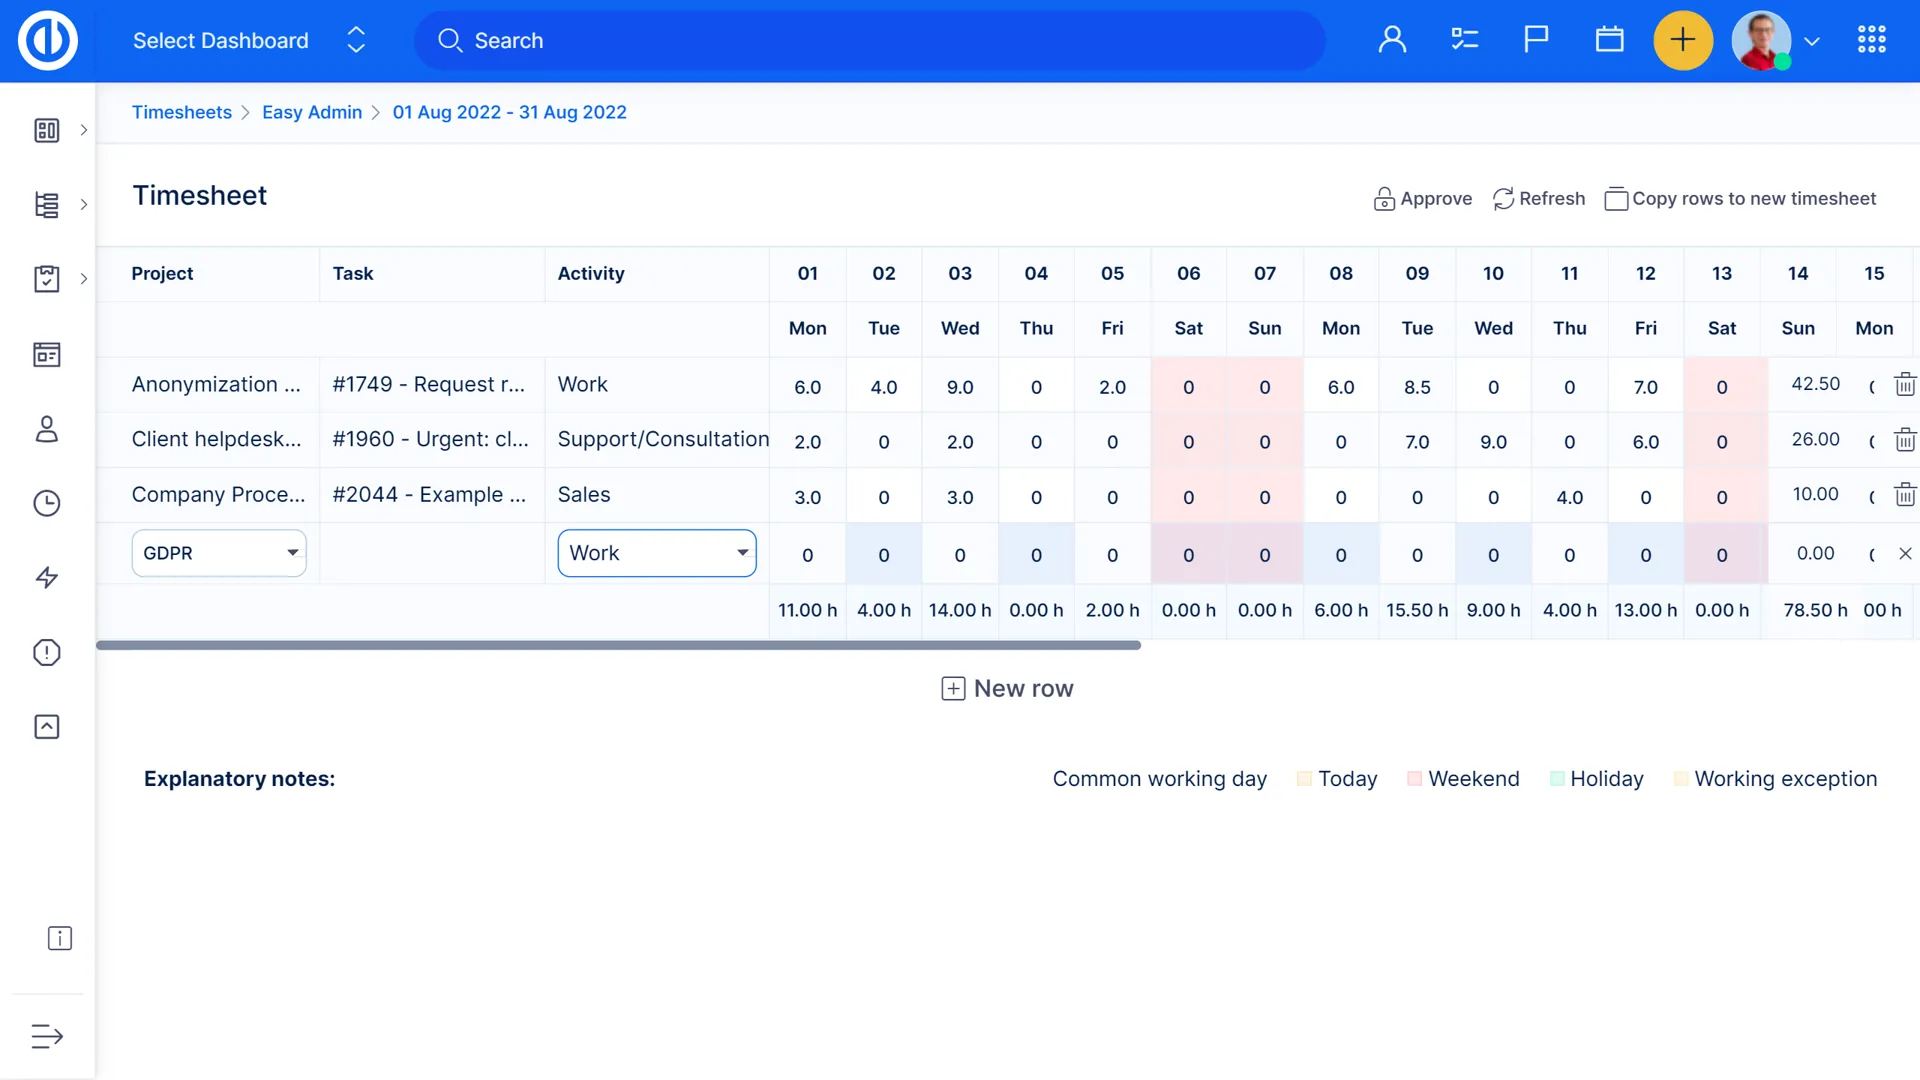
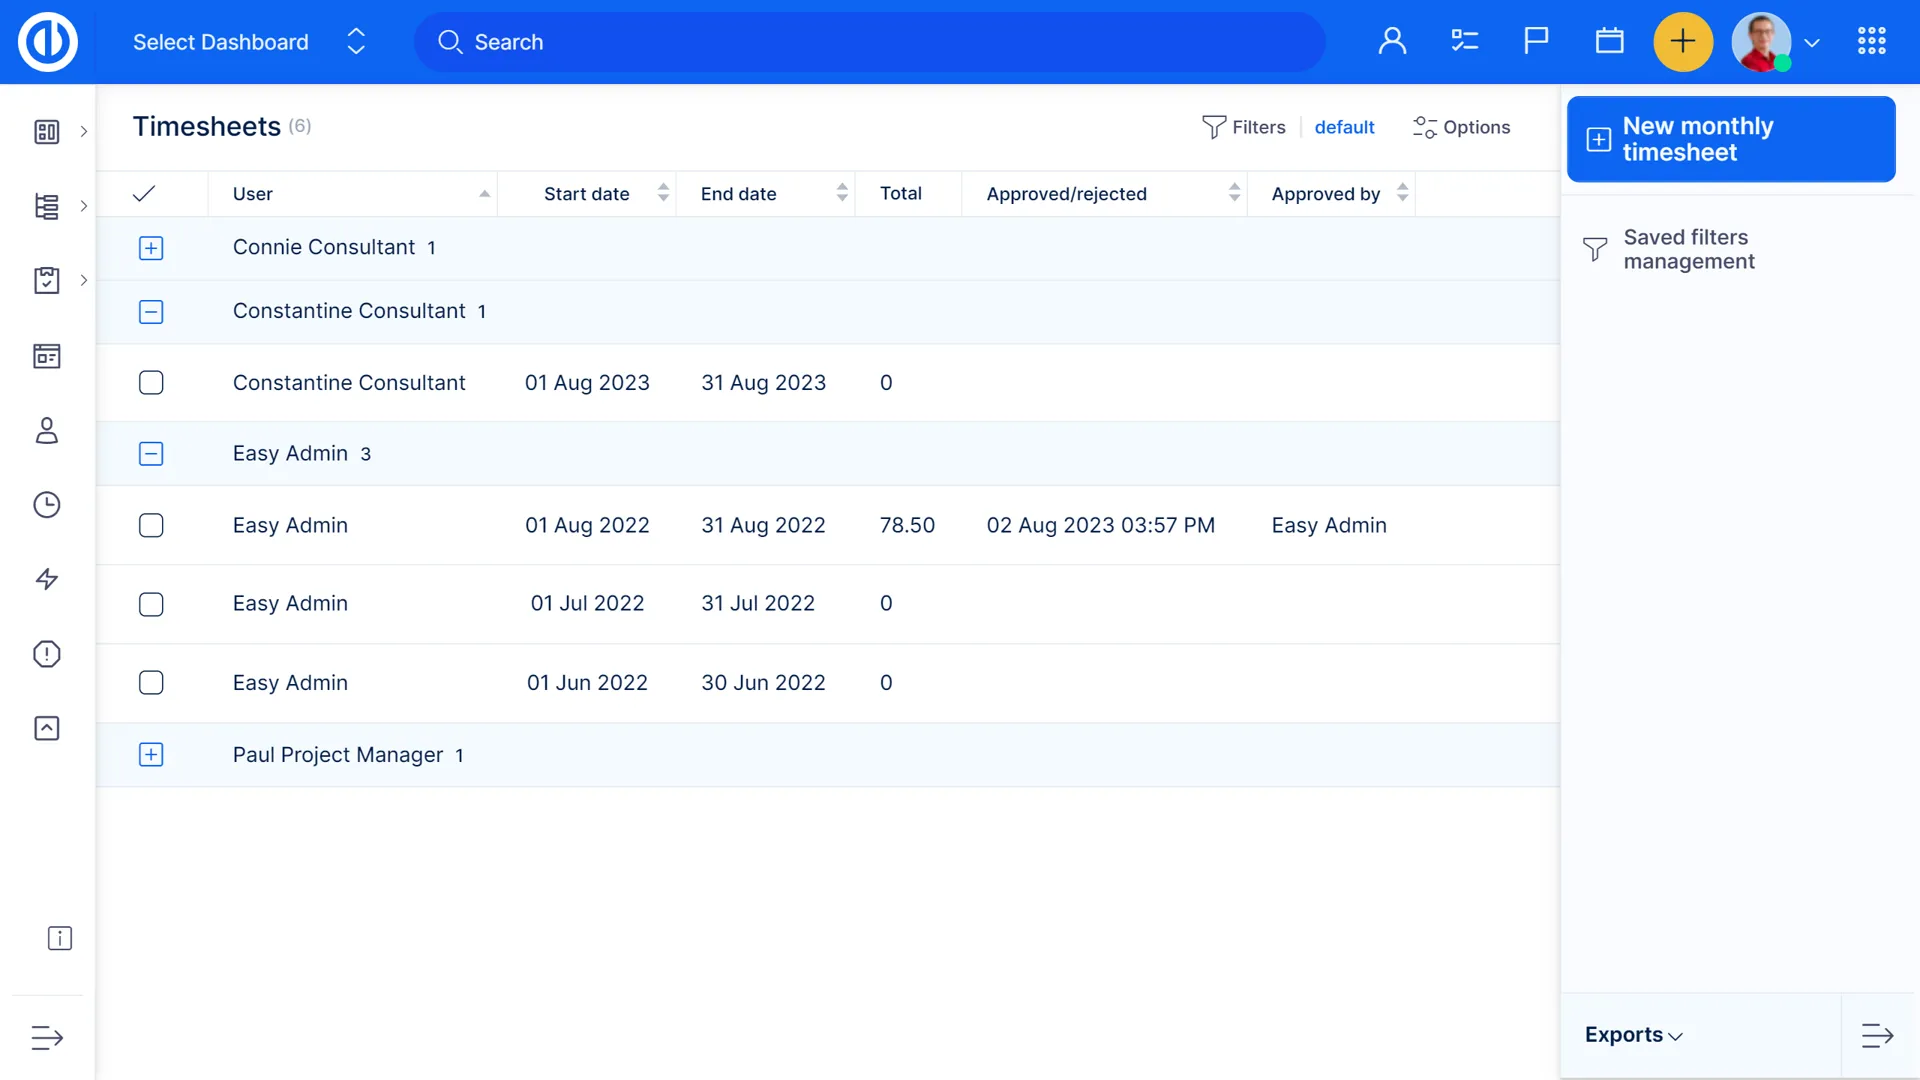
Timesheets for weekly spent time reporting
Timesheets are an easy way of creating spent time reports on projects or tasks. Users can create weekly time sheets and managers control and approve them.

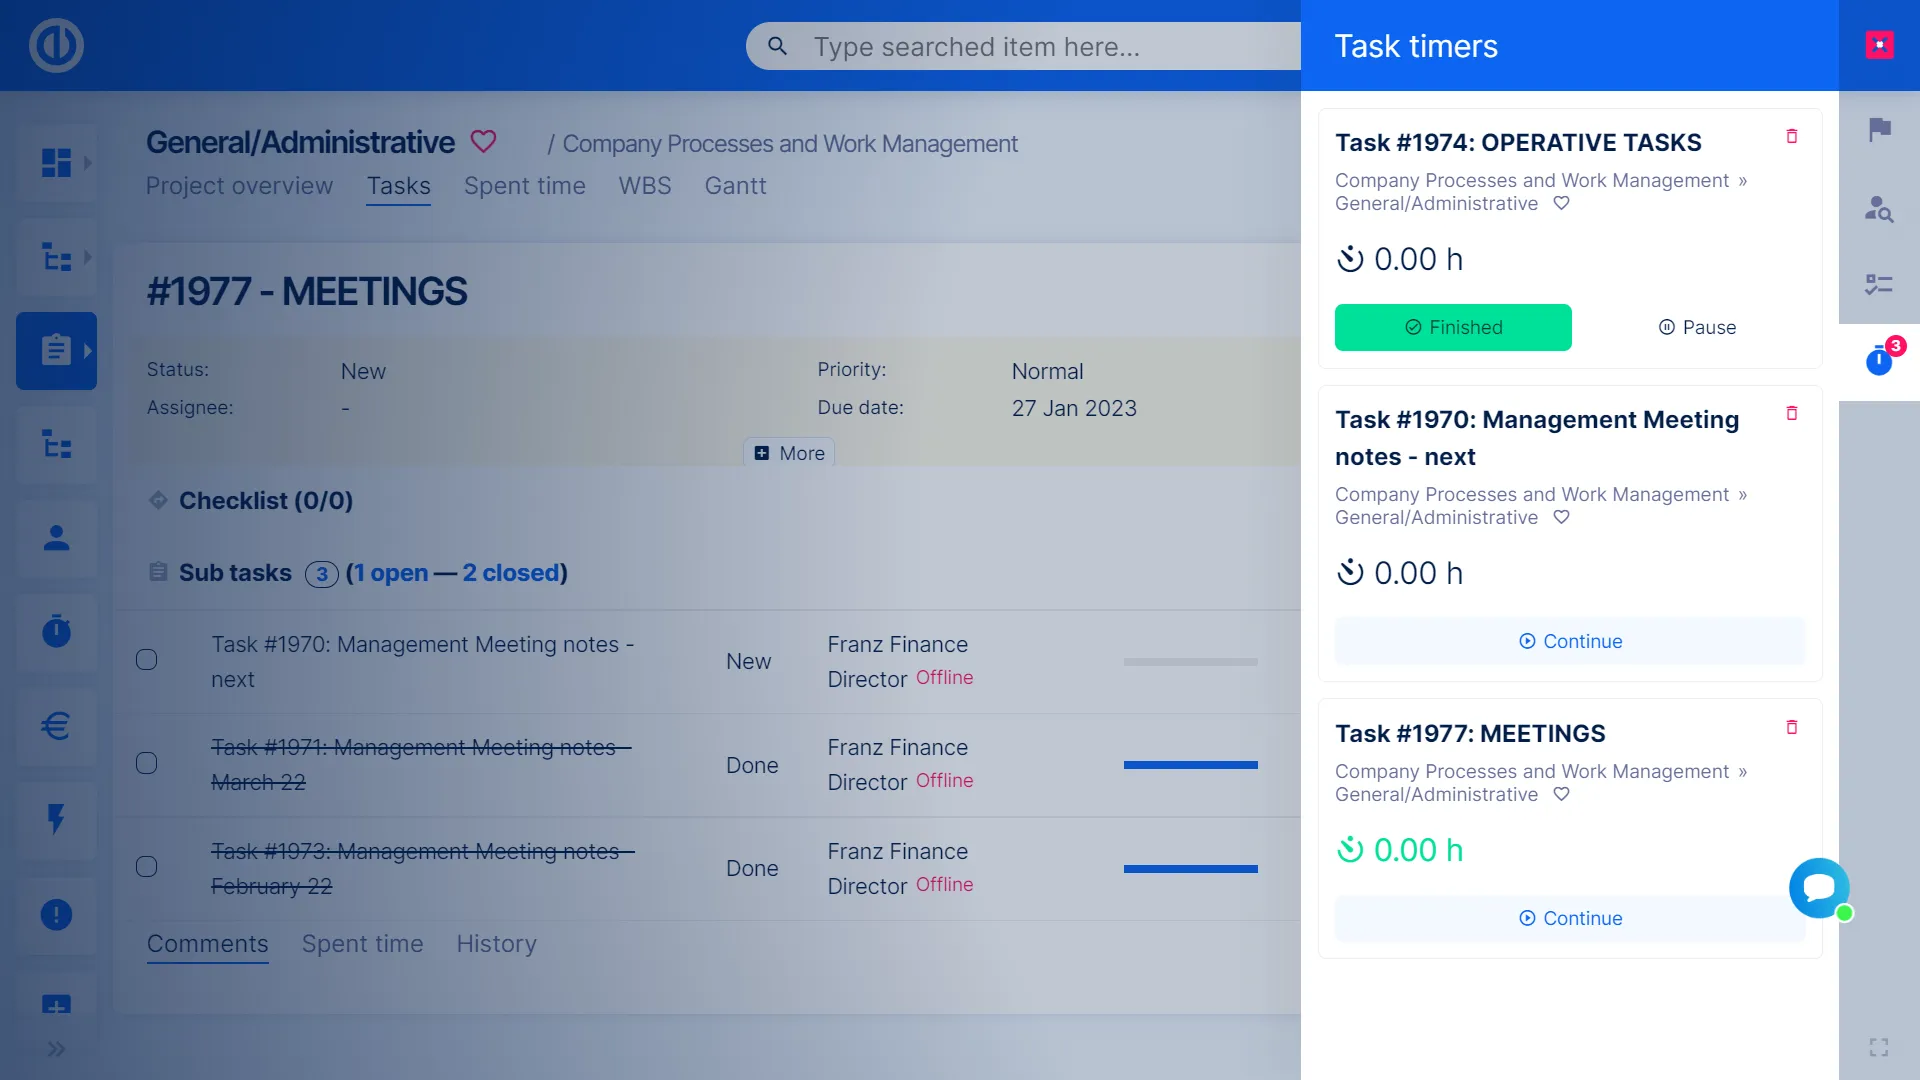
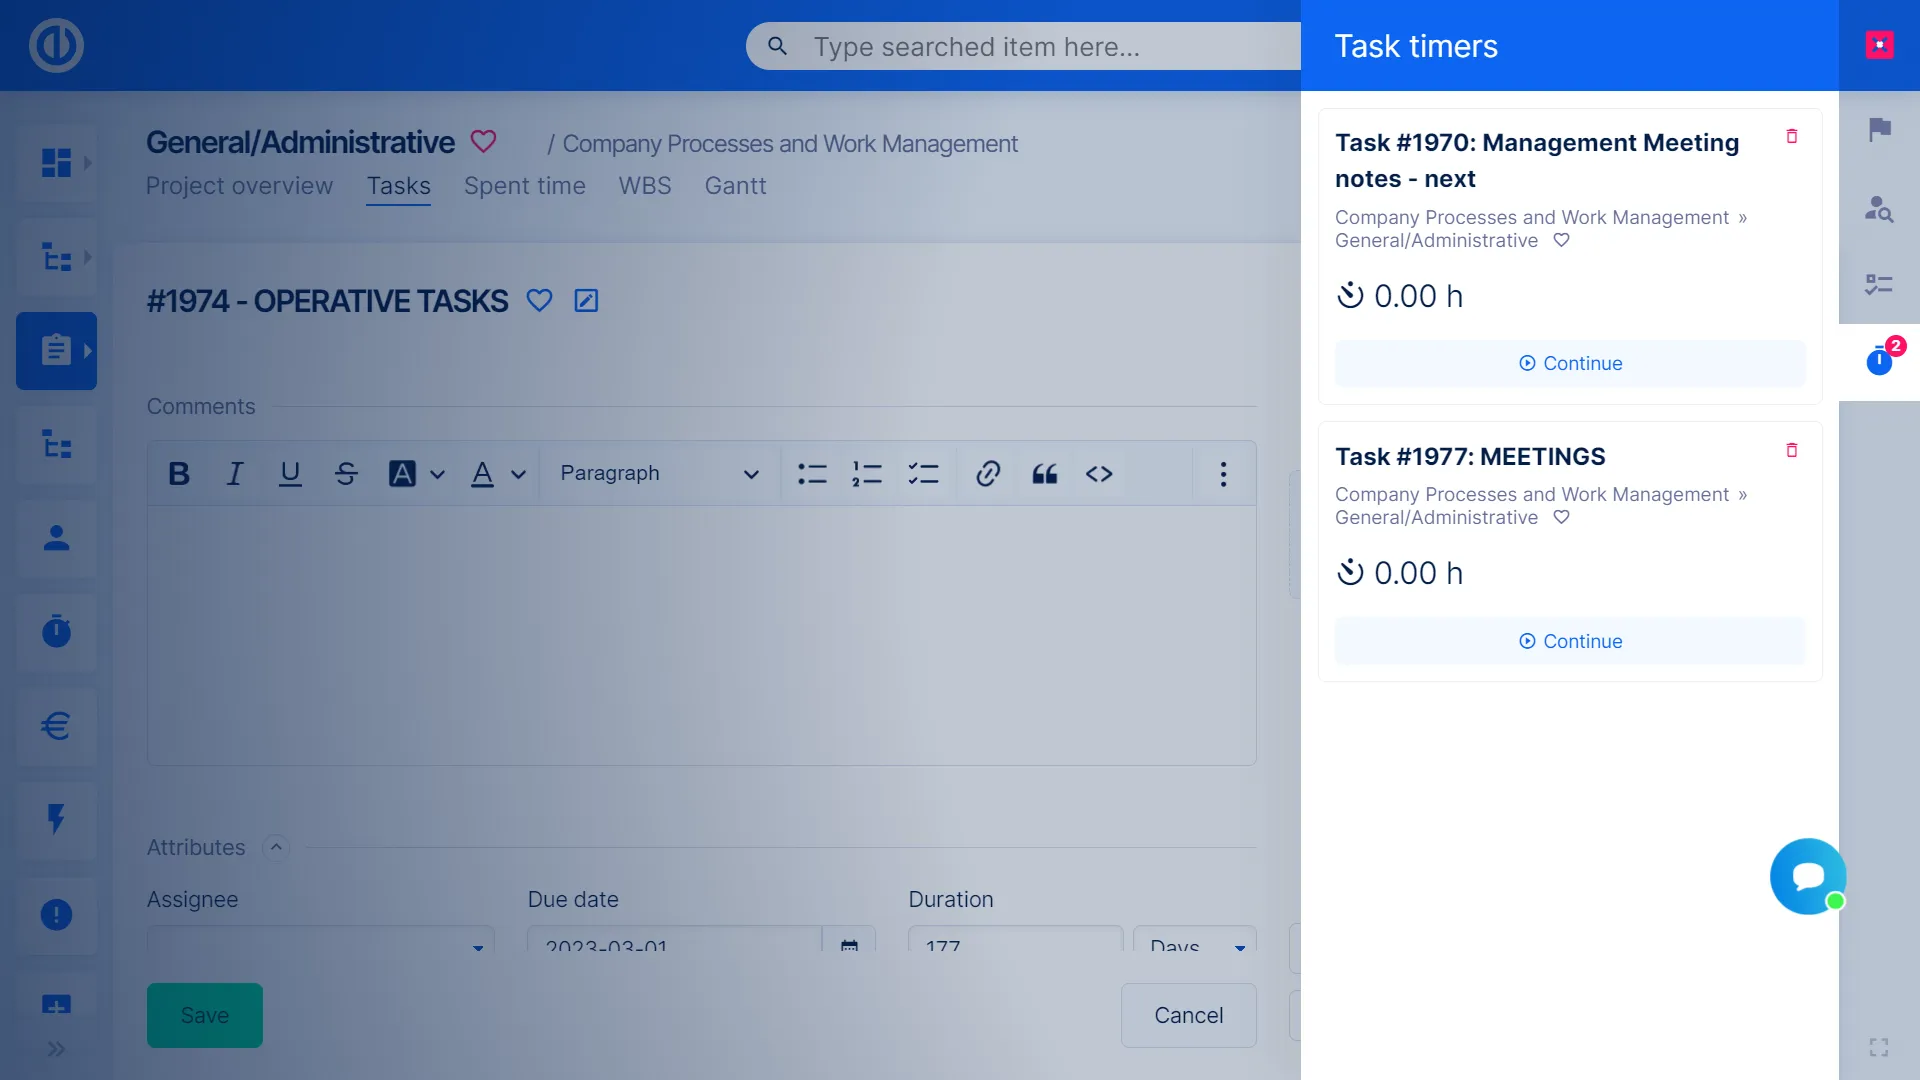
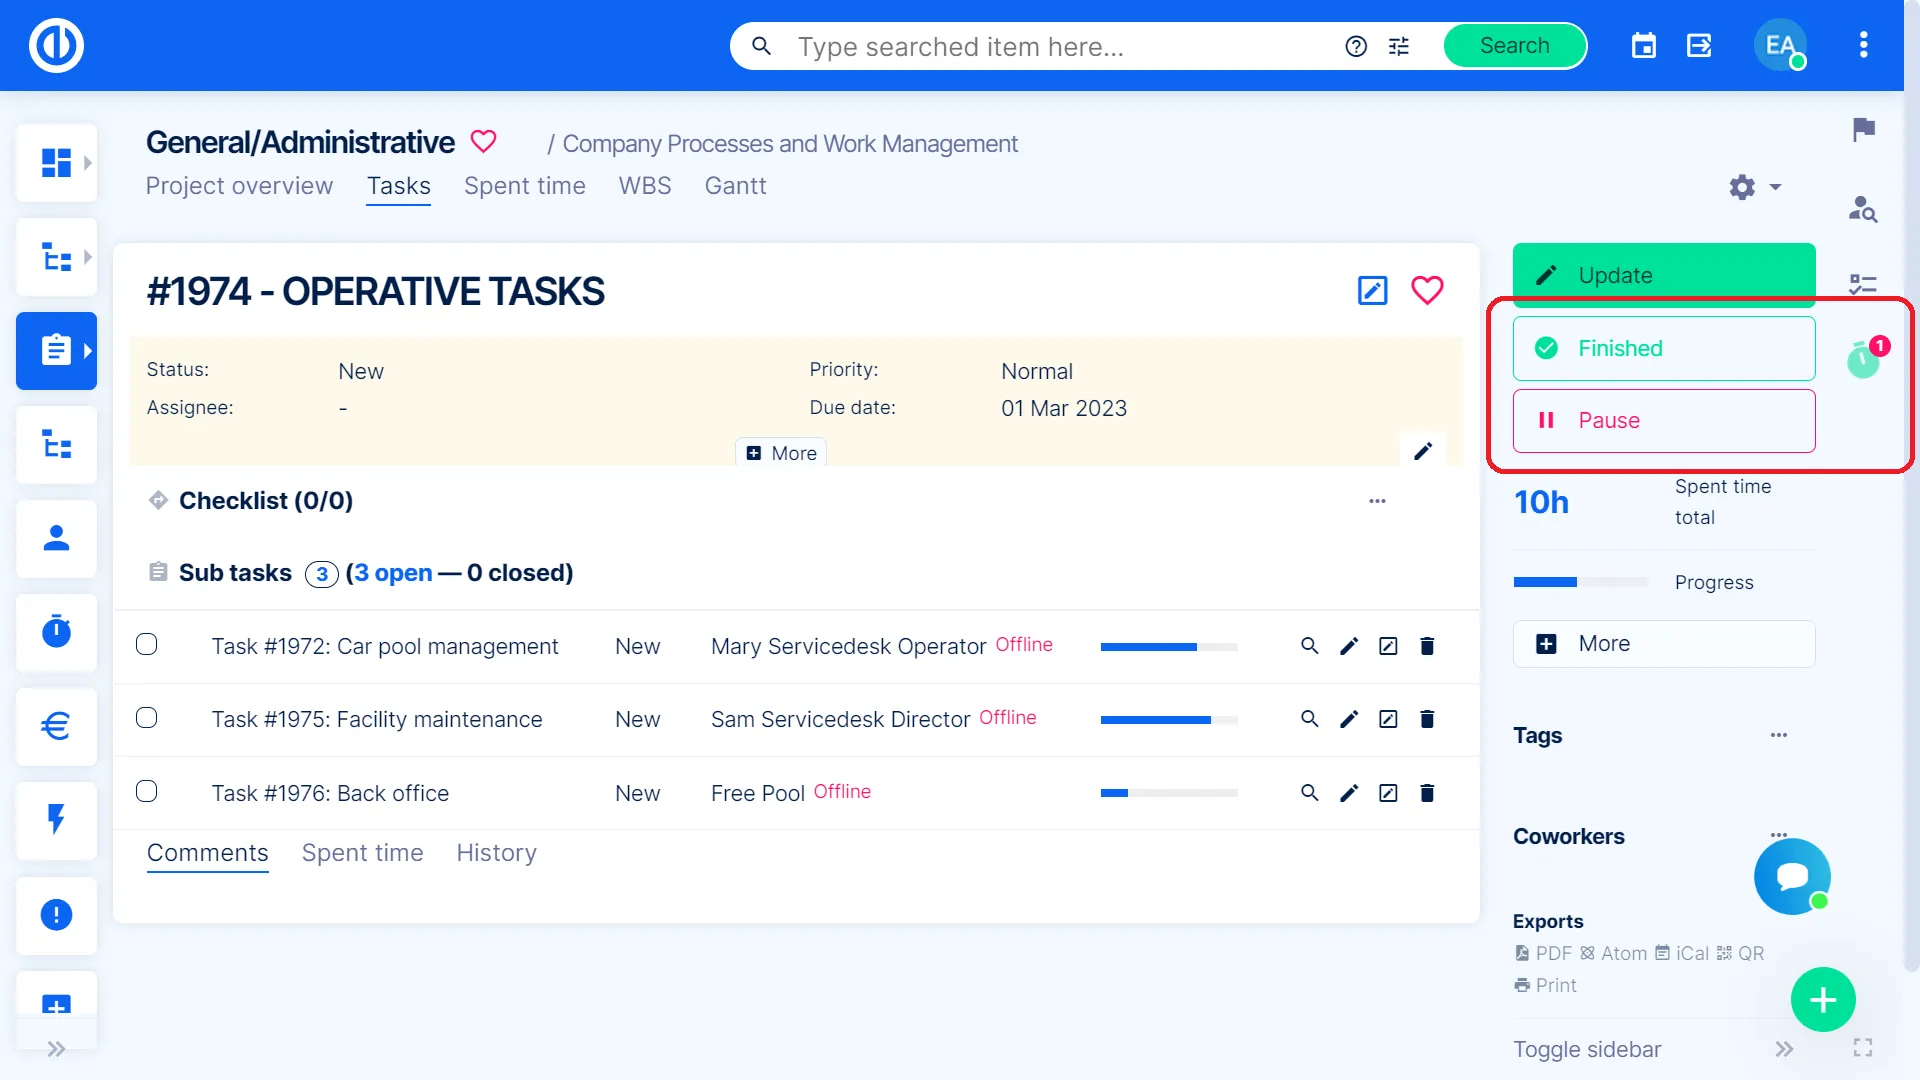
Stopwatch for exact time tracking
Stopwatch (aka Task Timer) is used for exact time tracking on tasks. When you are ready to start working, just click on the "Start working" button. You can pause the timer anytime and then, when you get to the task again, just resume it from the previous state. When you finish working on the task, end the timer and you instantly see the total amount of recorded time just like the time logging option. Furthermore, managers and team leaders can see an overview of running or paused stopwatches of their team members.
Portfolio Management

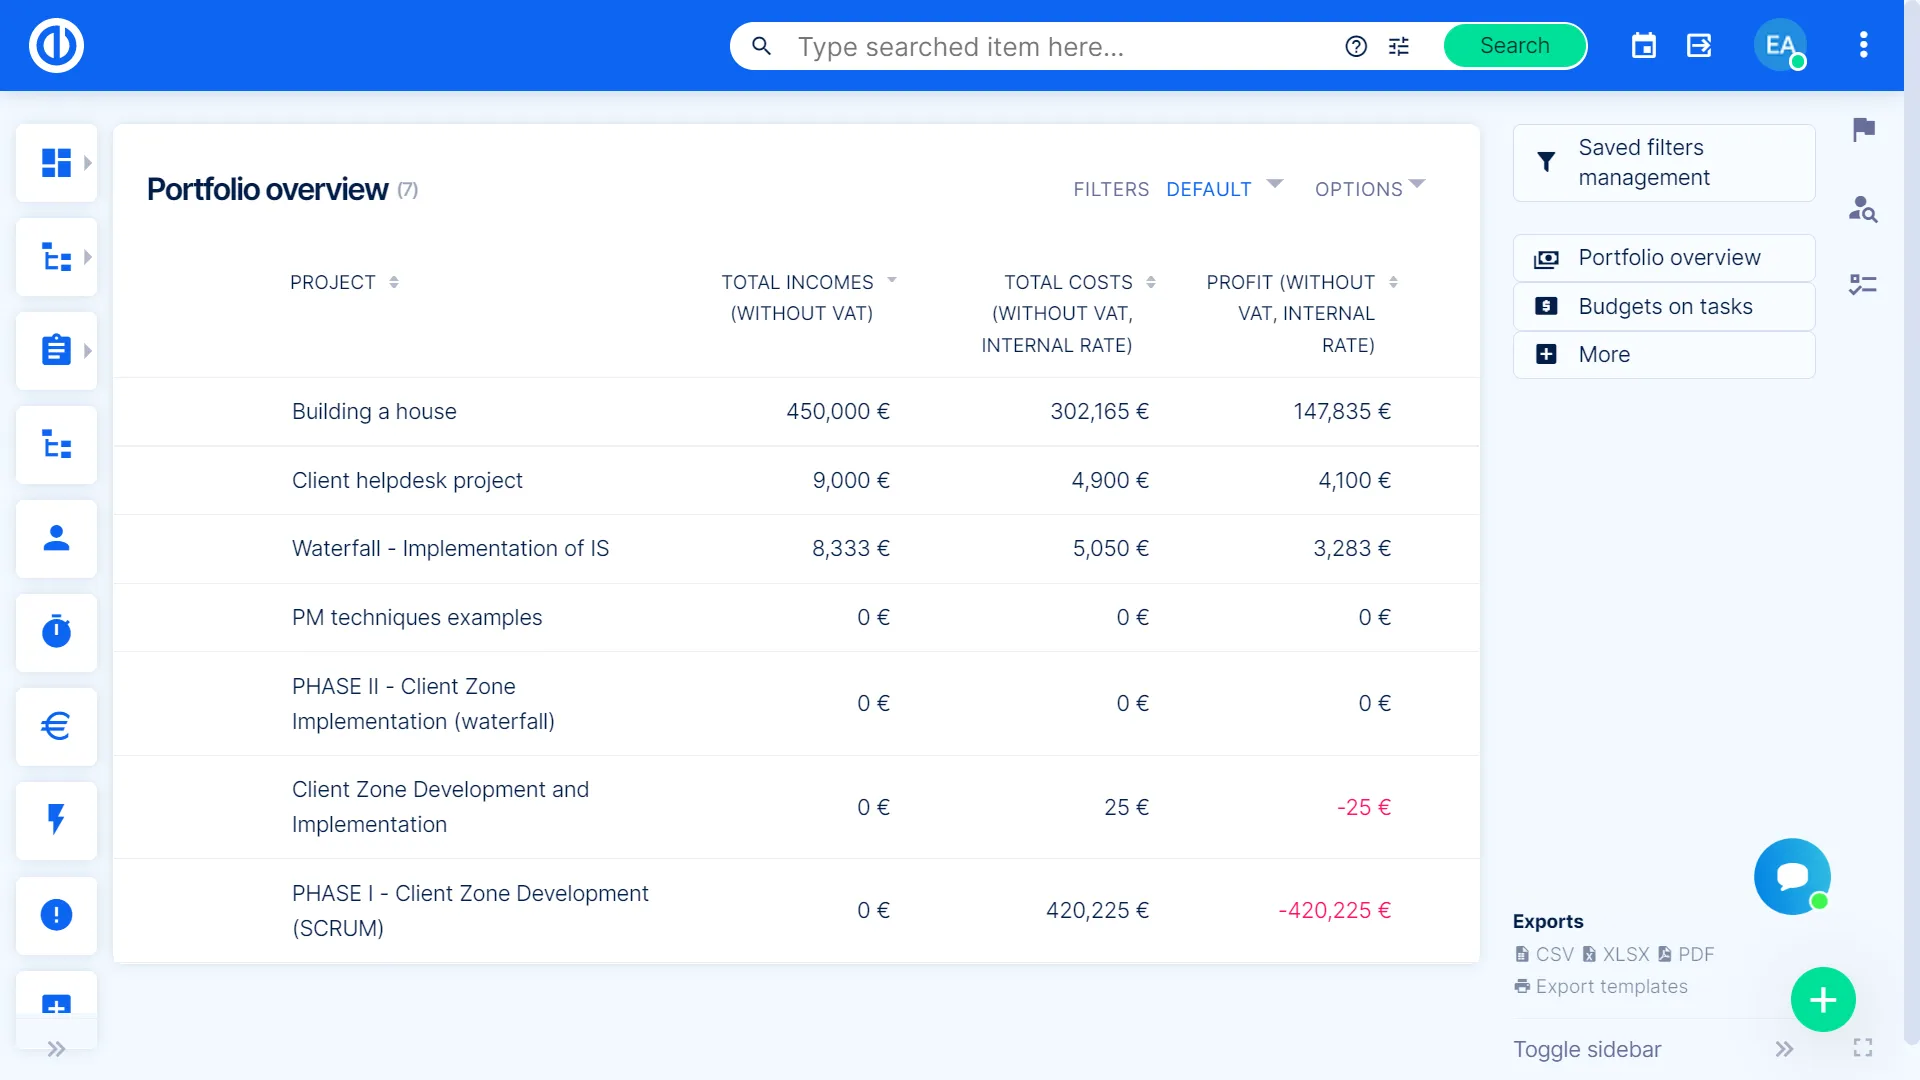
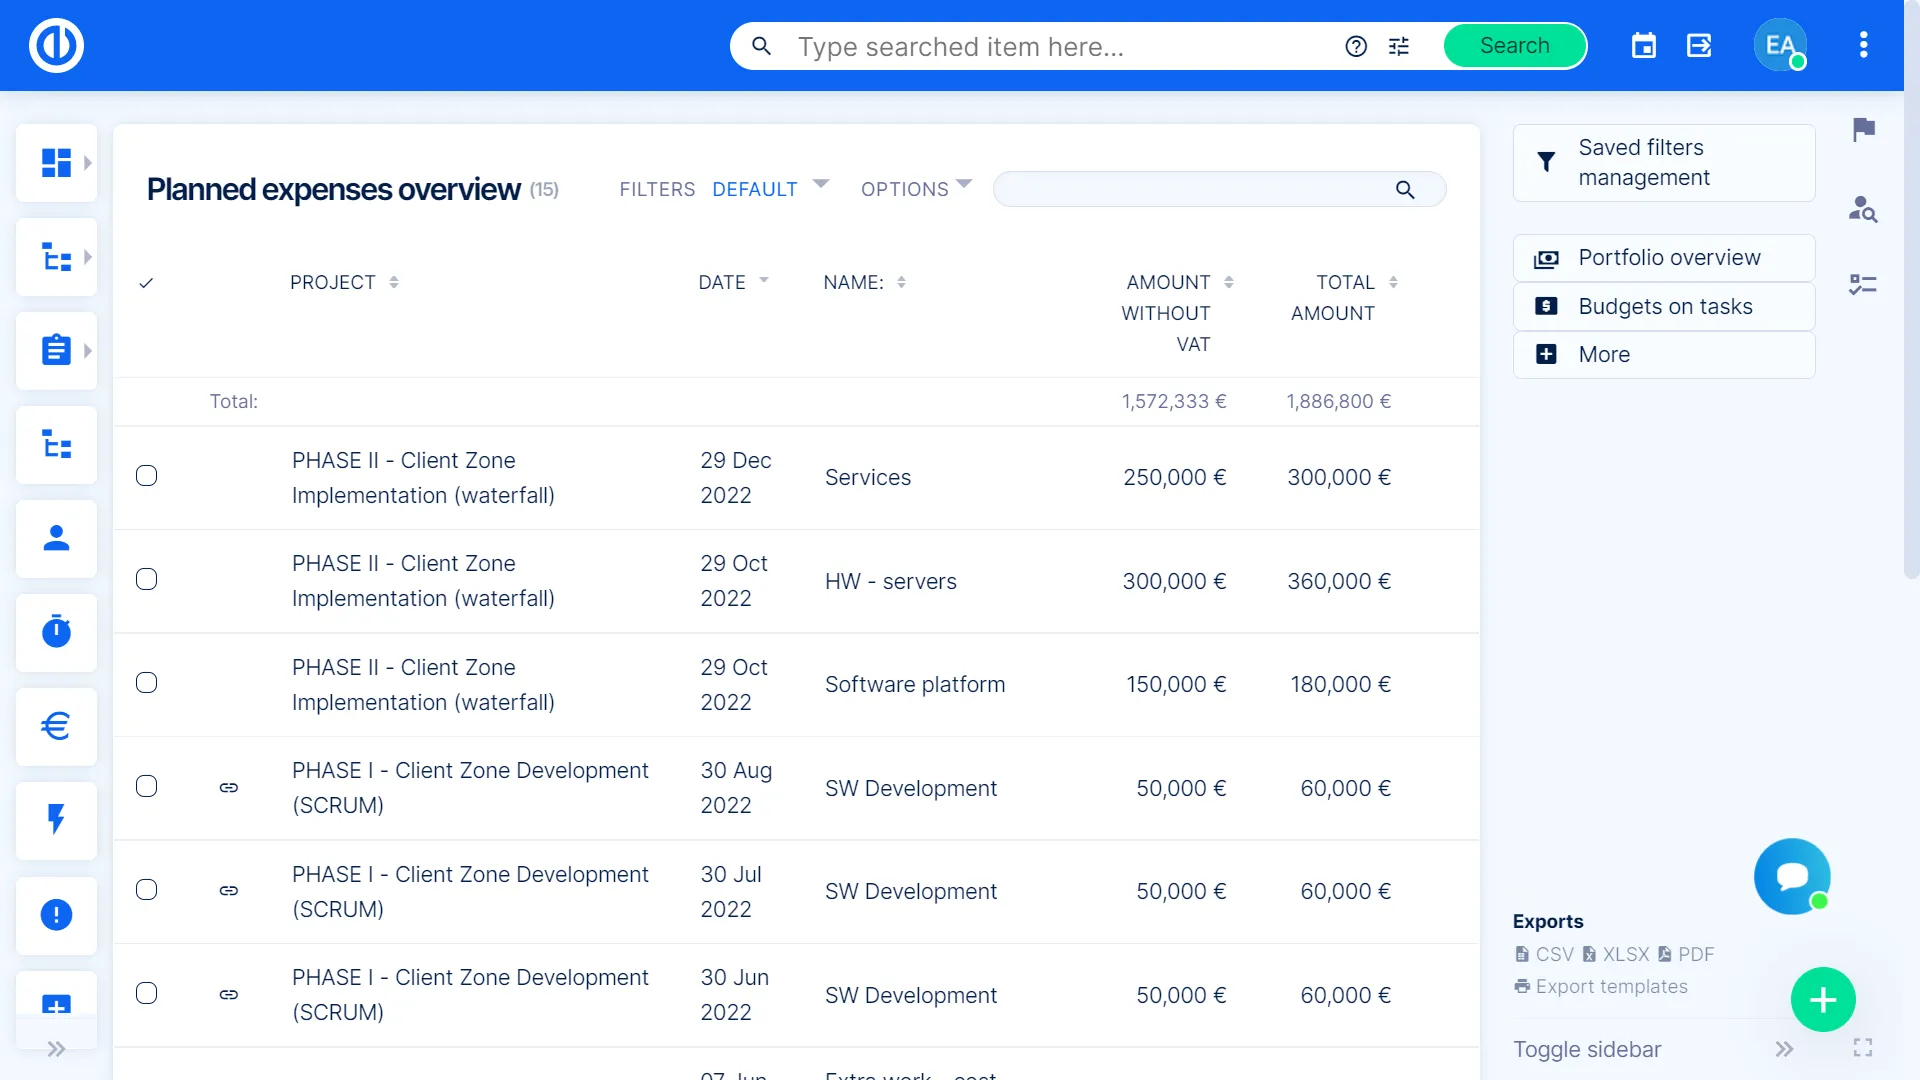
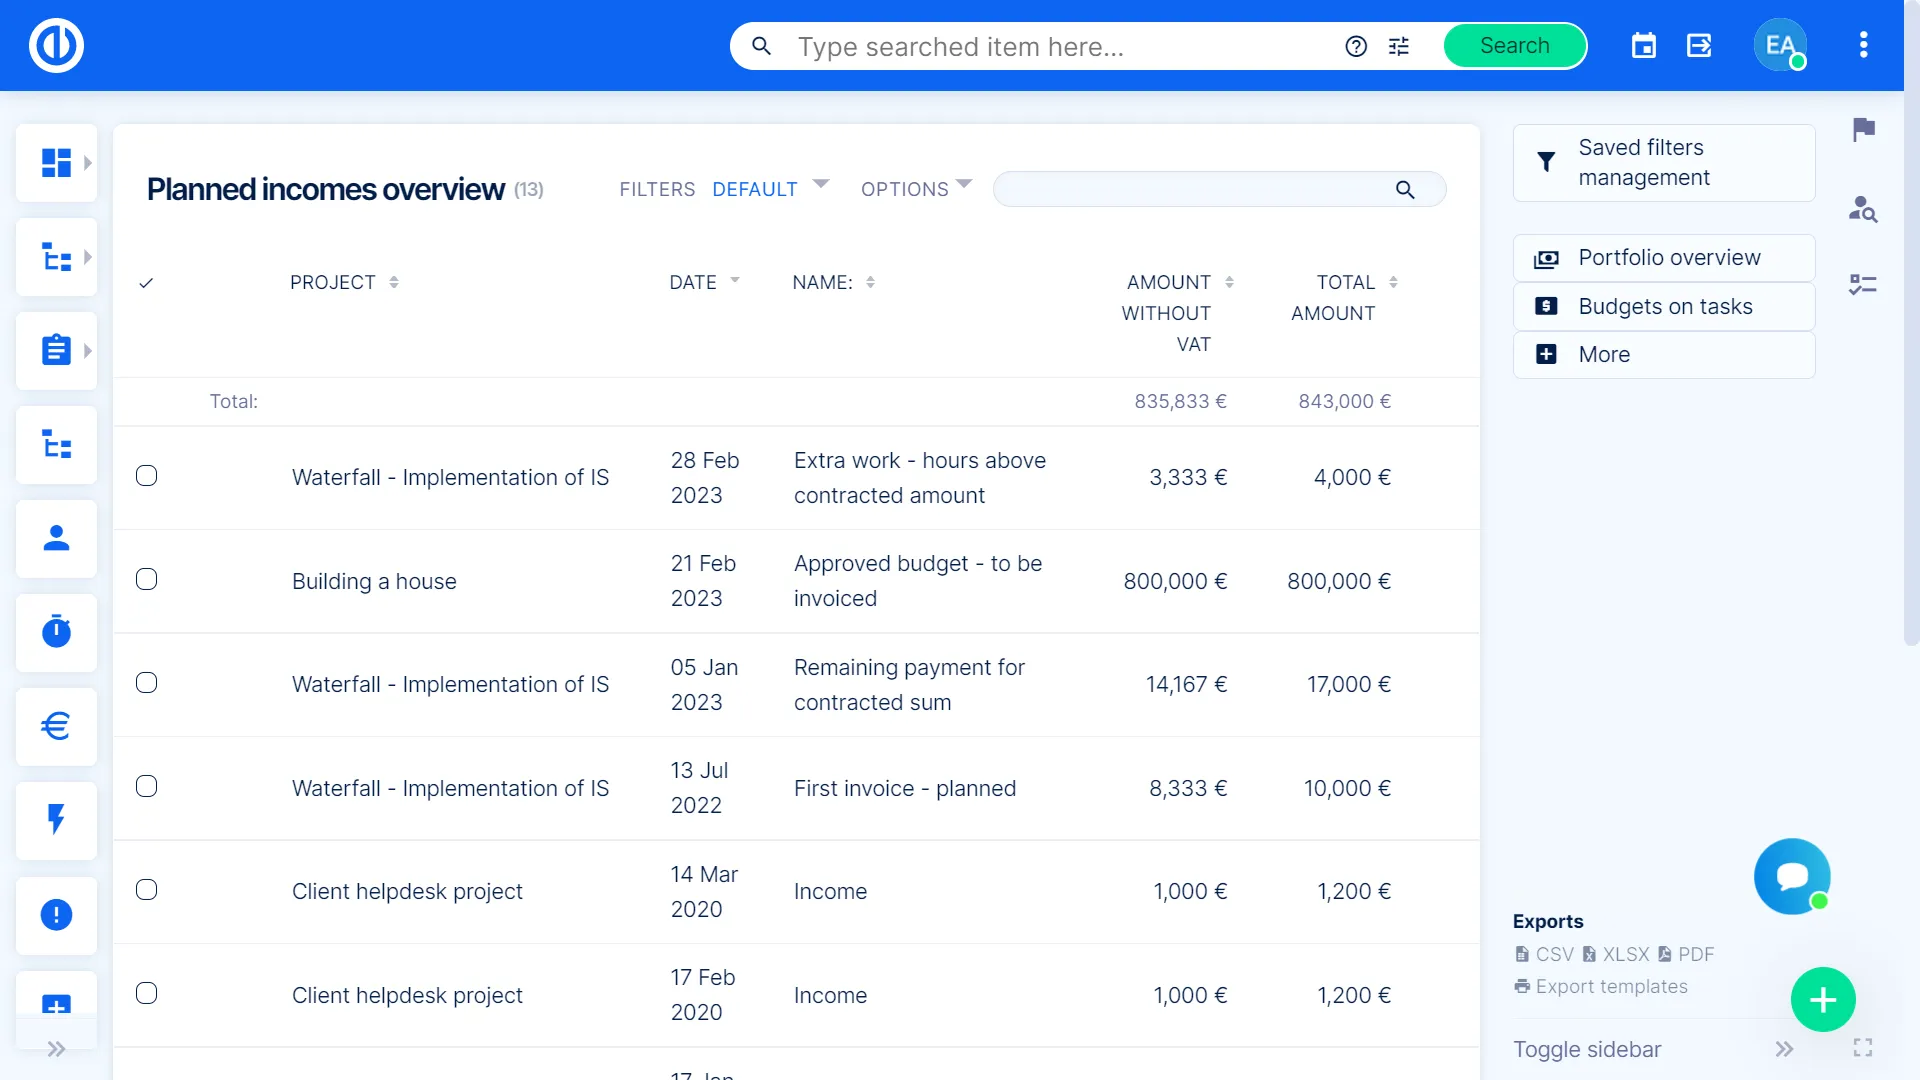
Portfolio Statement
Create portfolio statements and reports in a few clicks. You can easily create a portfolio budget or spreadsheets on spent time, resources, etc. Then, using integrated charts and graphs, you can transform them into a full report ready for presentation.

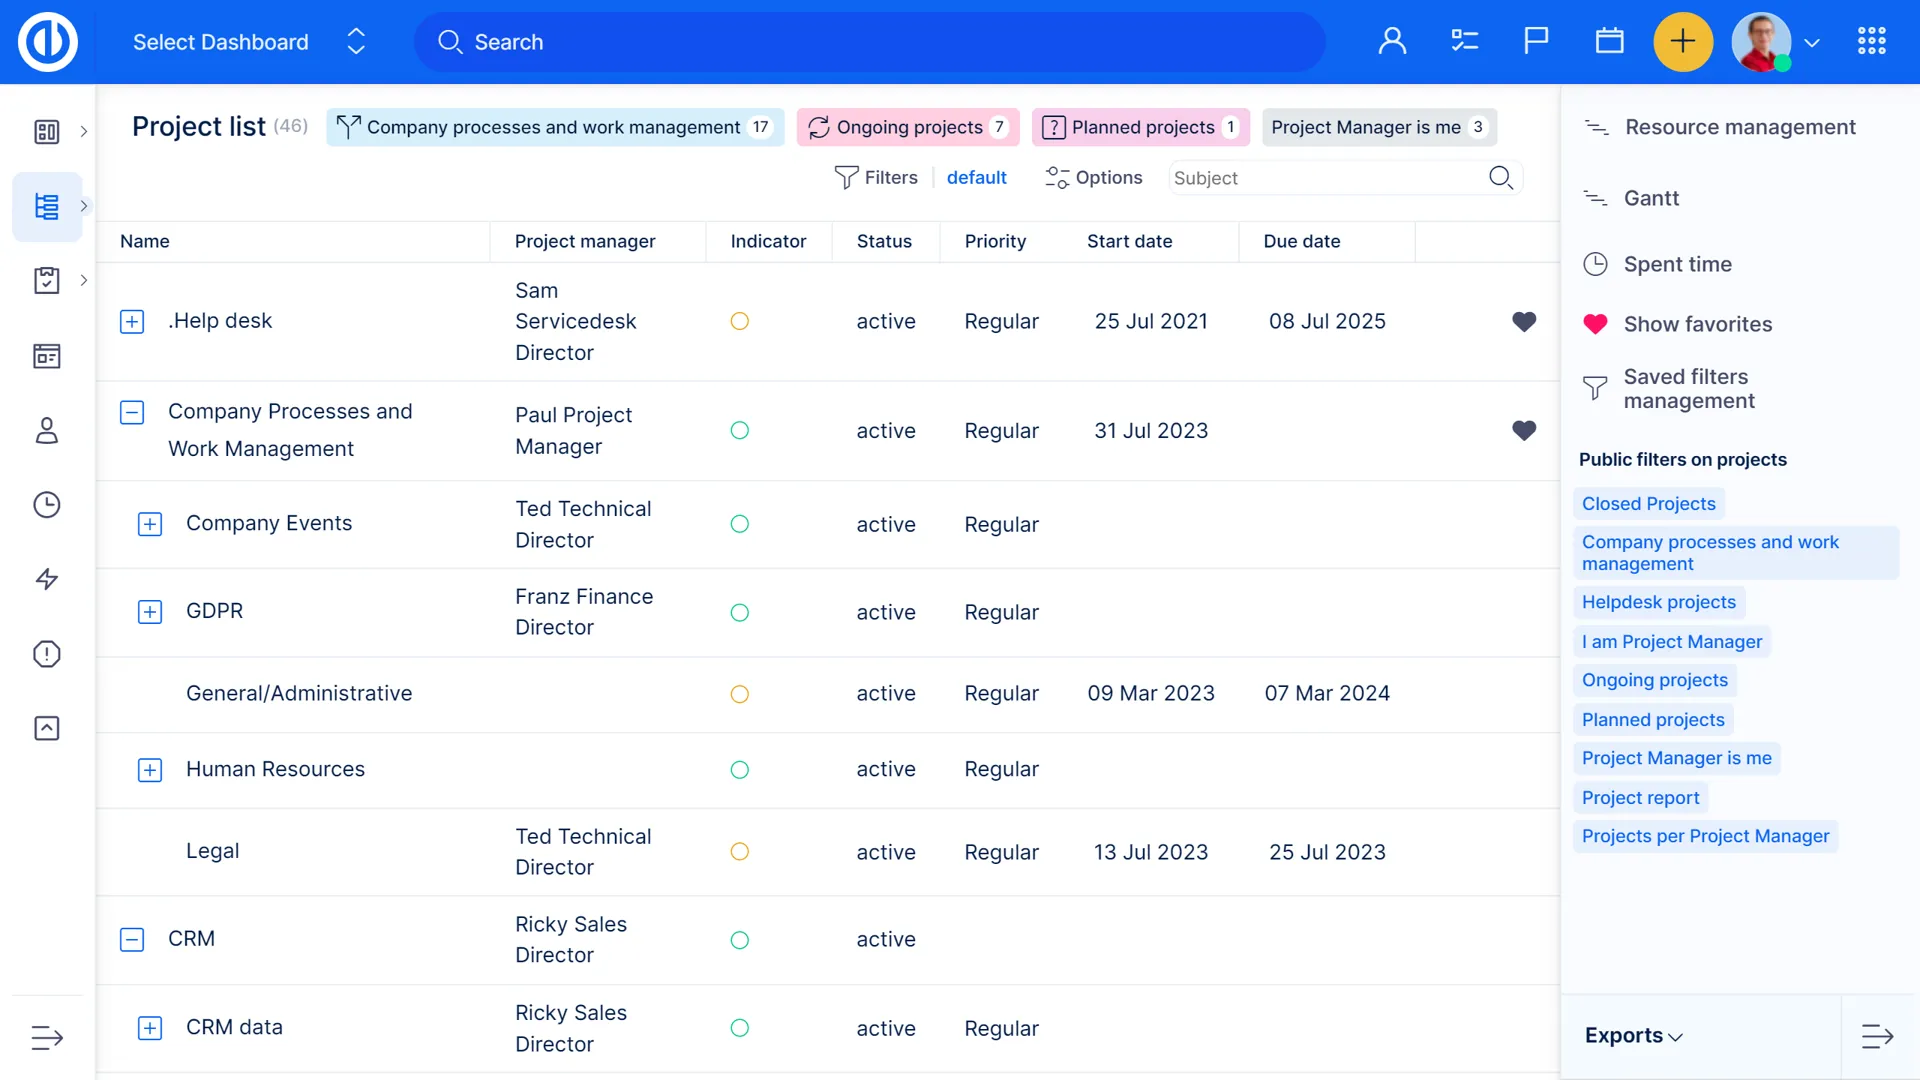
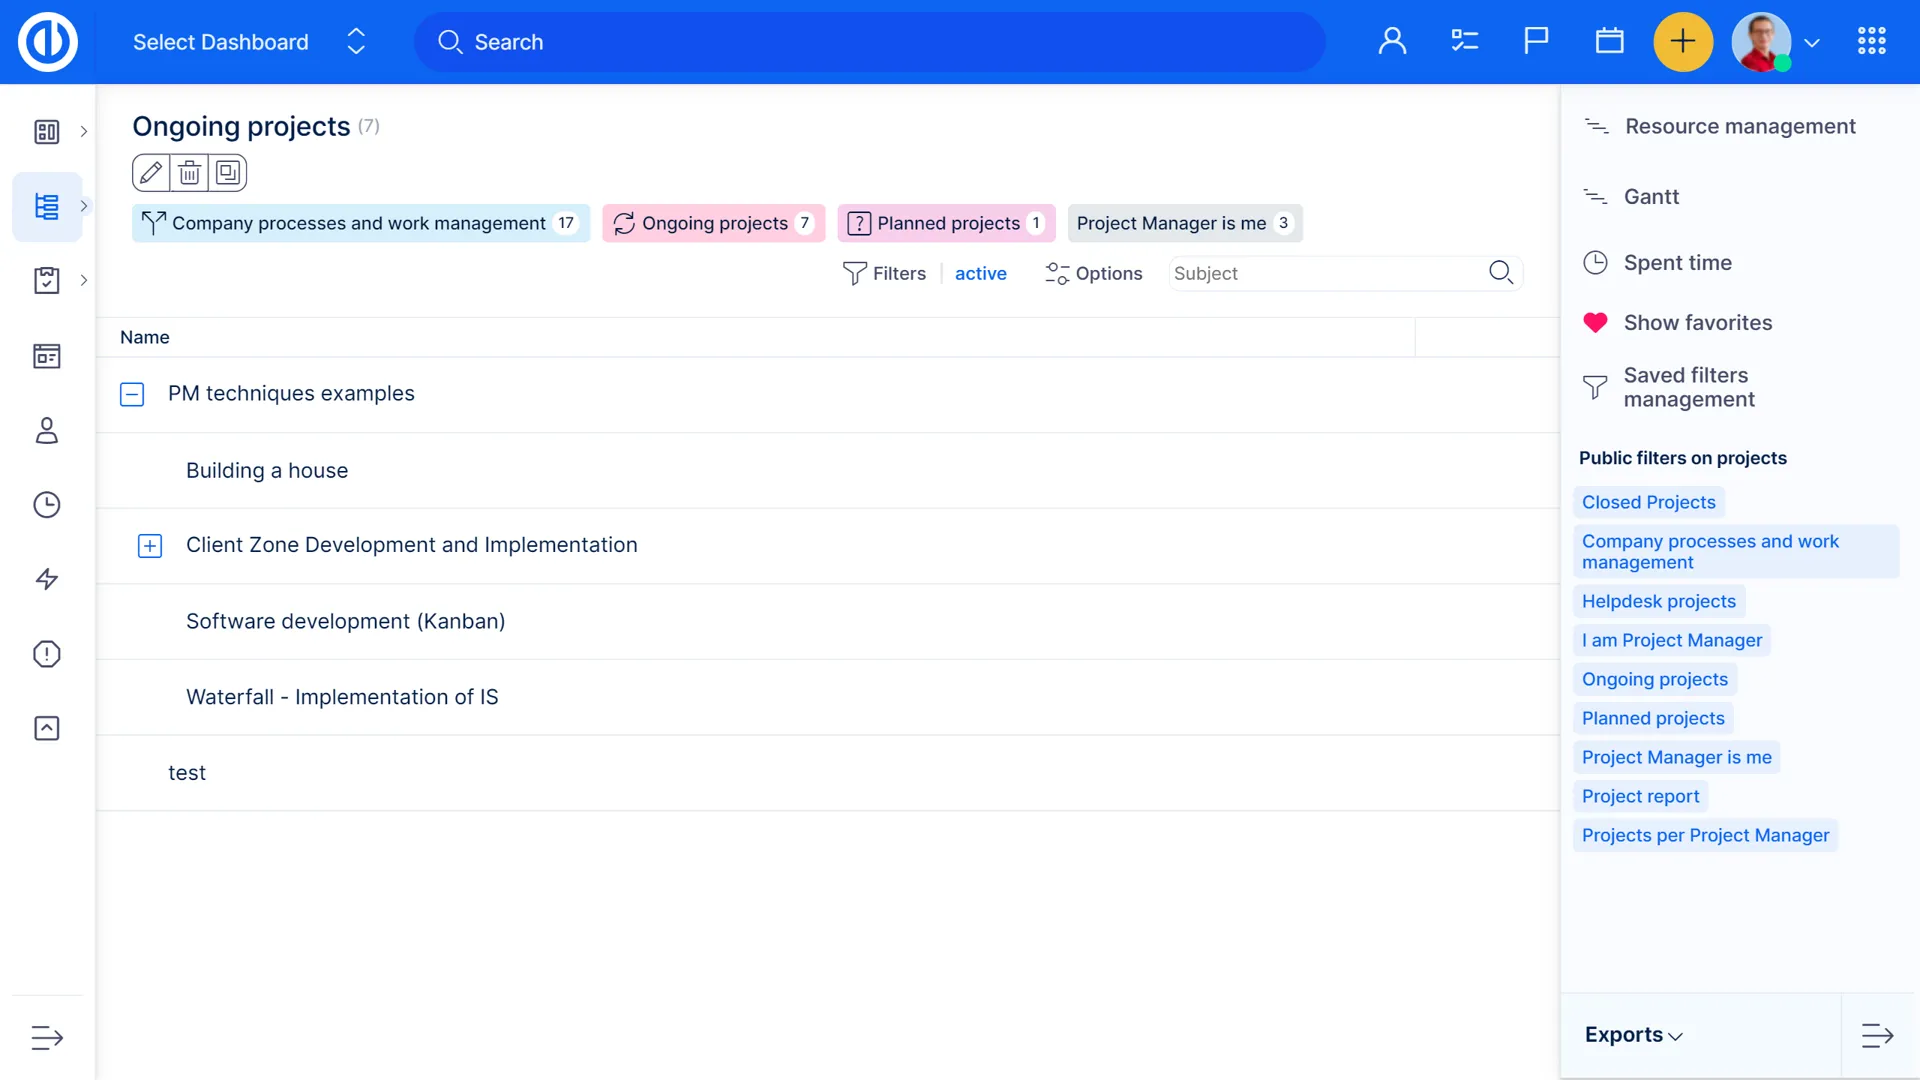
Portfolio Tree
Get an overview of all your projects at a glance with Portfolio Tree. It allows you to see all your projects with color indicators for overdue projects/tasks, the number of spent and remaining hours, current statuses, and other important project features.

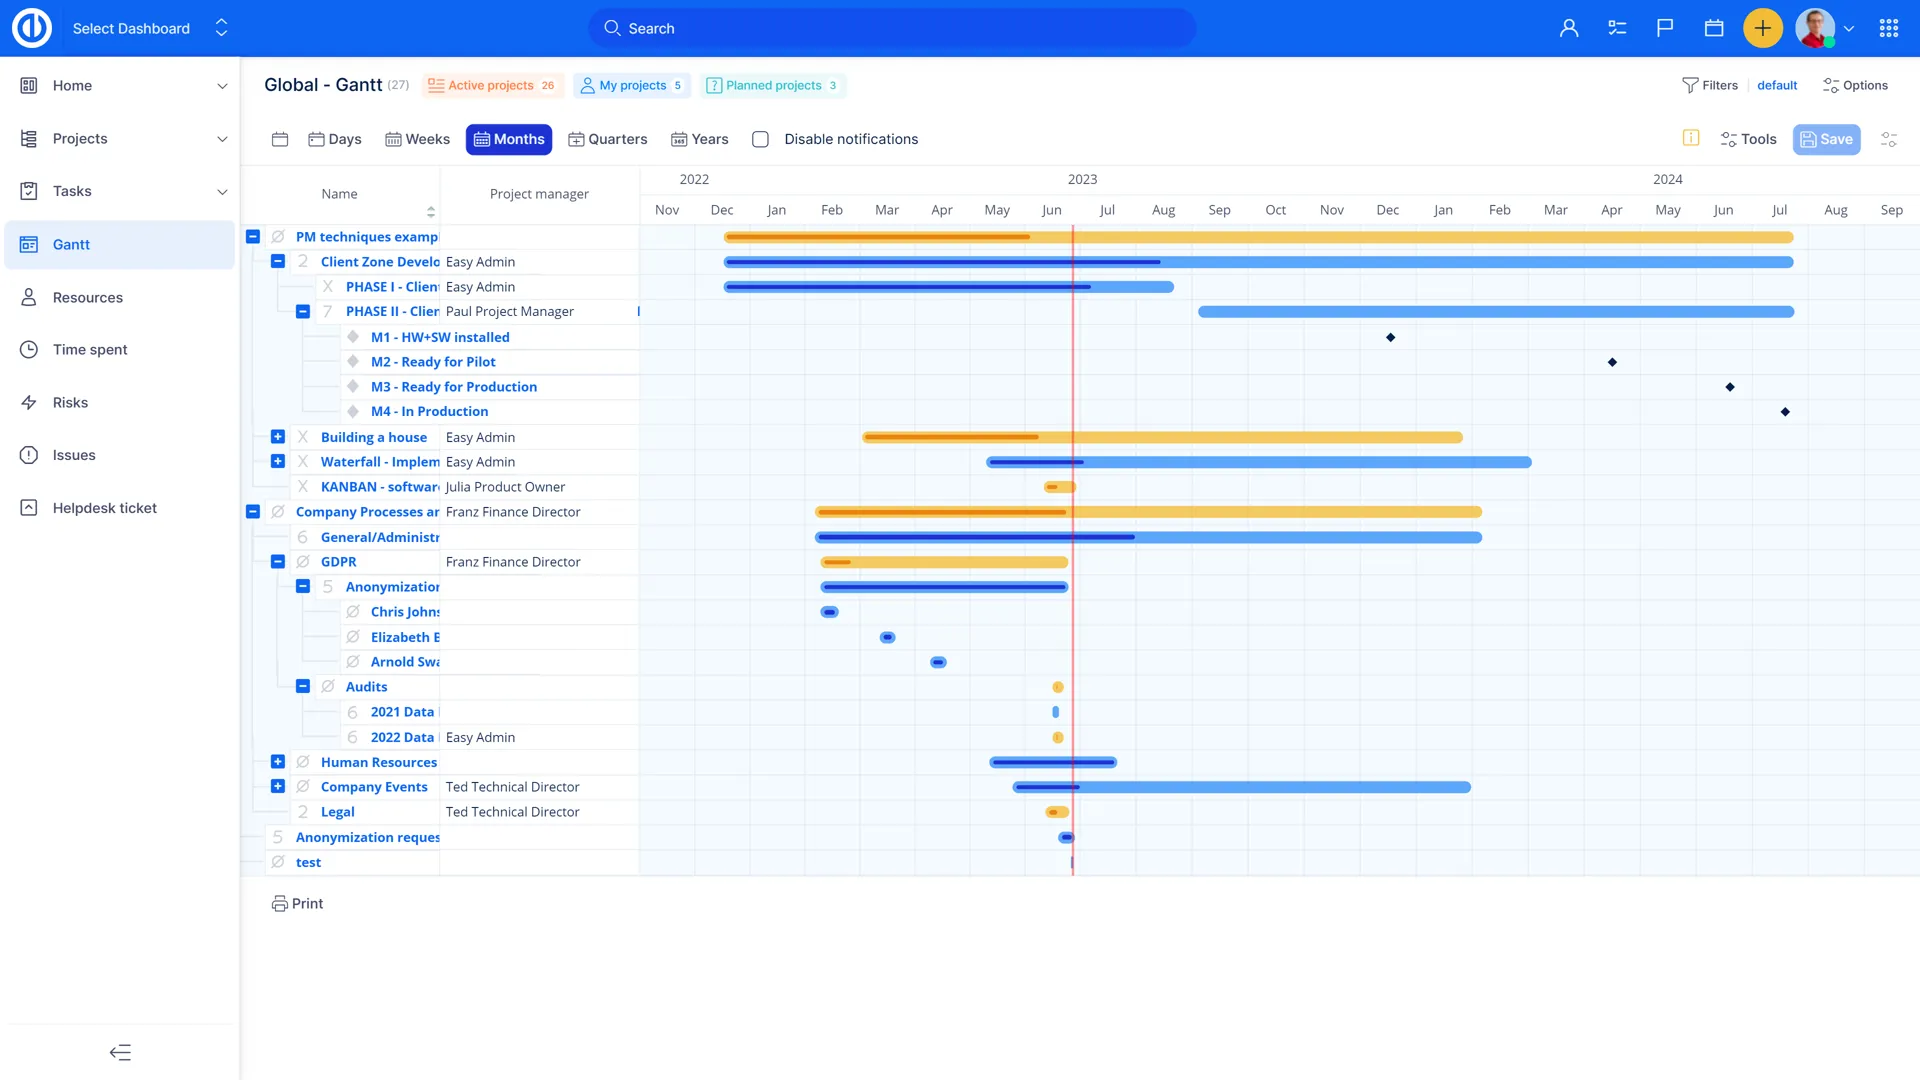
Global Gantt
A must-have for every portfolio manager — Global Gantt, enables accurately planned projects and eagle-view management. It allows you to instantly see current vs. planned performance, as well as resource and cash flows that are spent on each project.
Project Controlling & Reporting

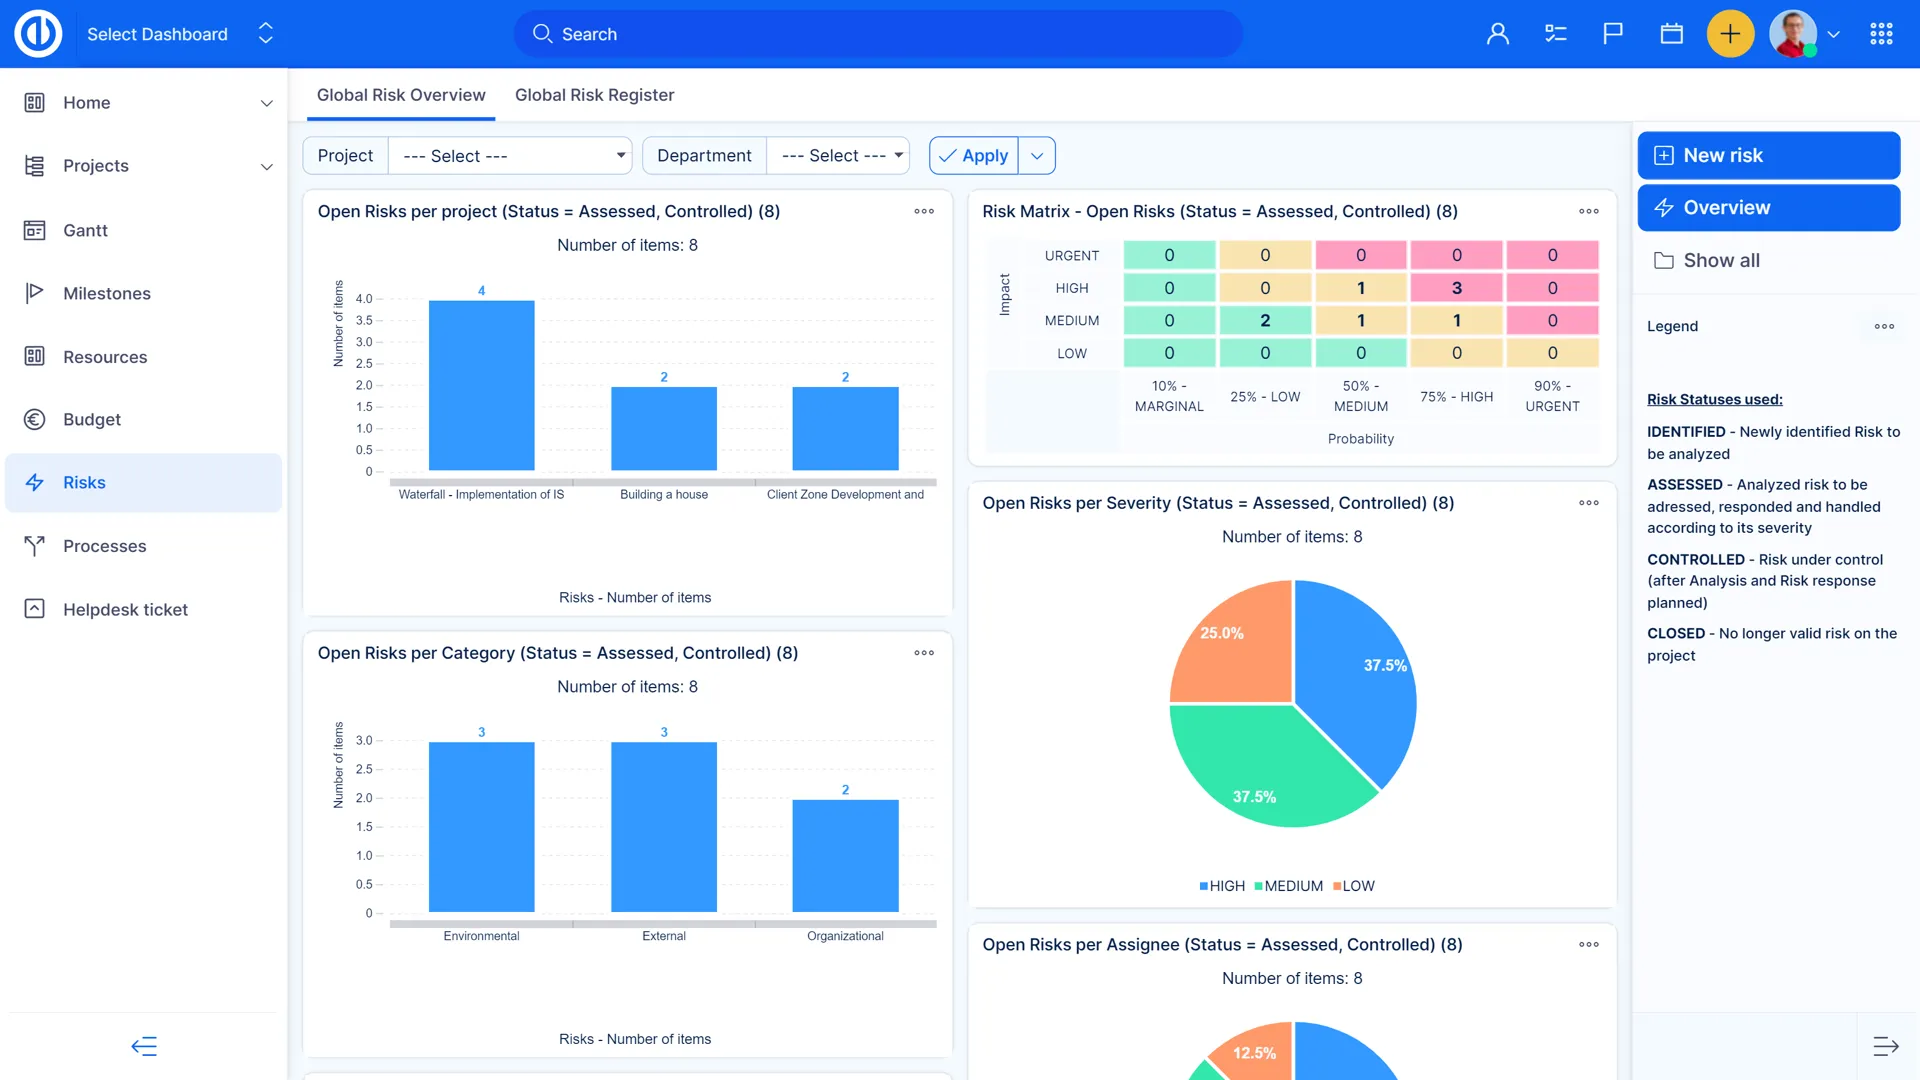
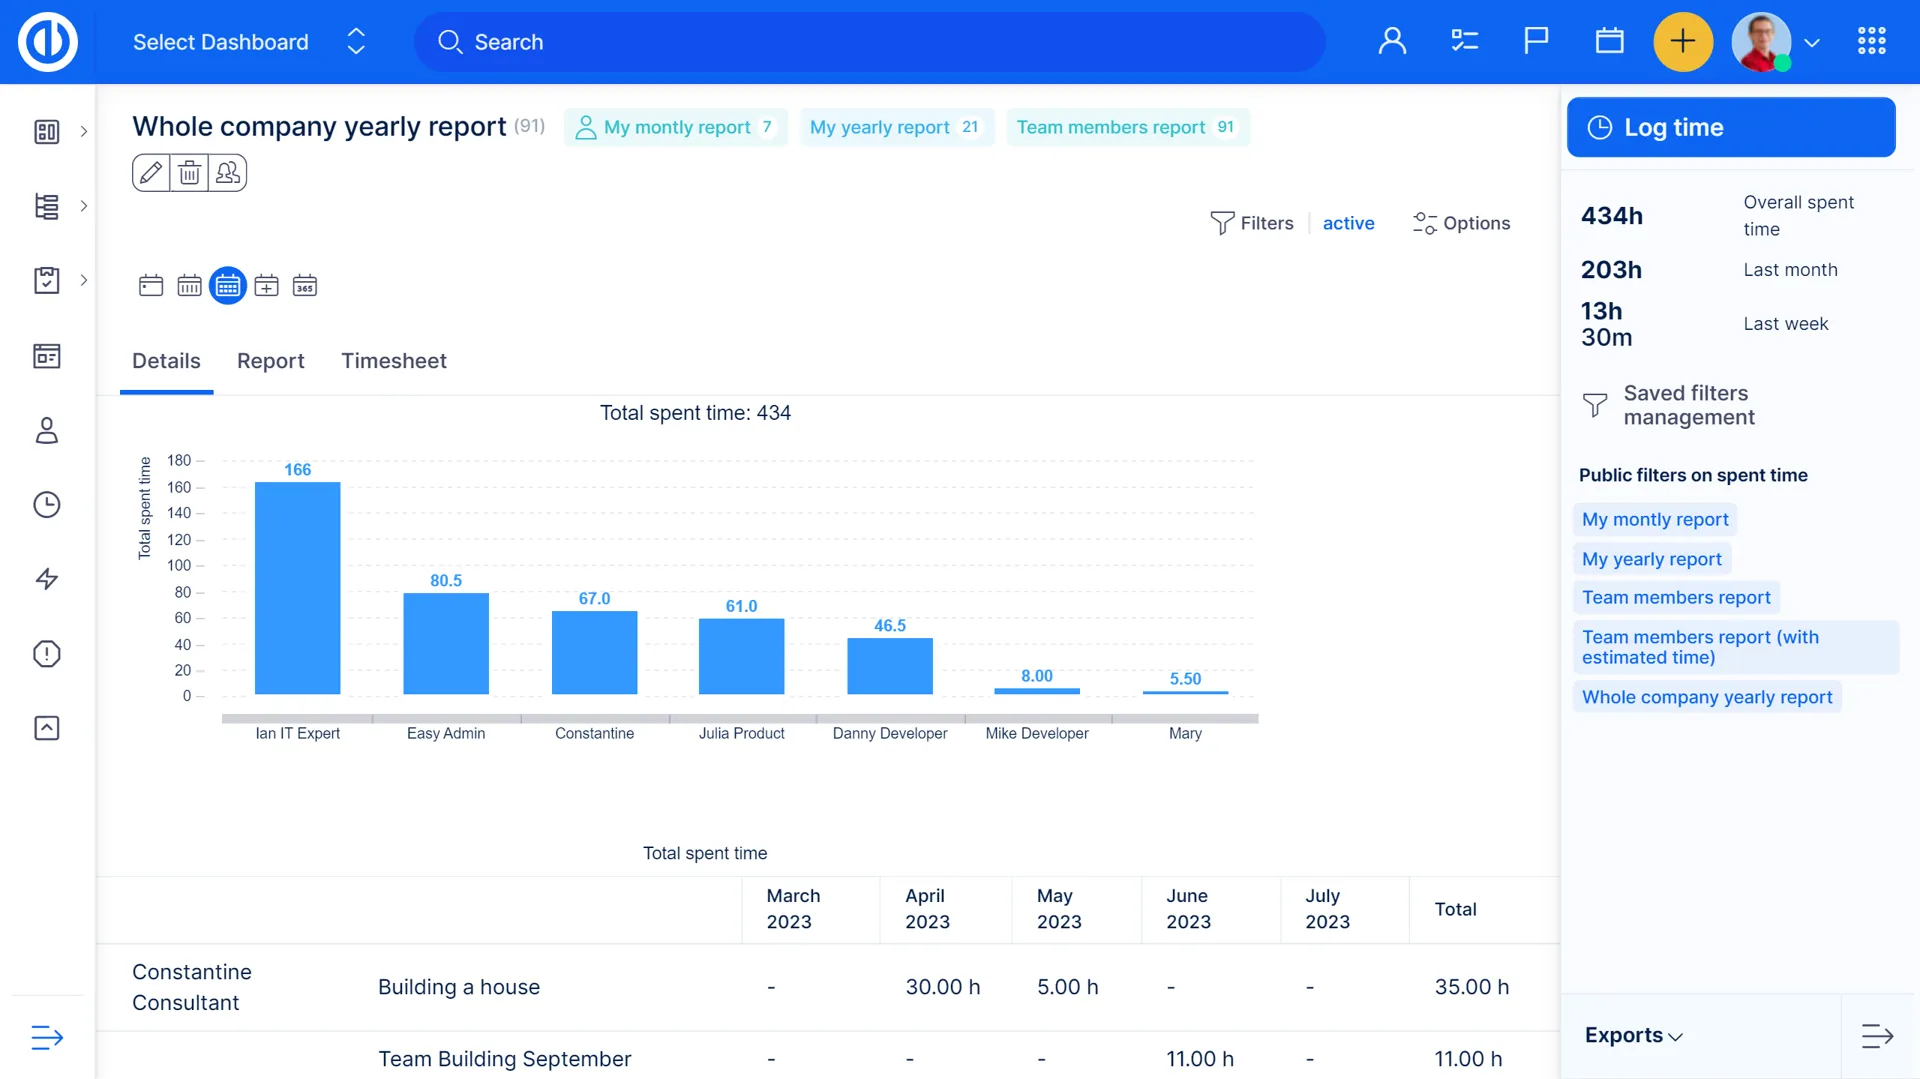
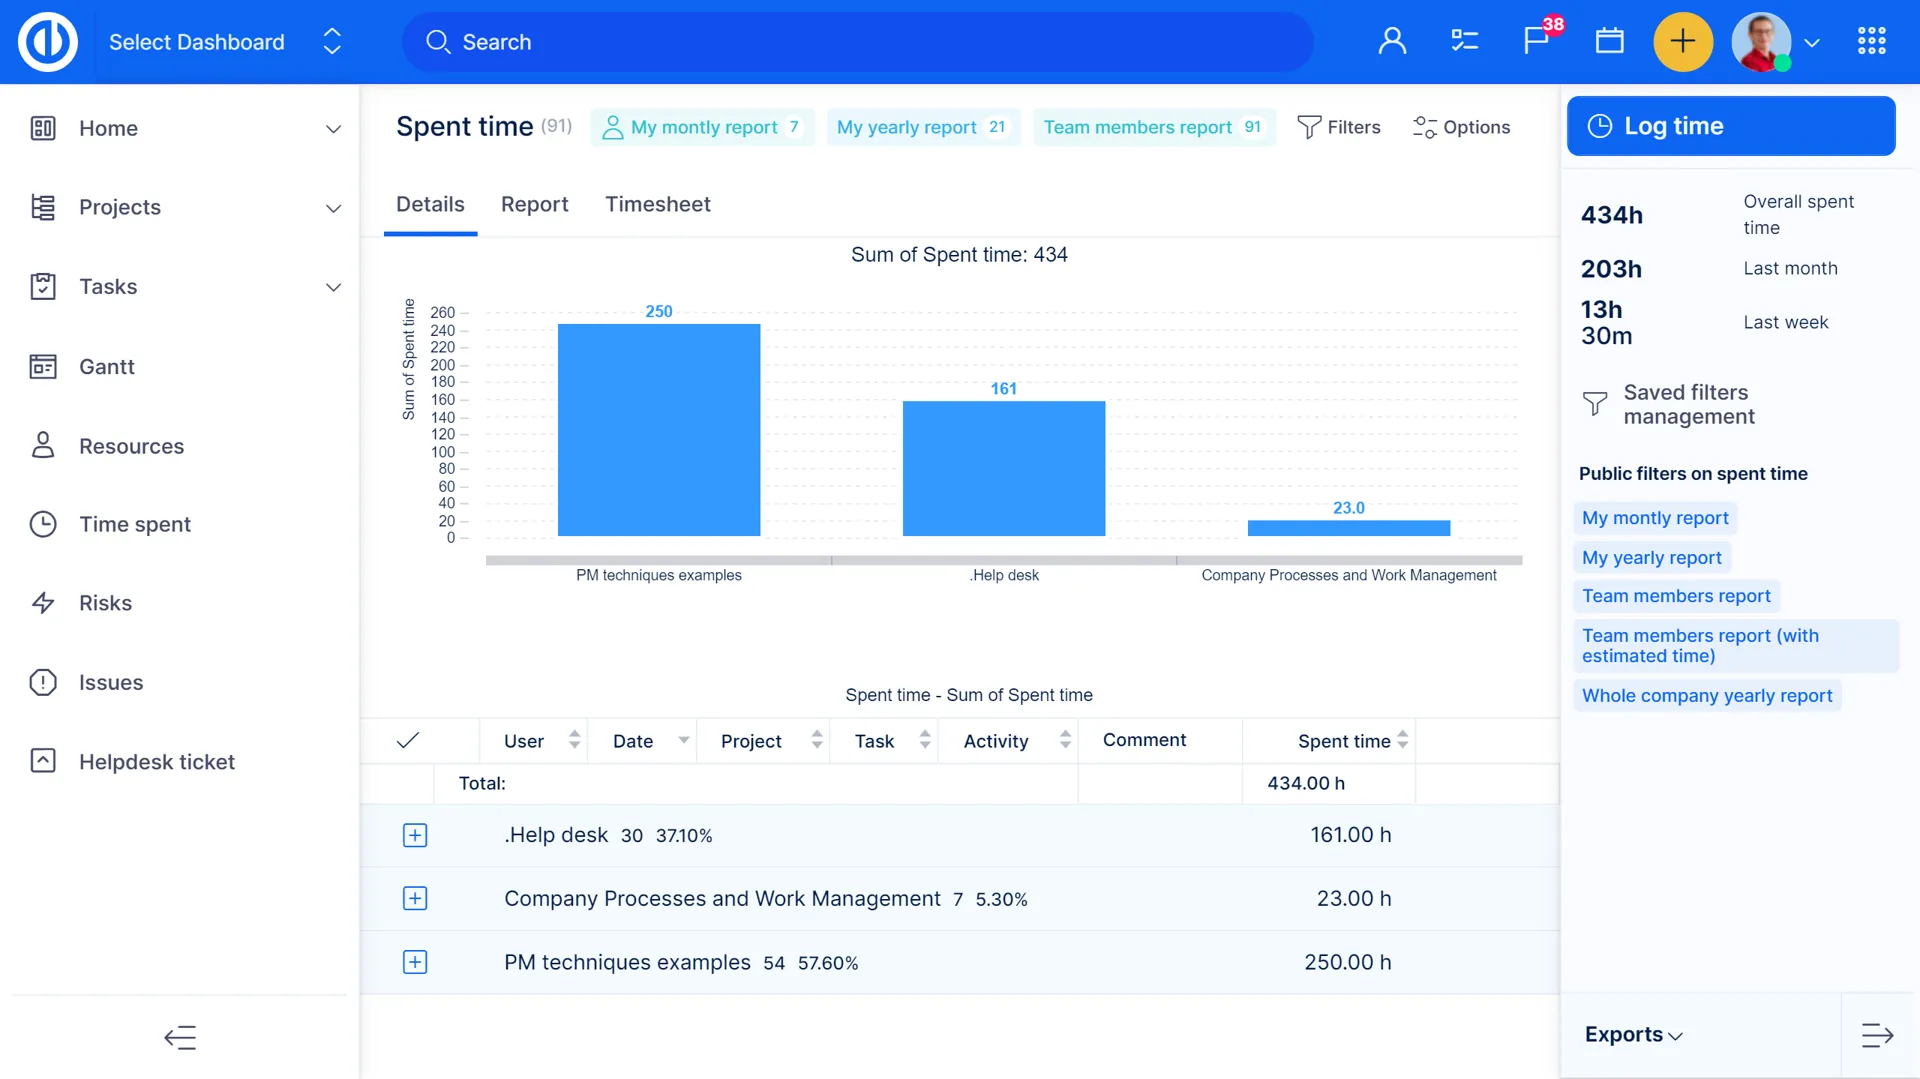
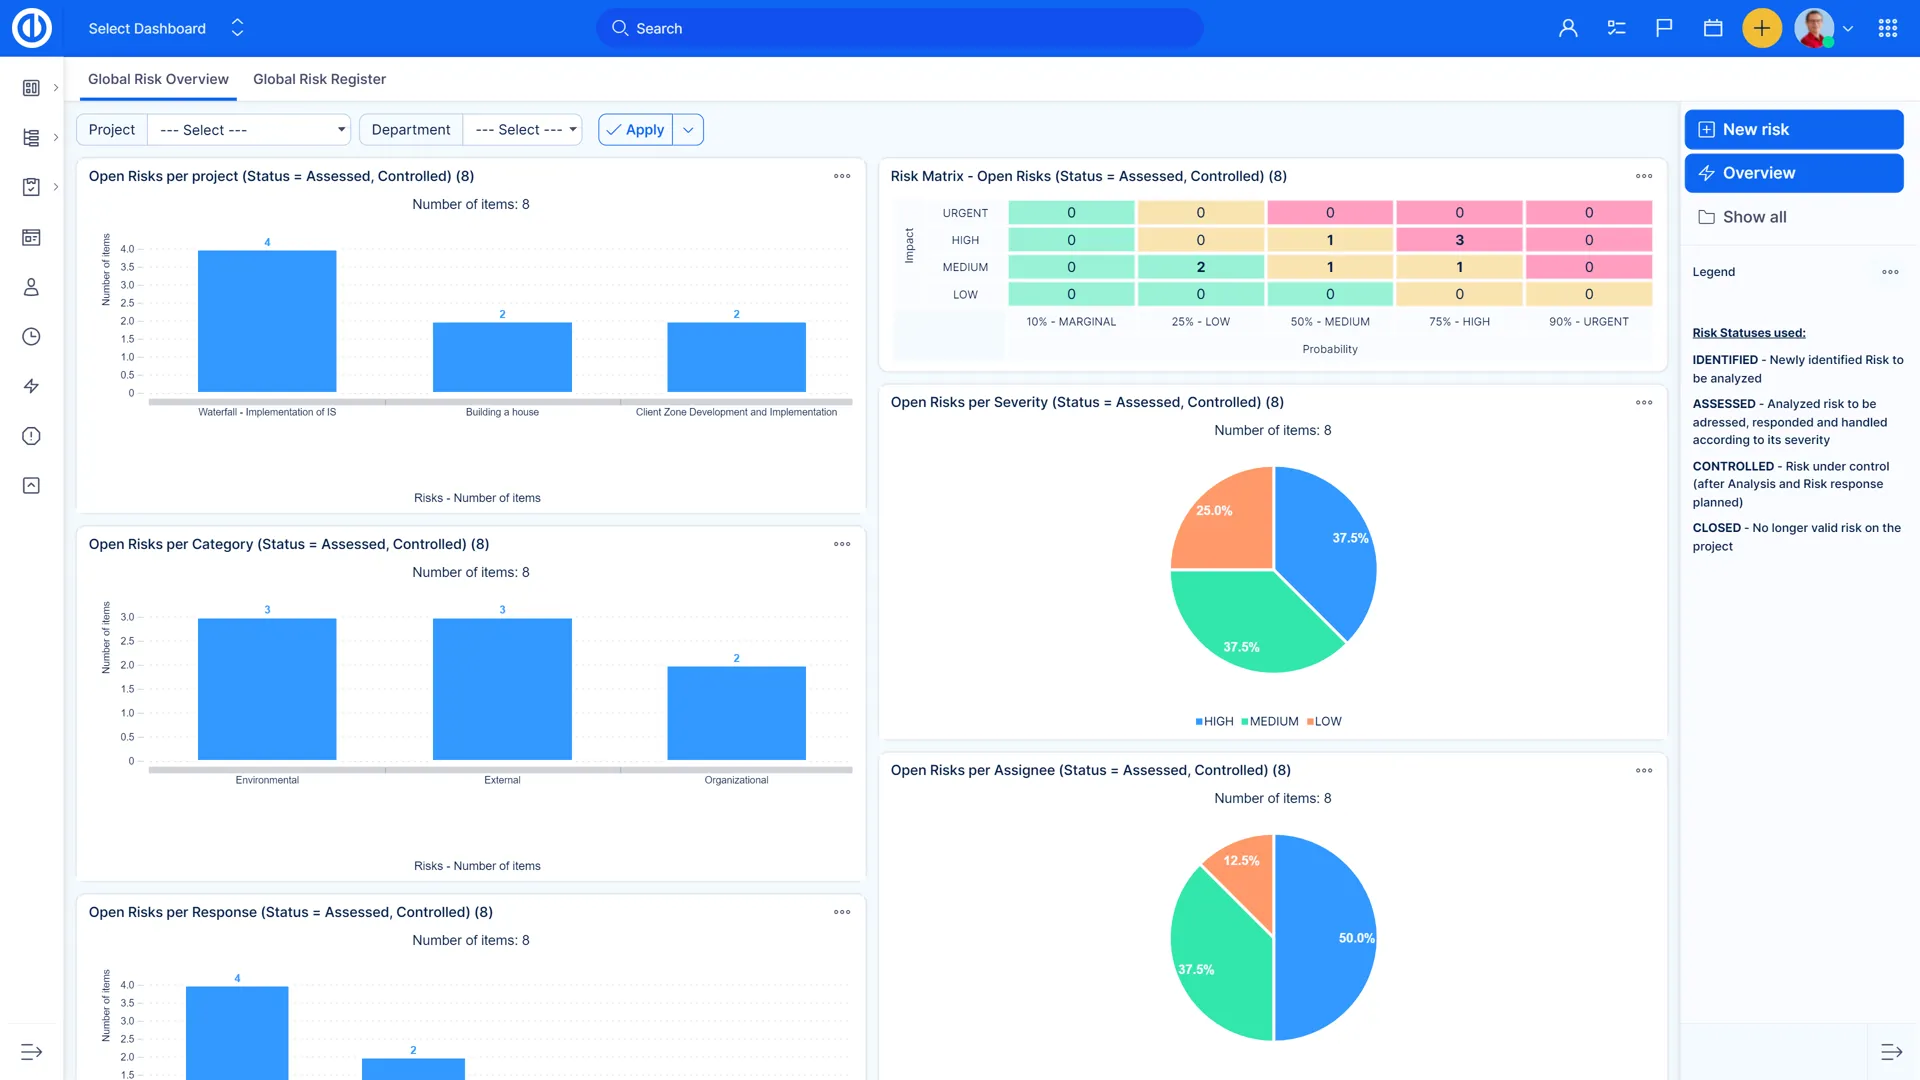
Reporting tools – graphs & charts
Visualize available statistics using pie, bar, and line graphs. Create charts from any list of entries, and in just a couple clicks, prepare a report on your project’s performance and demonstrate what needs to be improved.


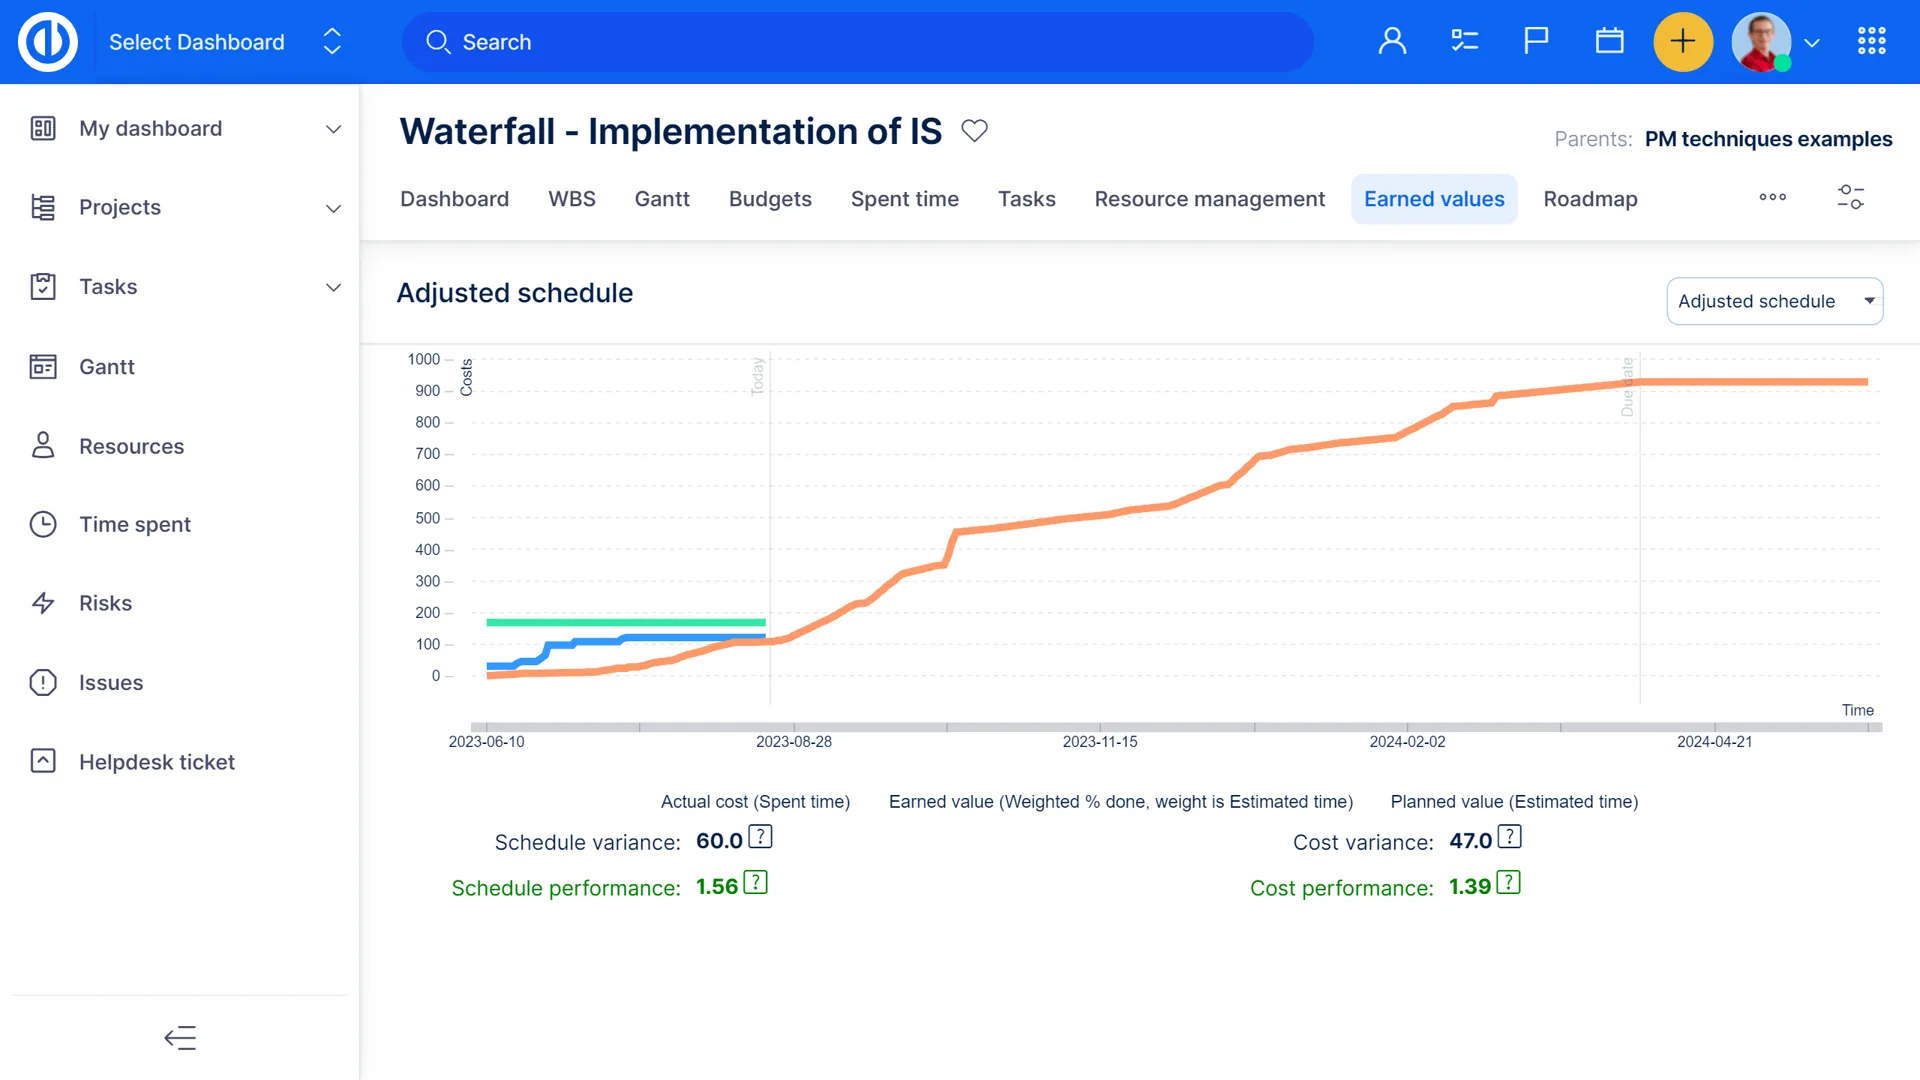
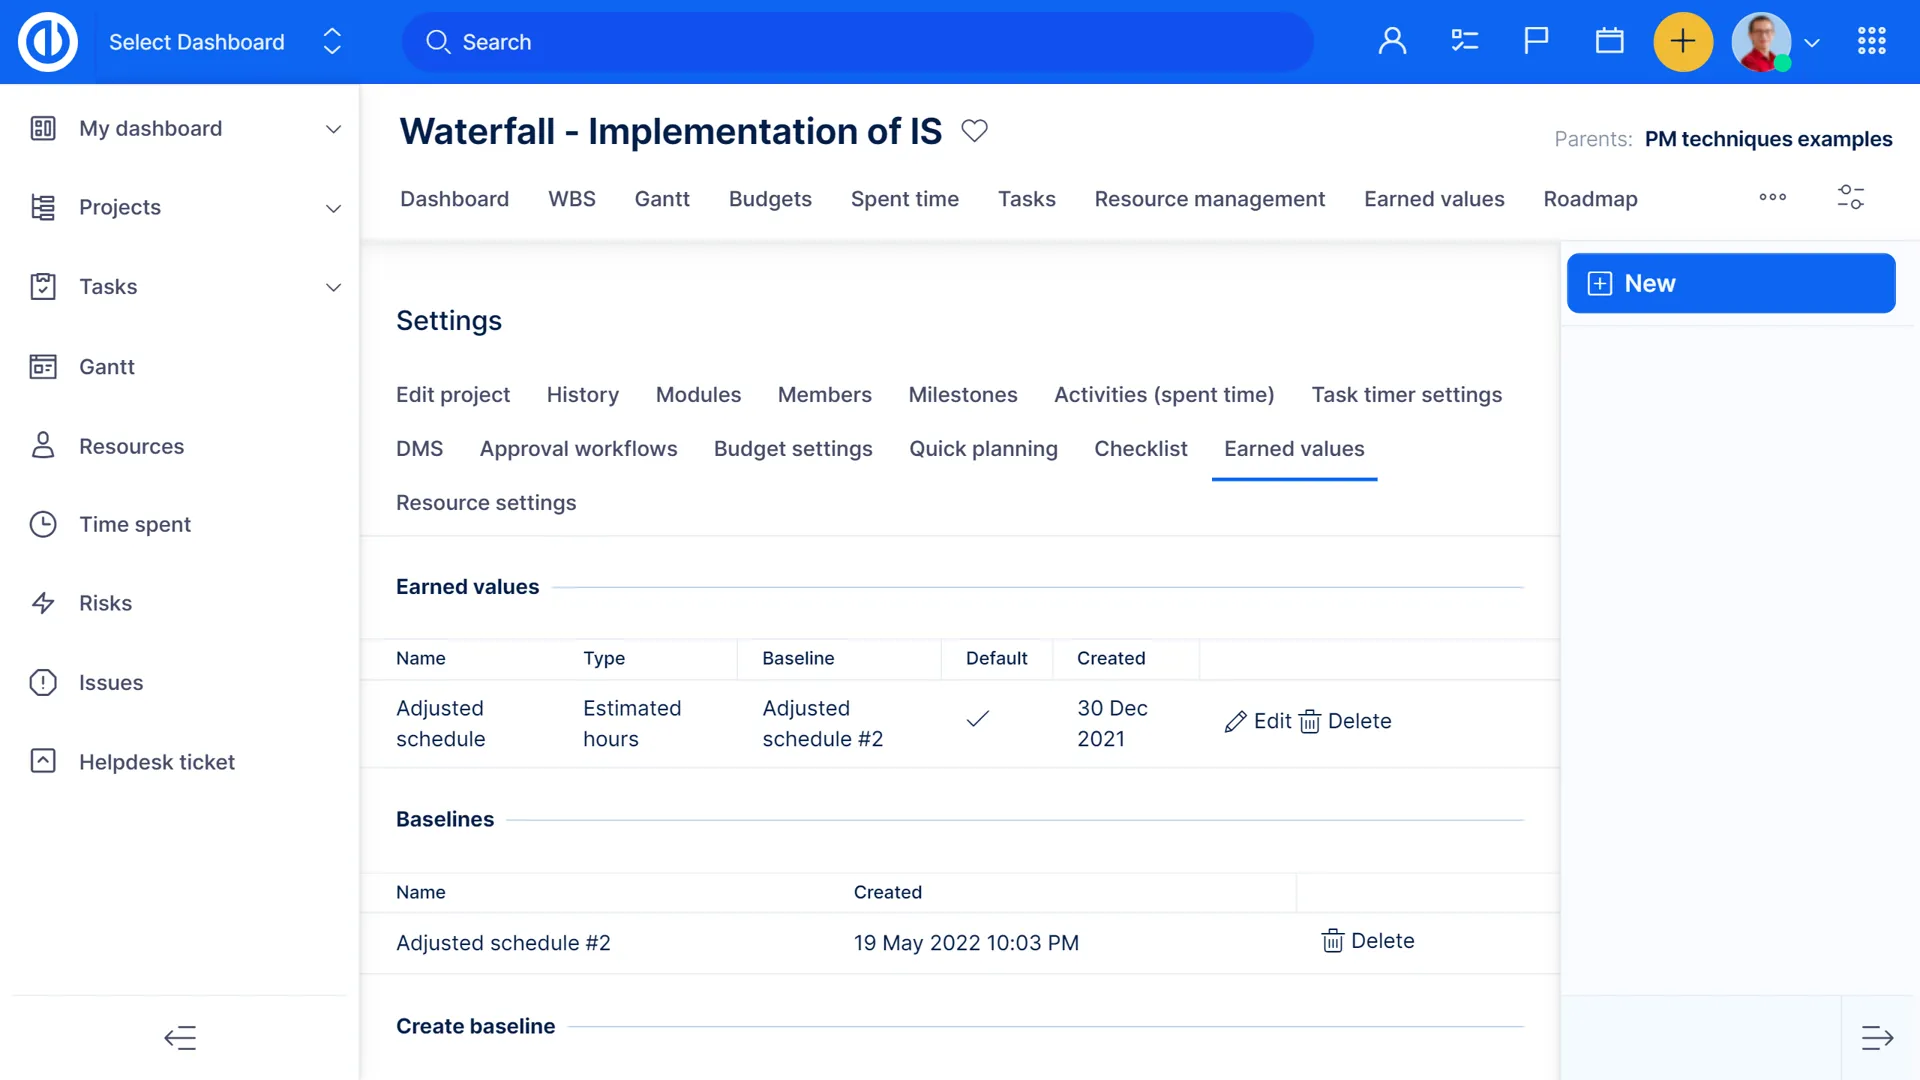
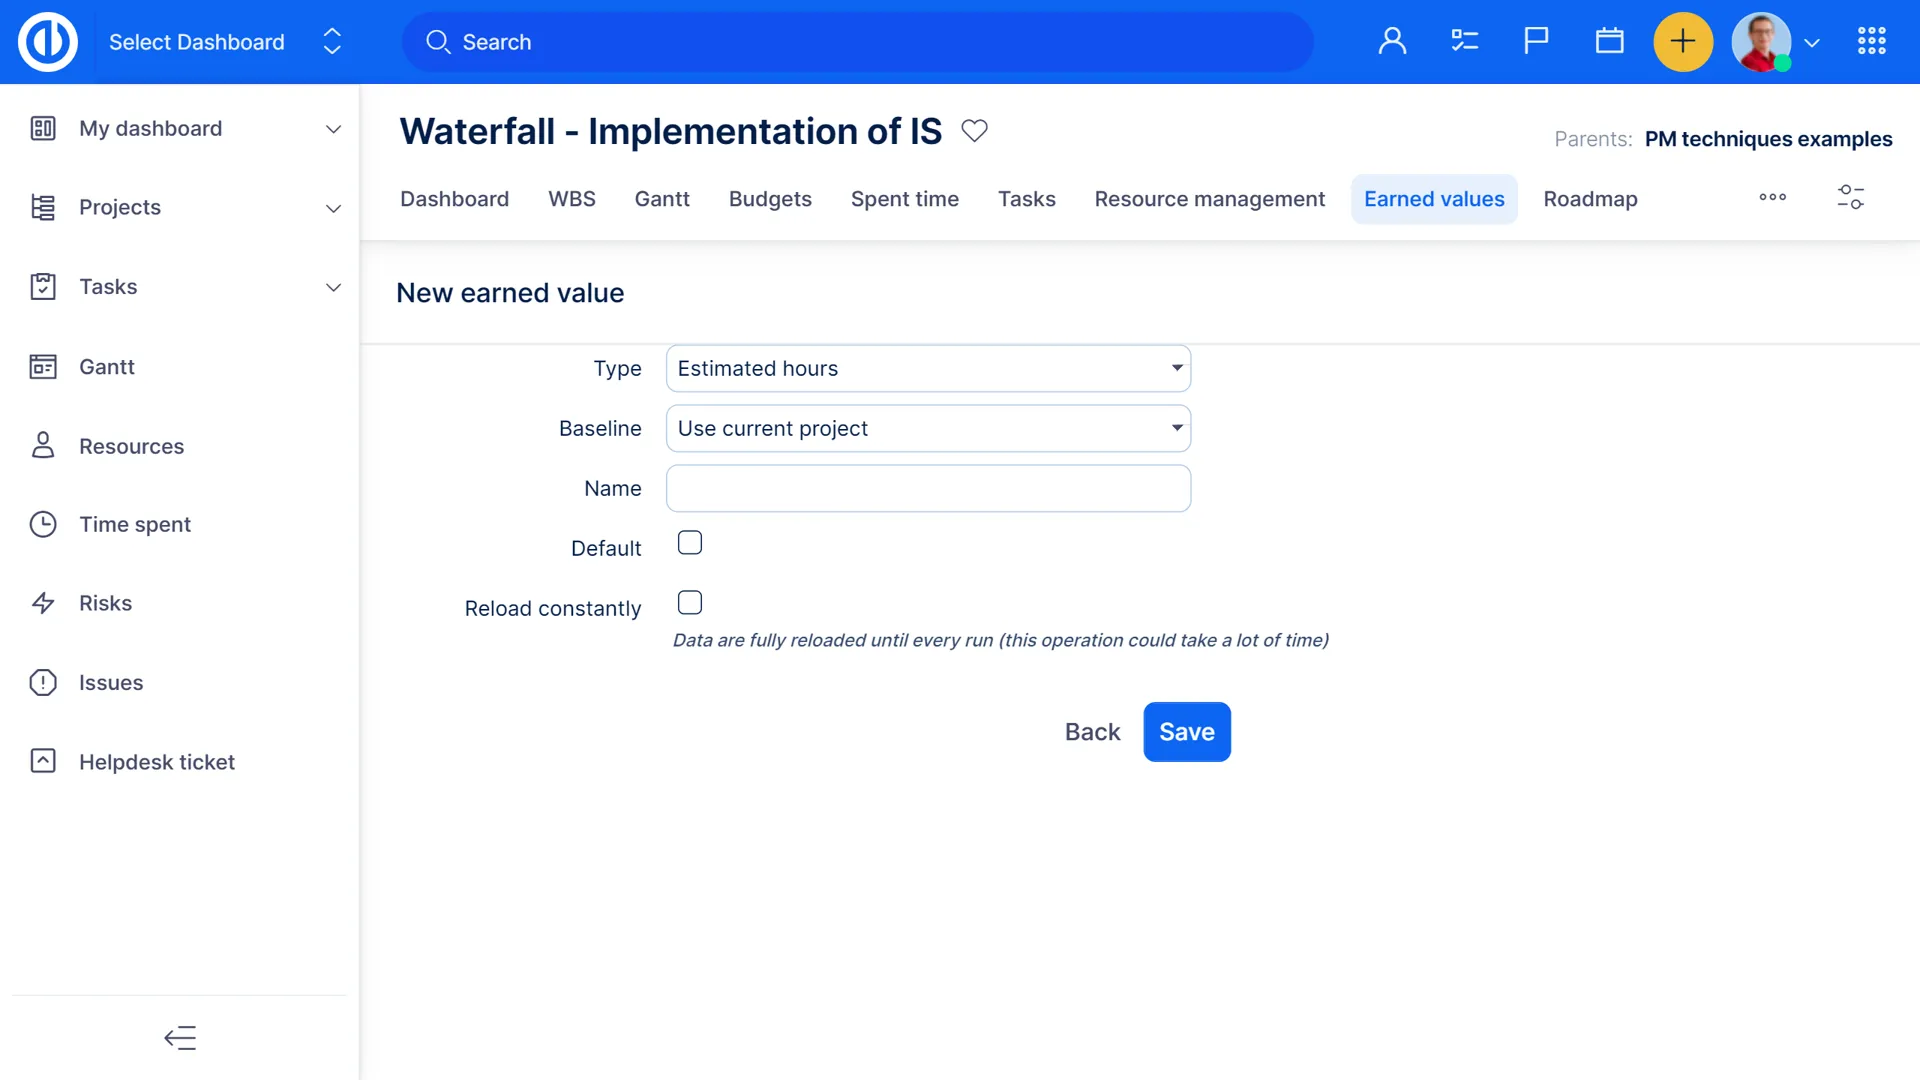
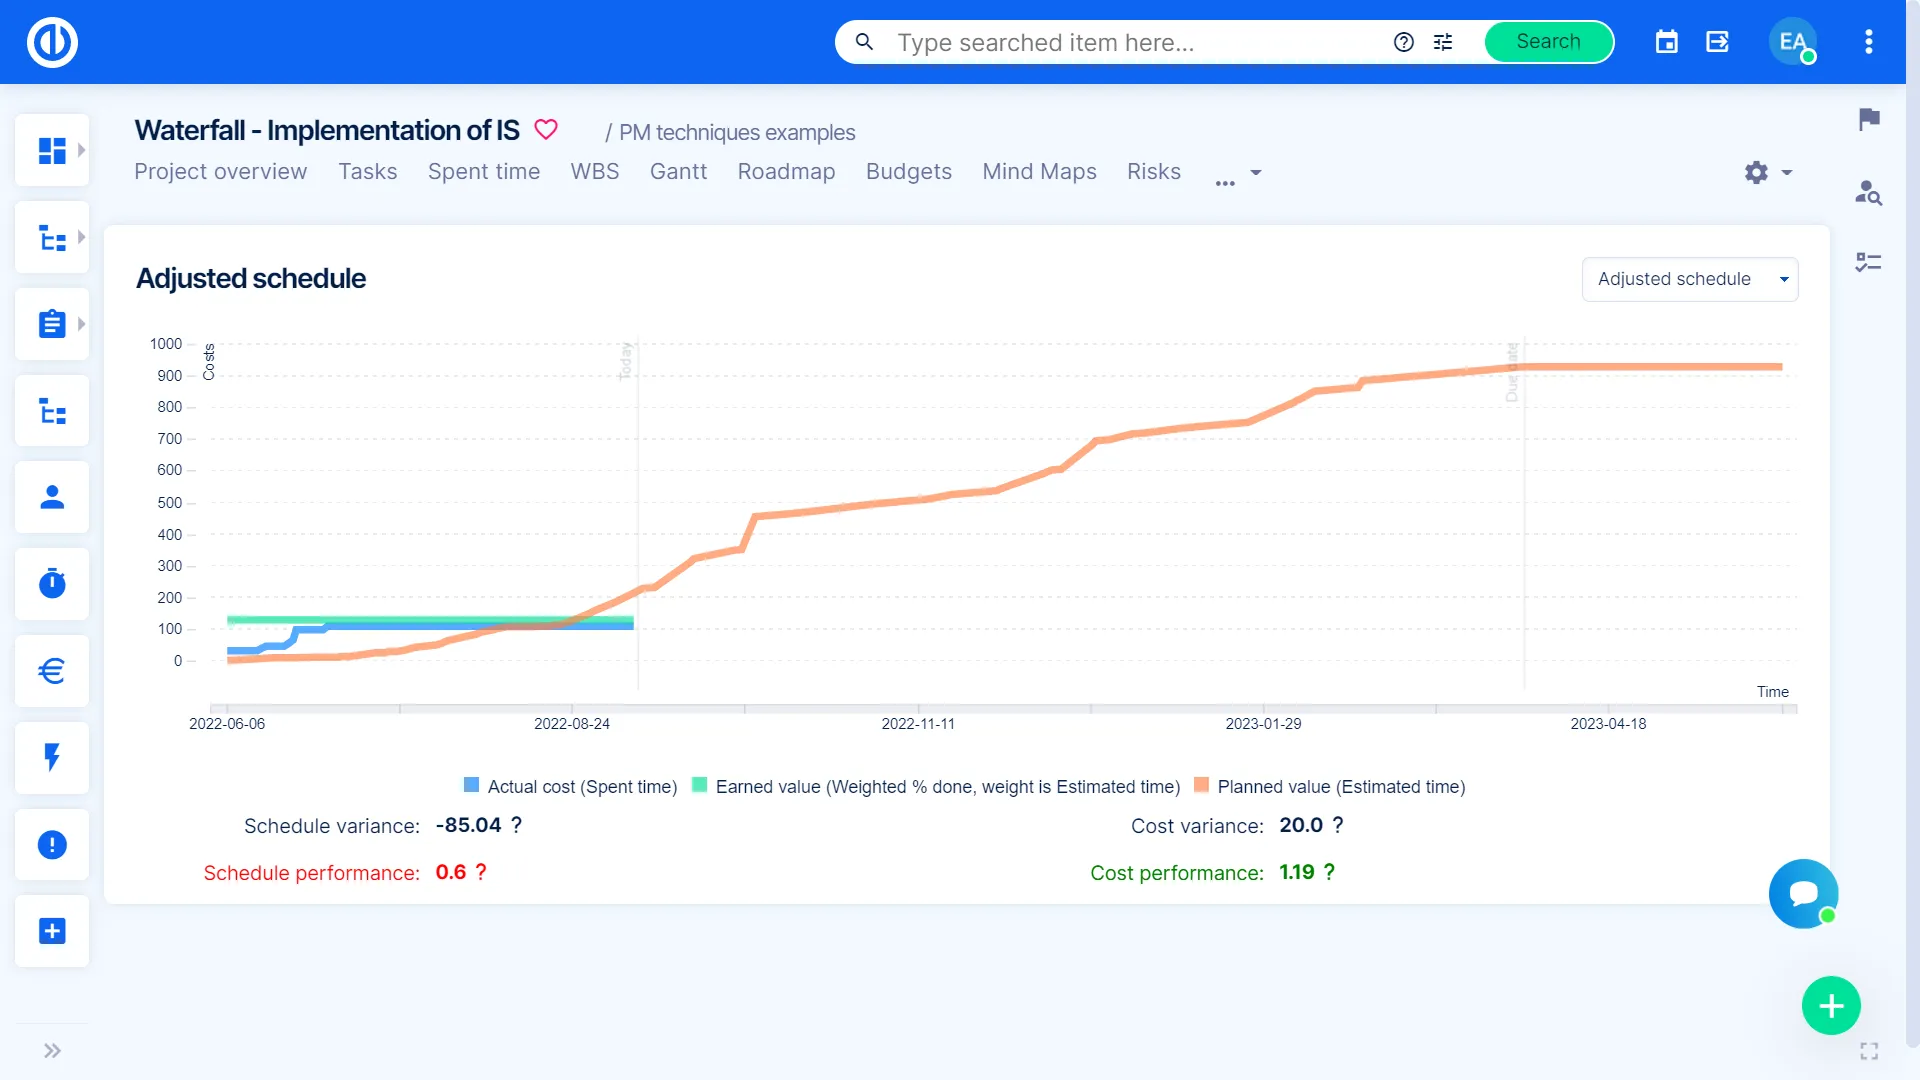
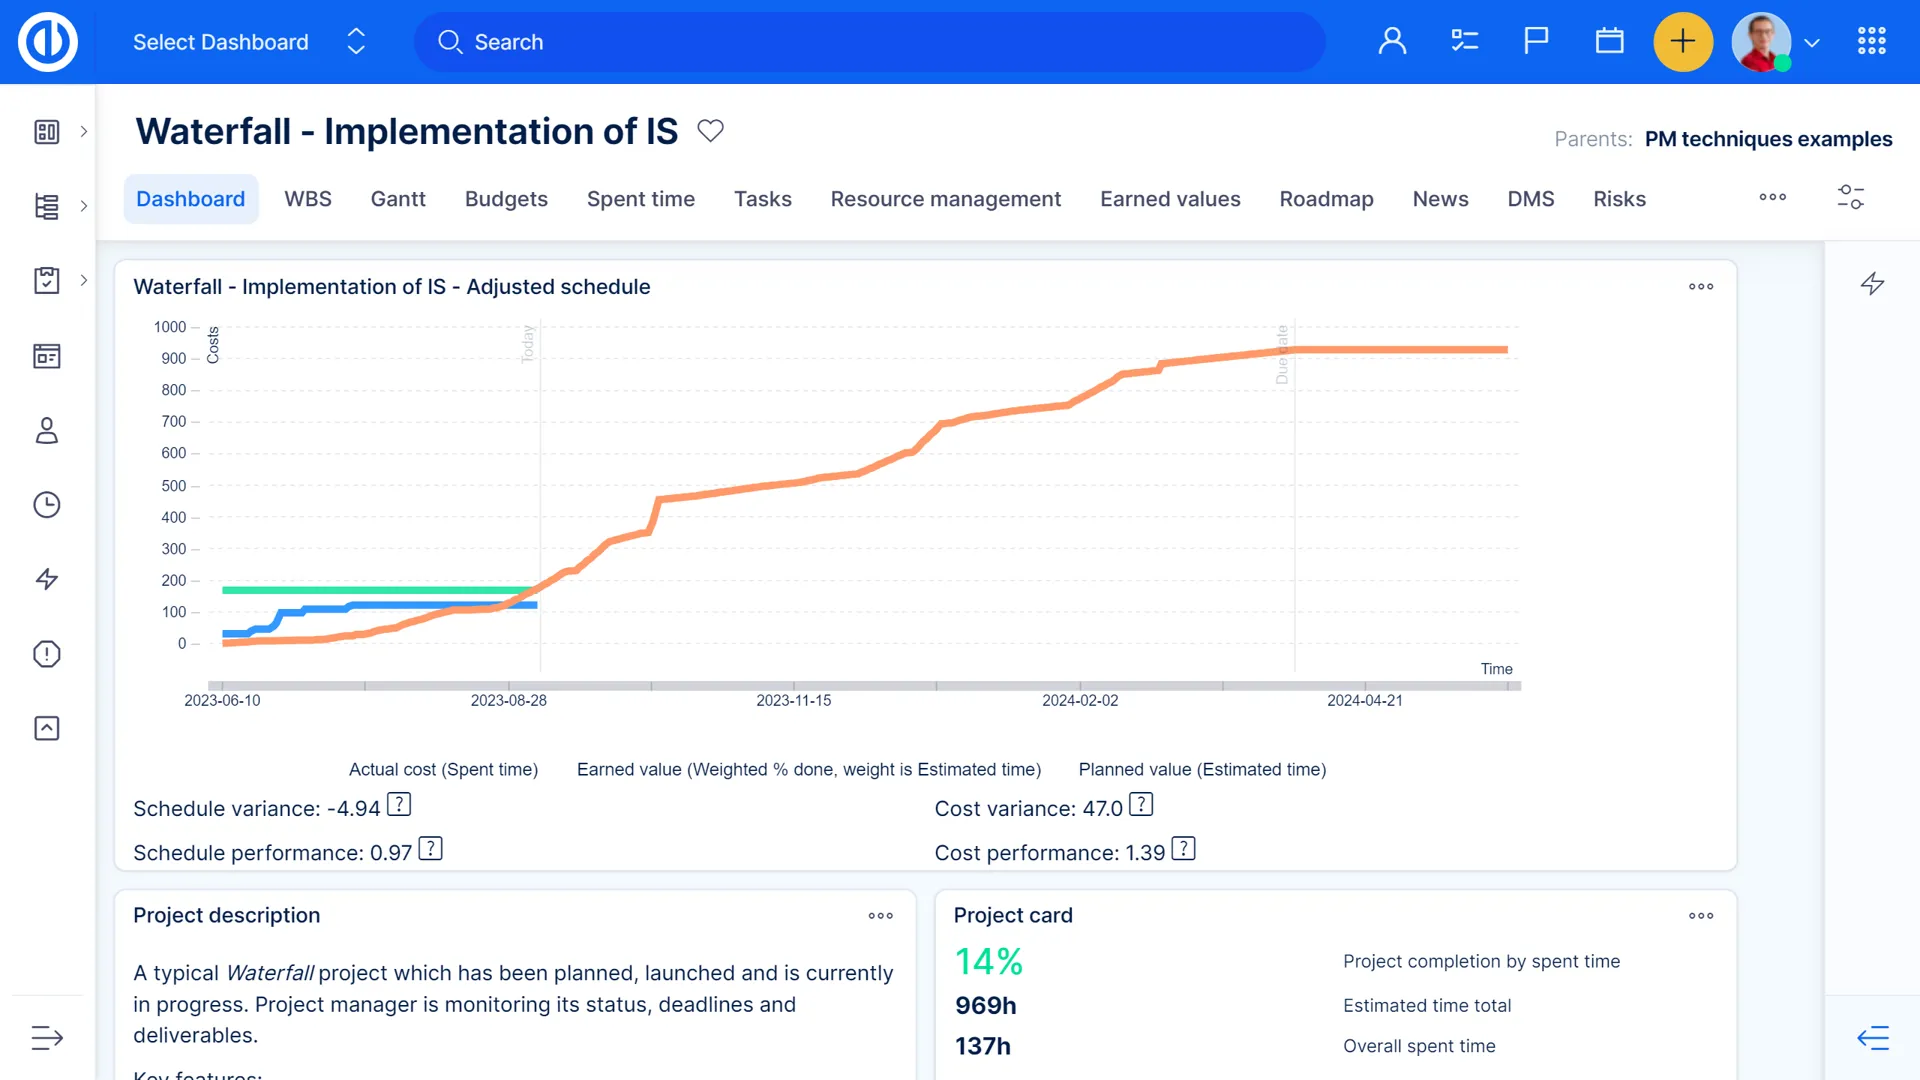
dEarned Value Management
Define the scope and analyze project’s overall performance with Earned Value Management (EVM), a research-proven methodology for determining project success.

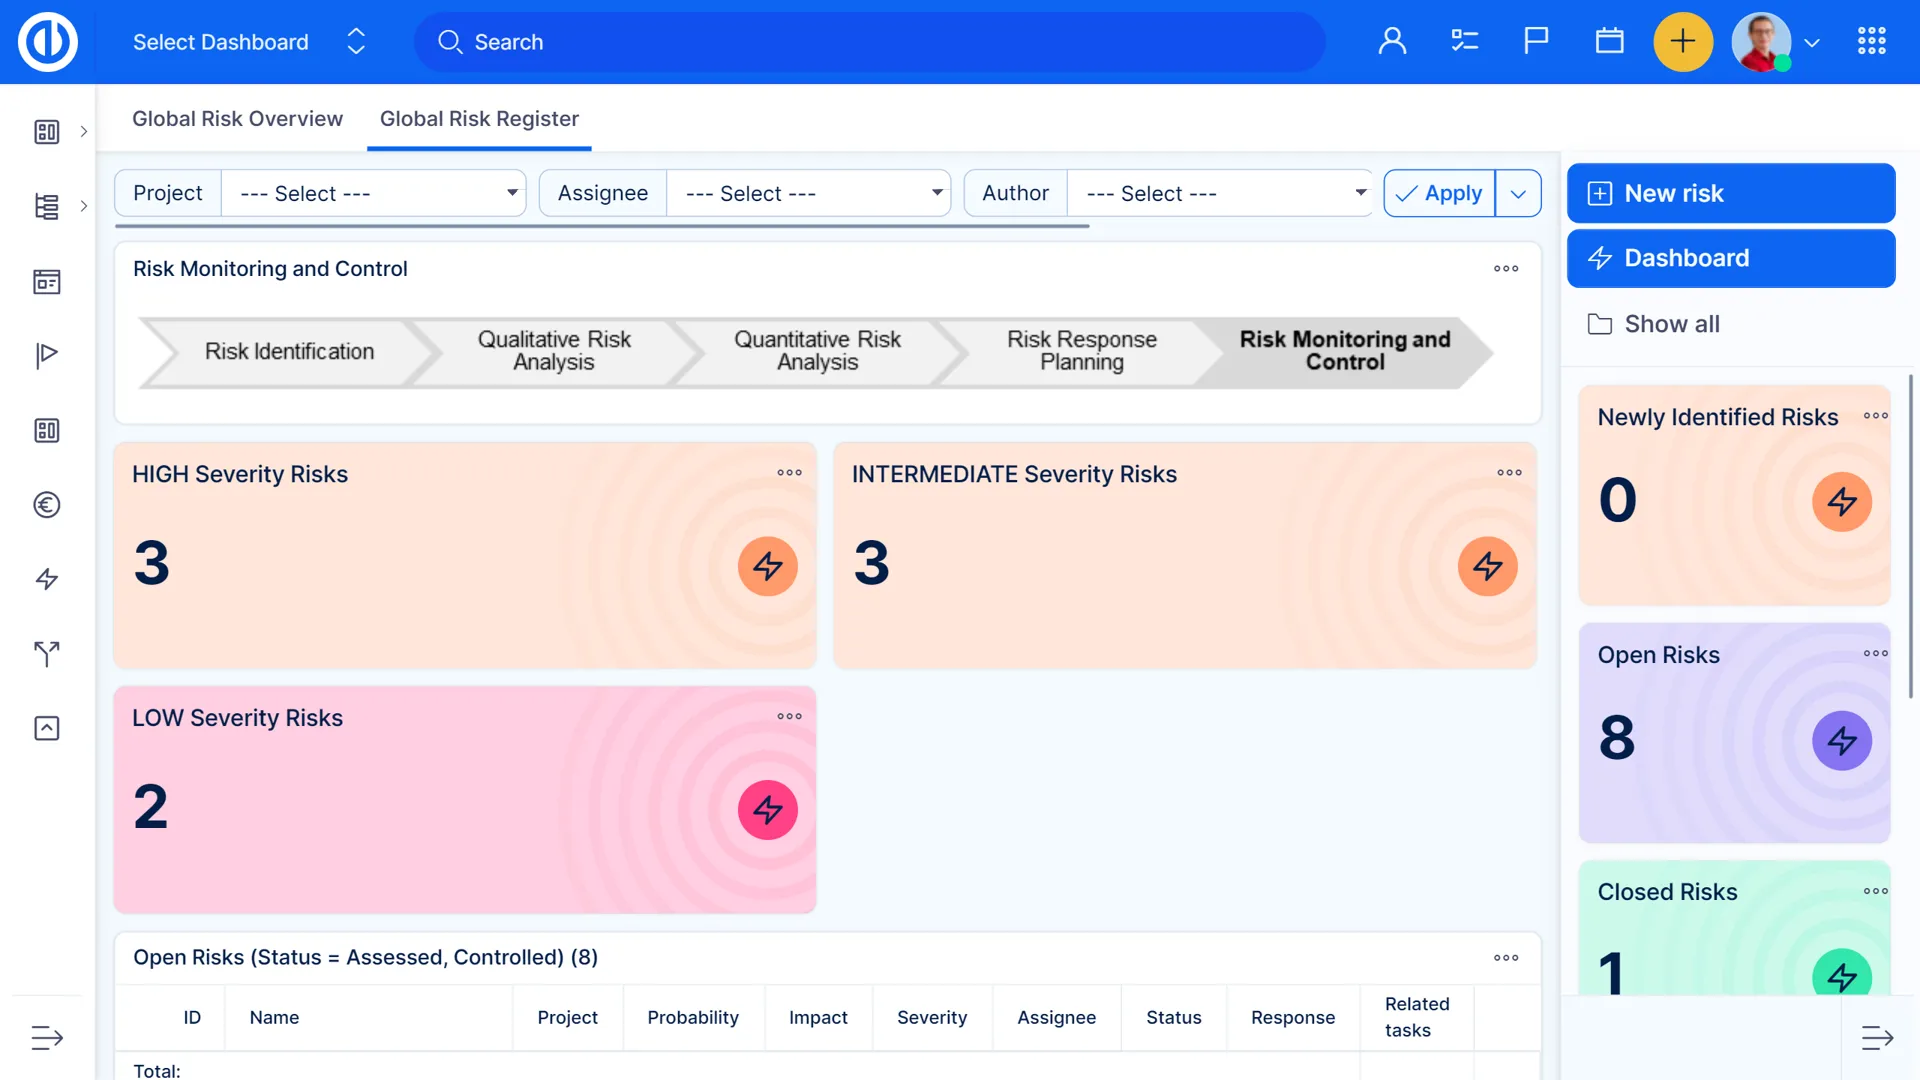
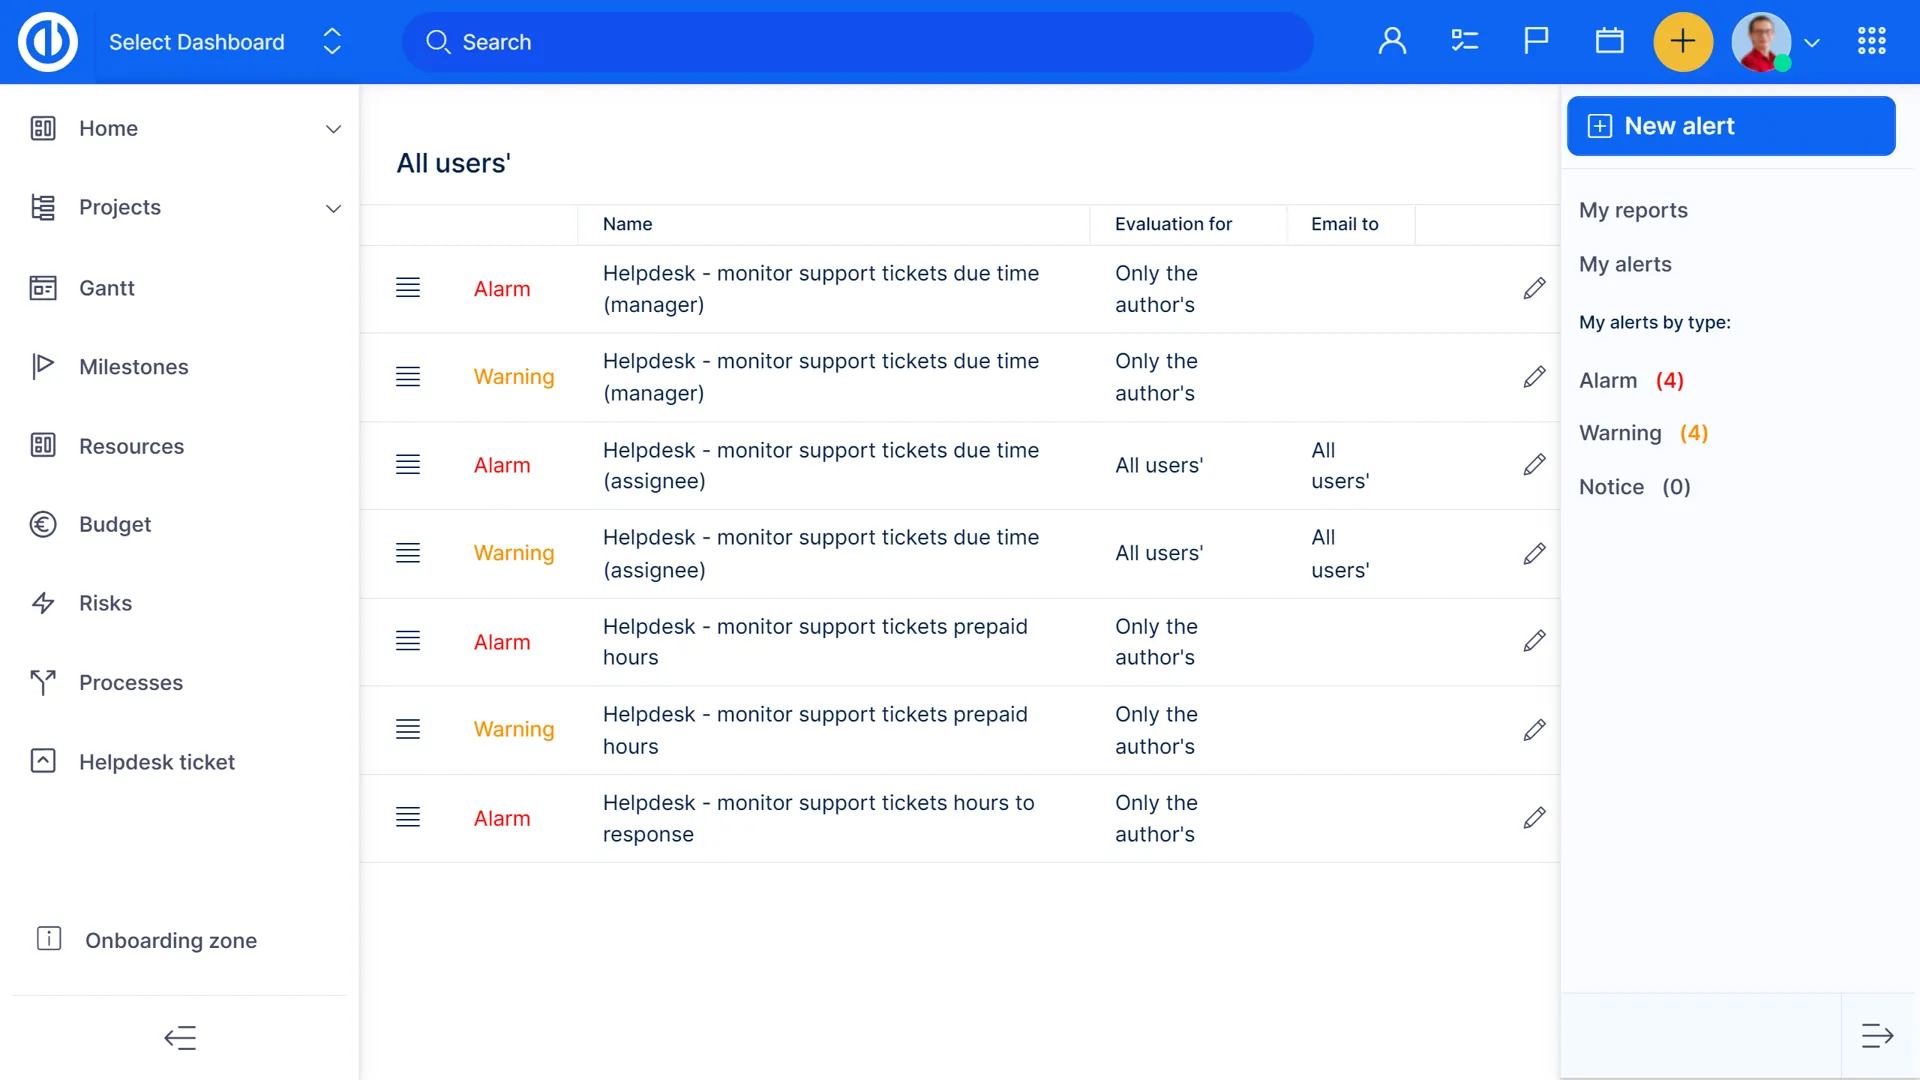
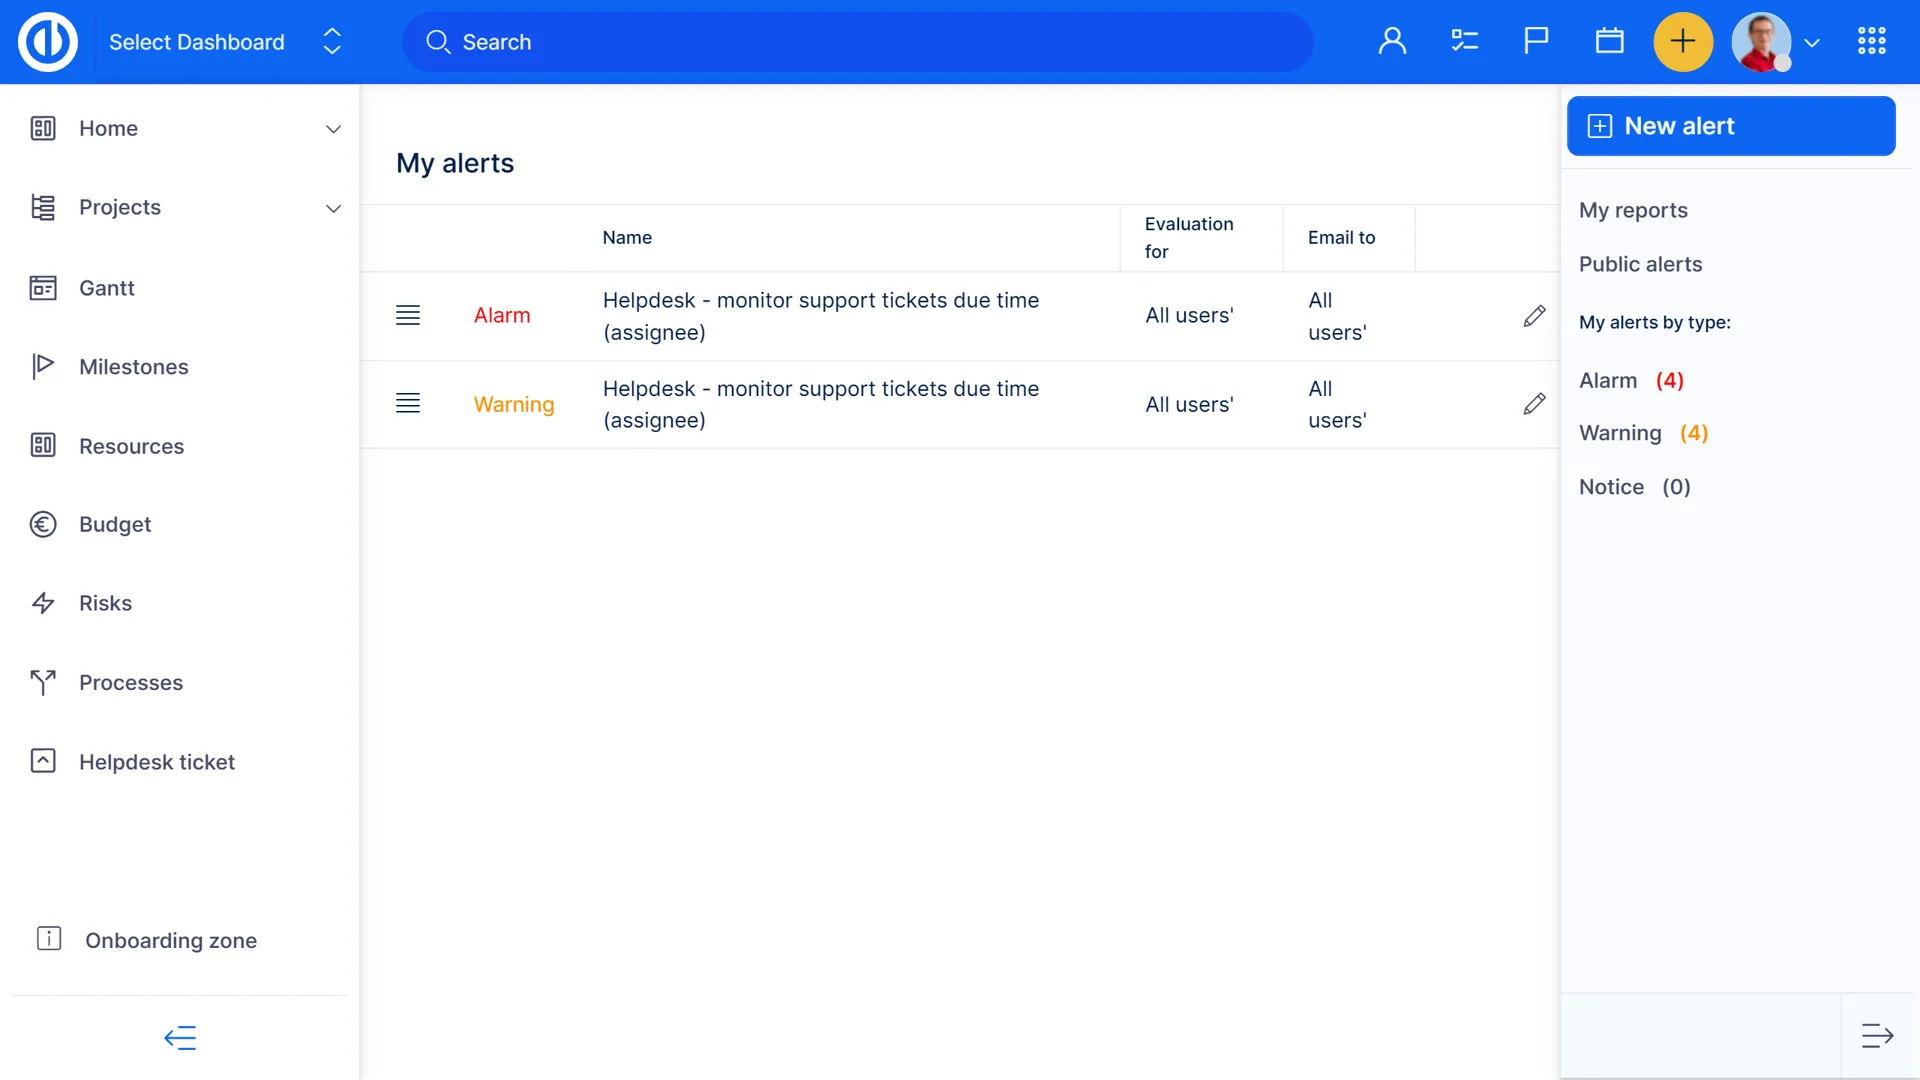
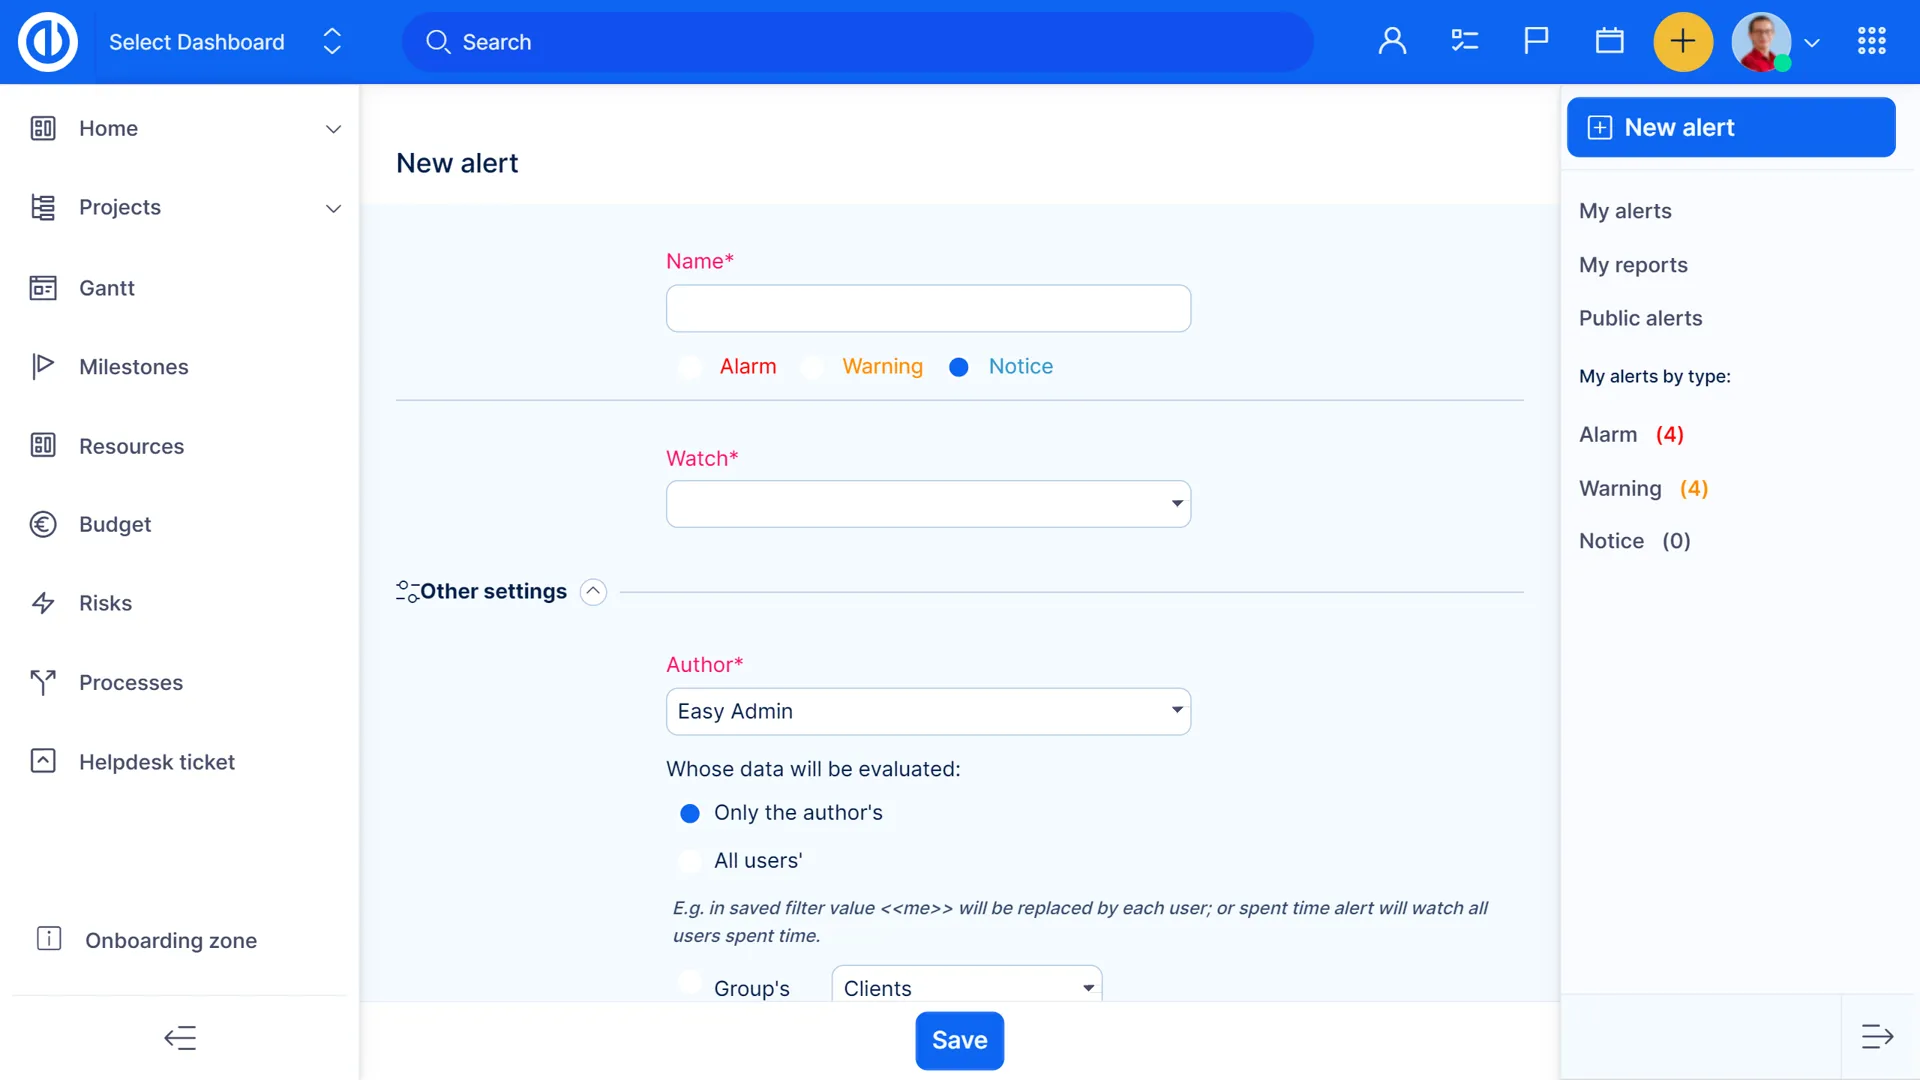
Alerts – Early Warning System
You set about what and when you want to be notified, and you will receive an e-mail notification at the right time. For example: a milestone deadline is approaching, a project/task budget is exceeded, tasks are past due.

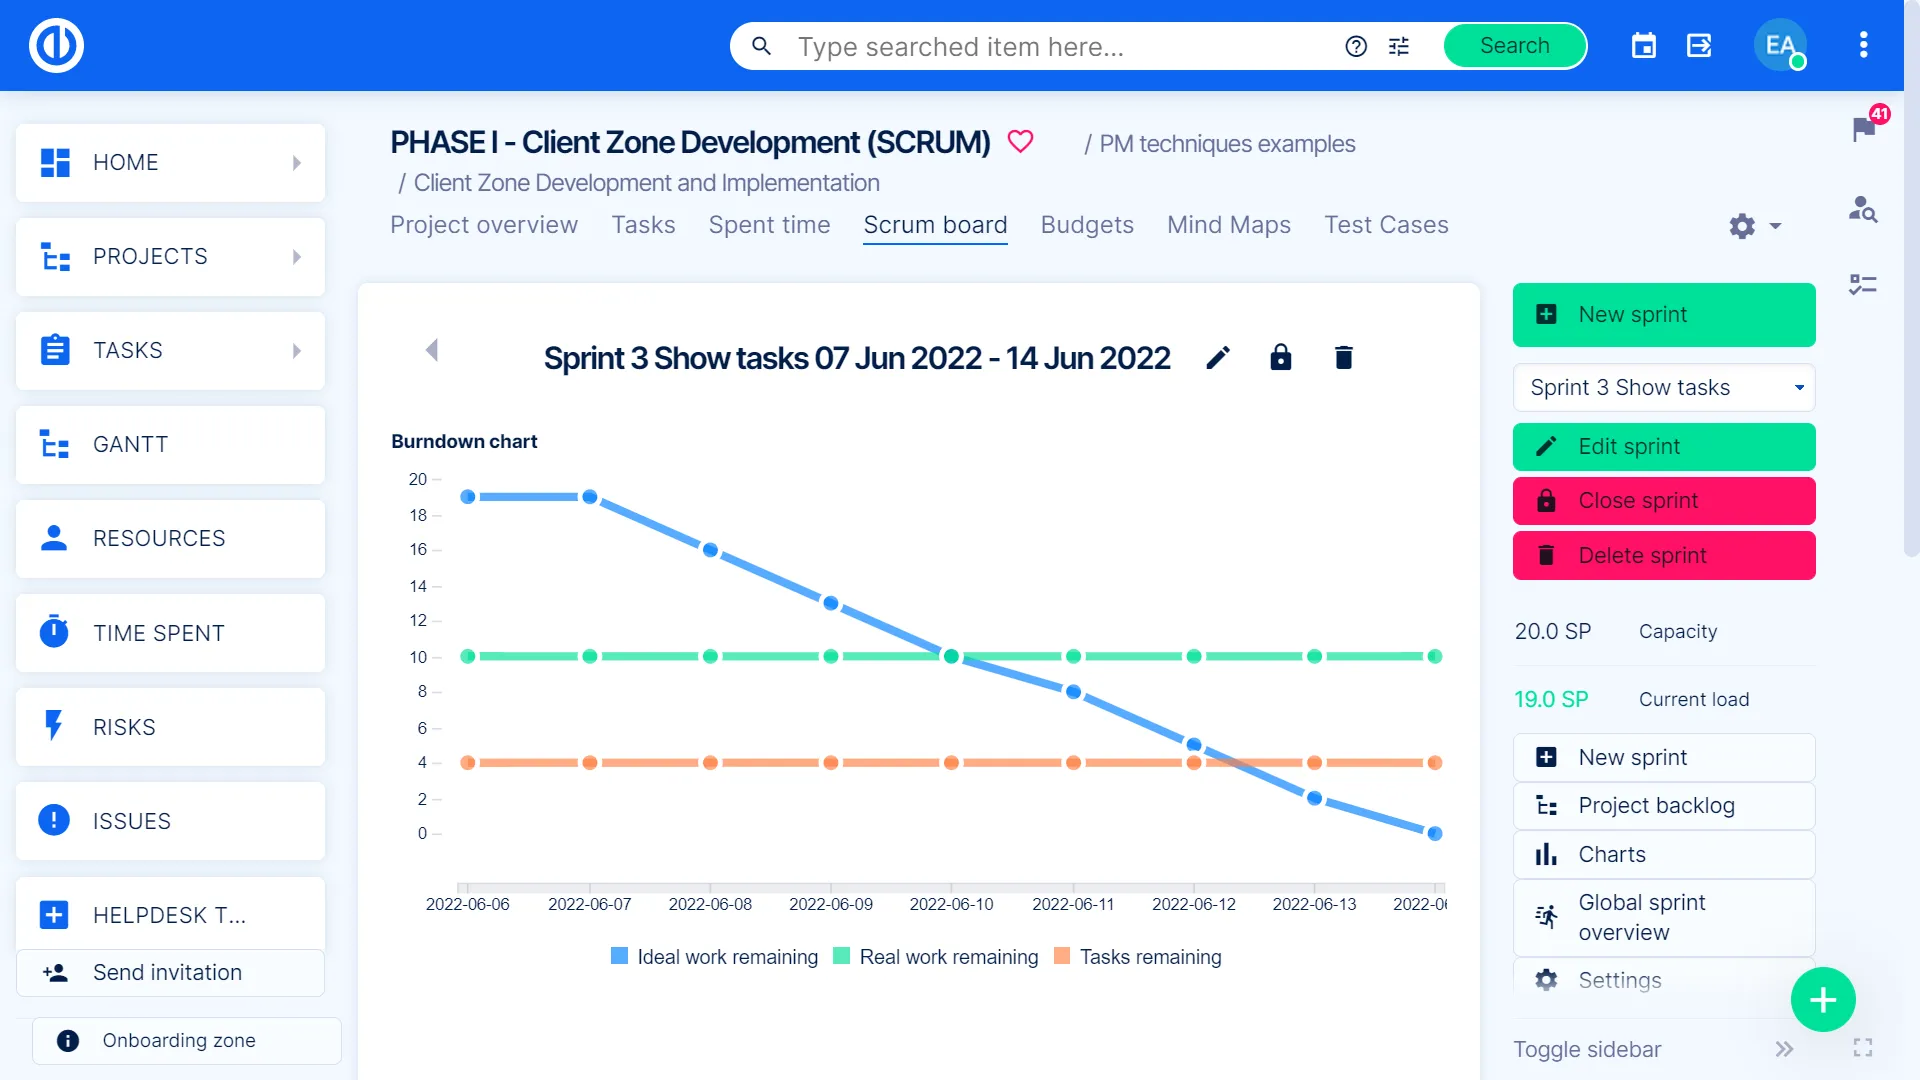
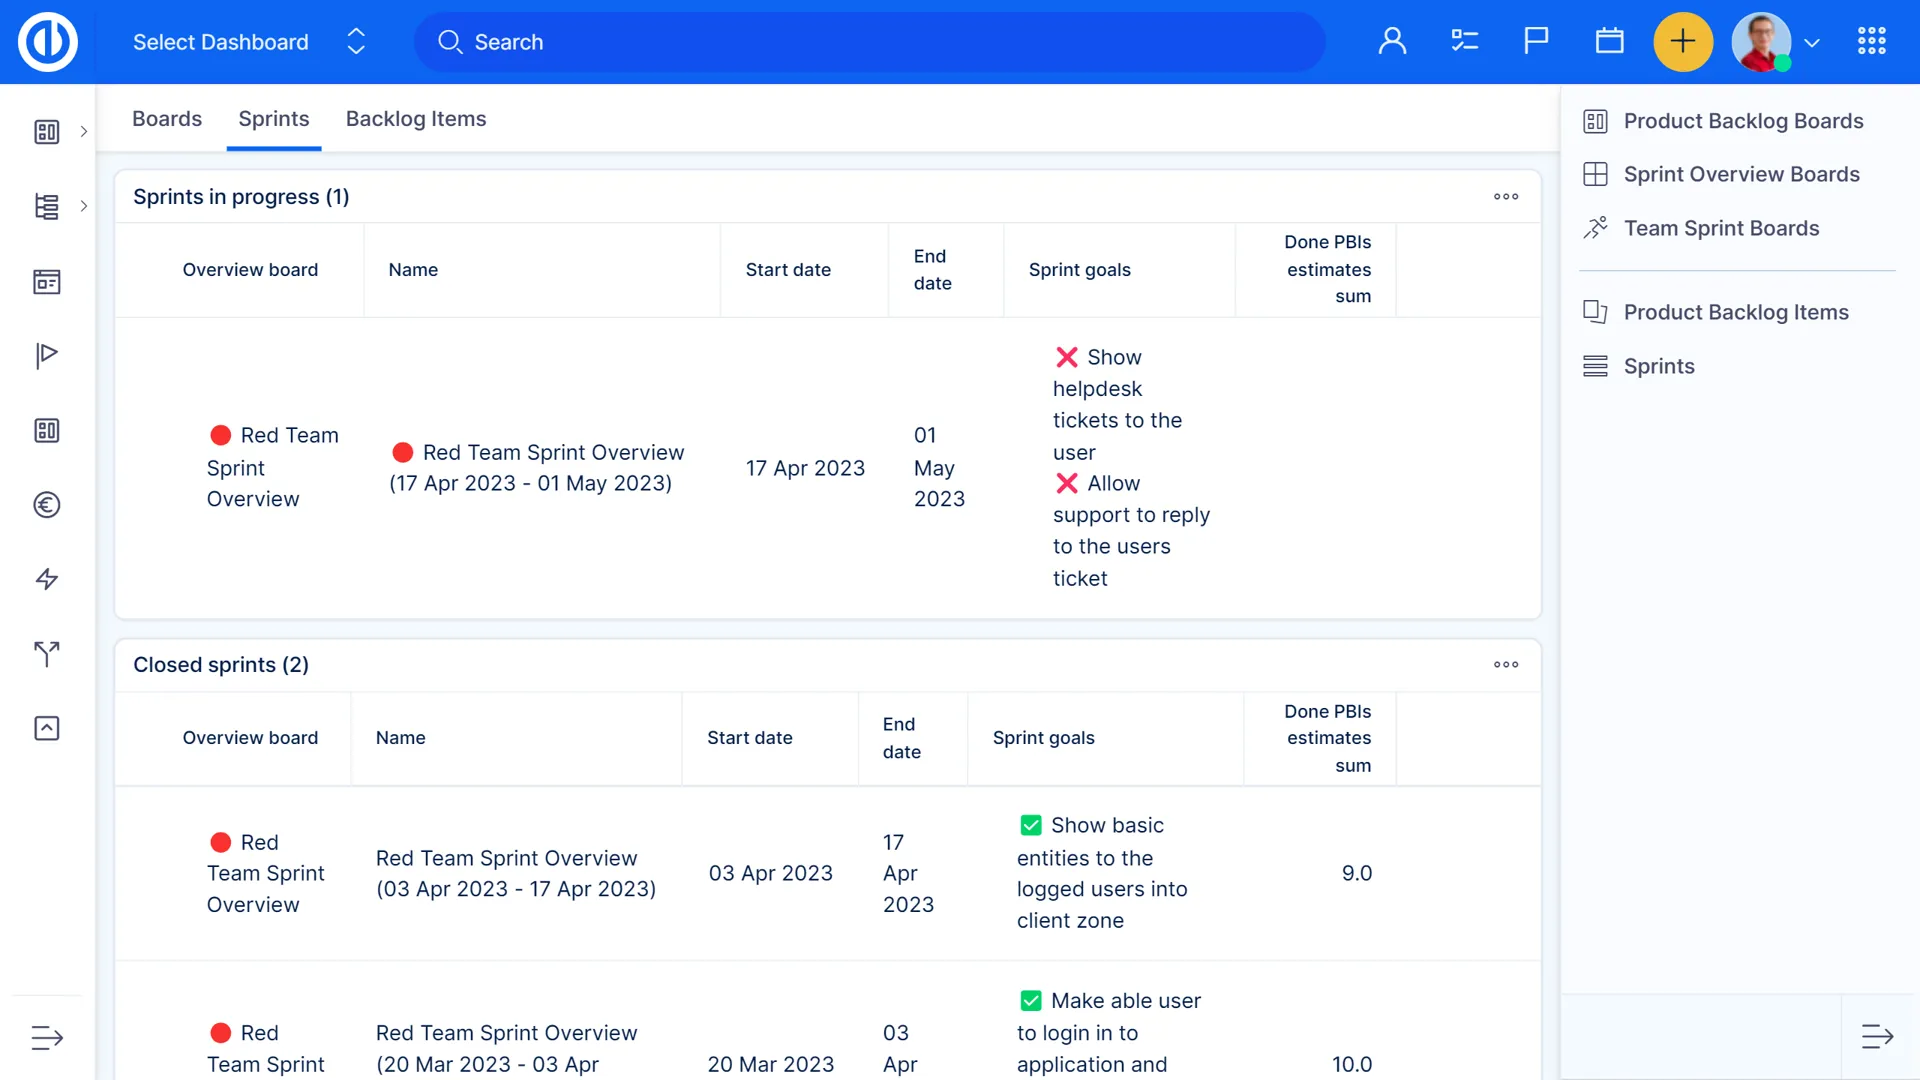
Burndown Chart for smooth sprint commitment
Perform in-depth analysis of progress patterns for timely sprint completion with Burndown Chart. Compare ideal versus real work remaining, identify a working pattern and make sure that sprint commitment is met without a hitch.

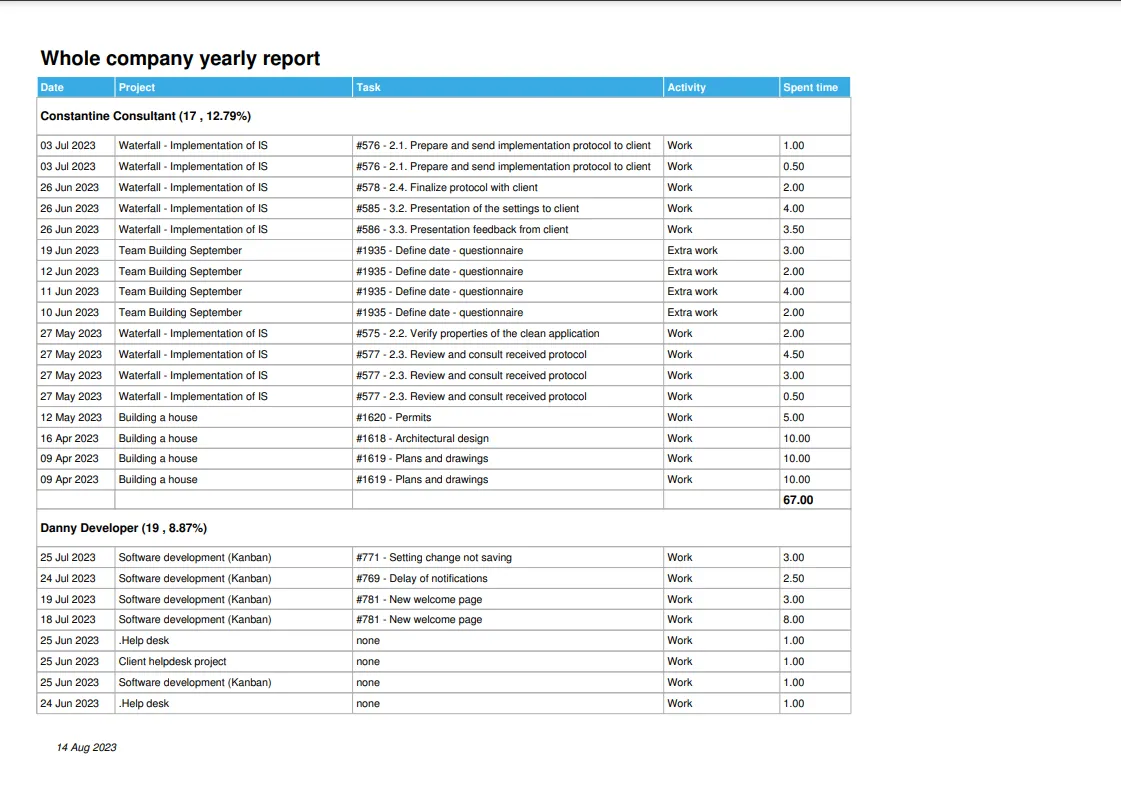
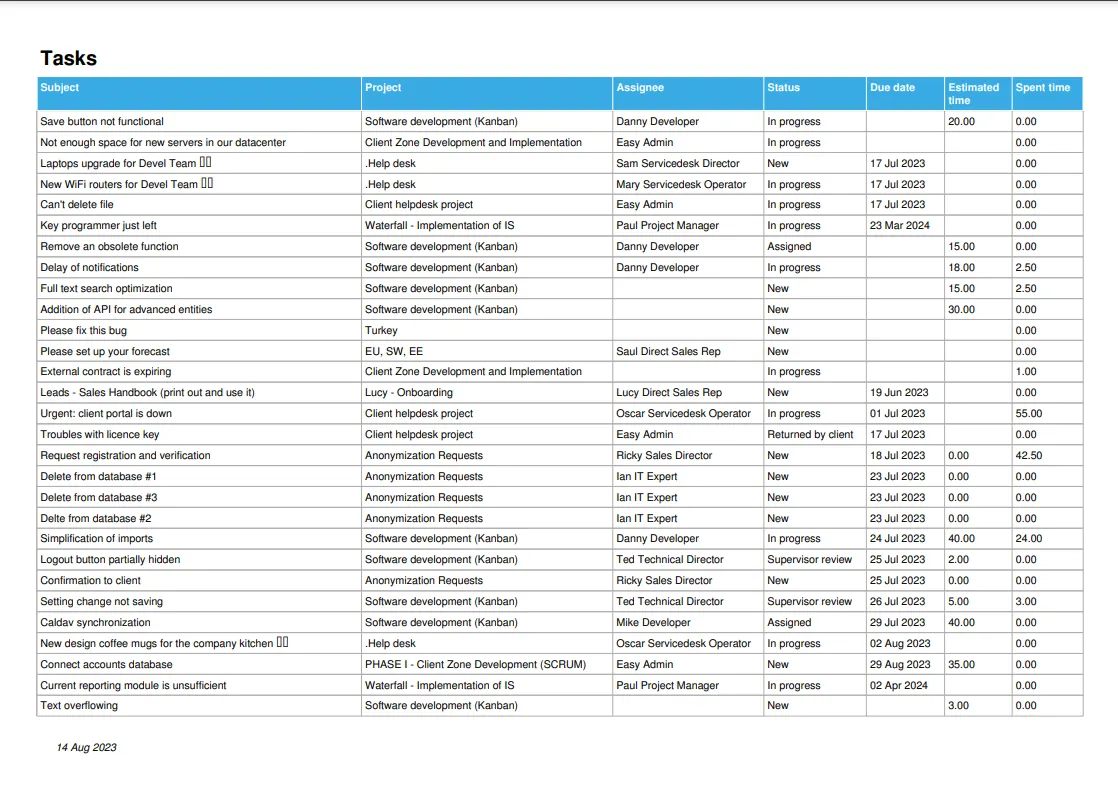
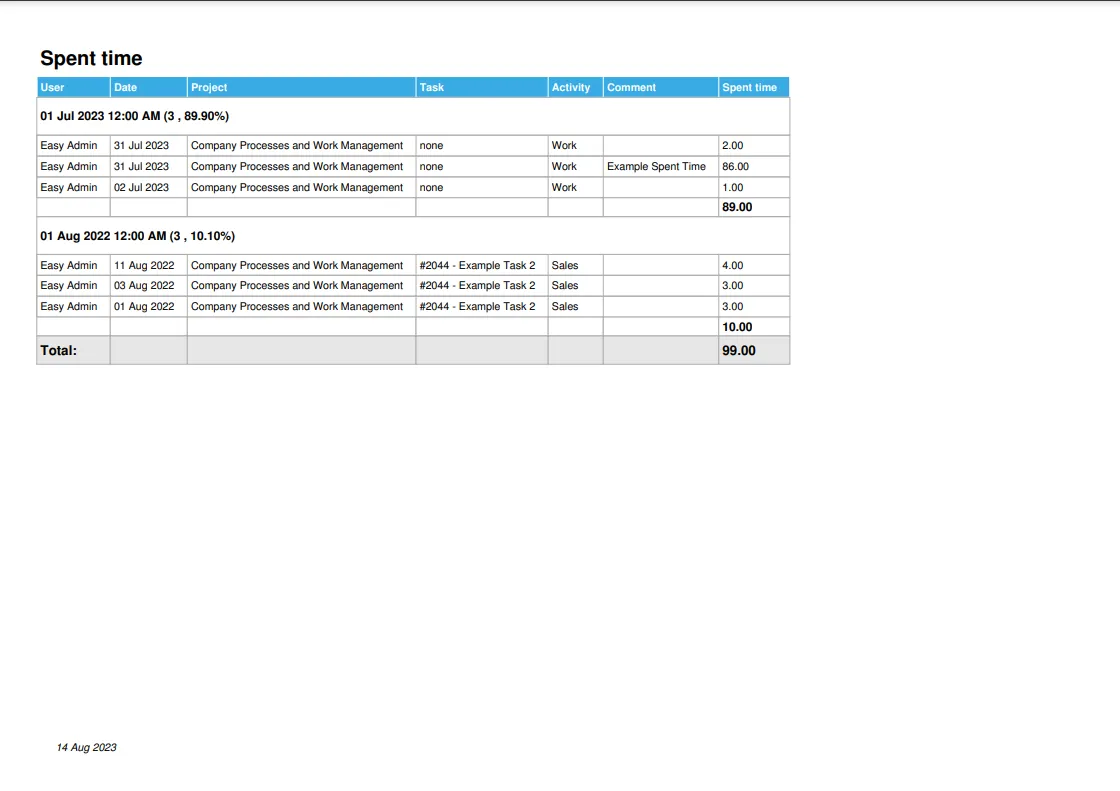
Branded Exports
All data listings from the system can be exported into a PDF file with your logo and company colors. Example of exports: any task list, project list, spent time entries, task detail export, etc.

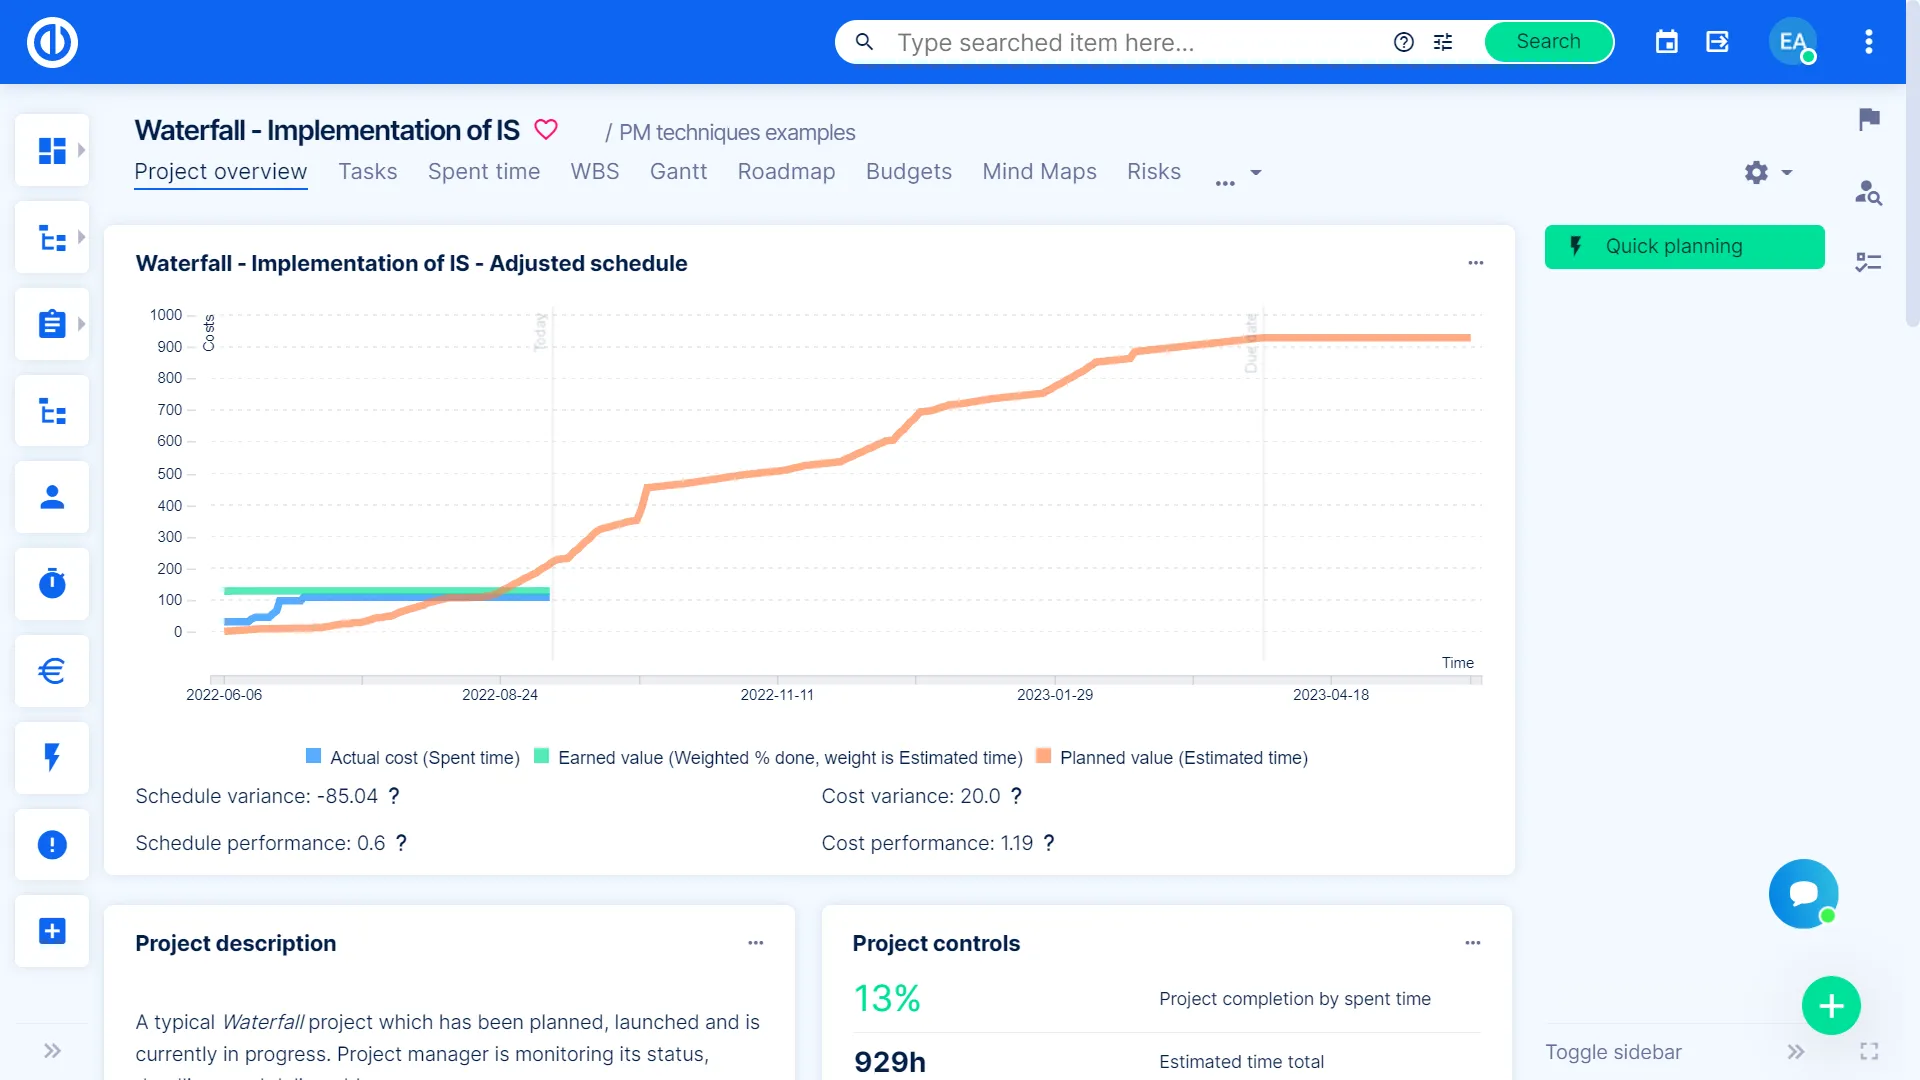
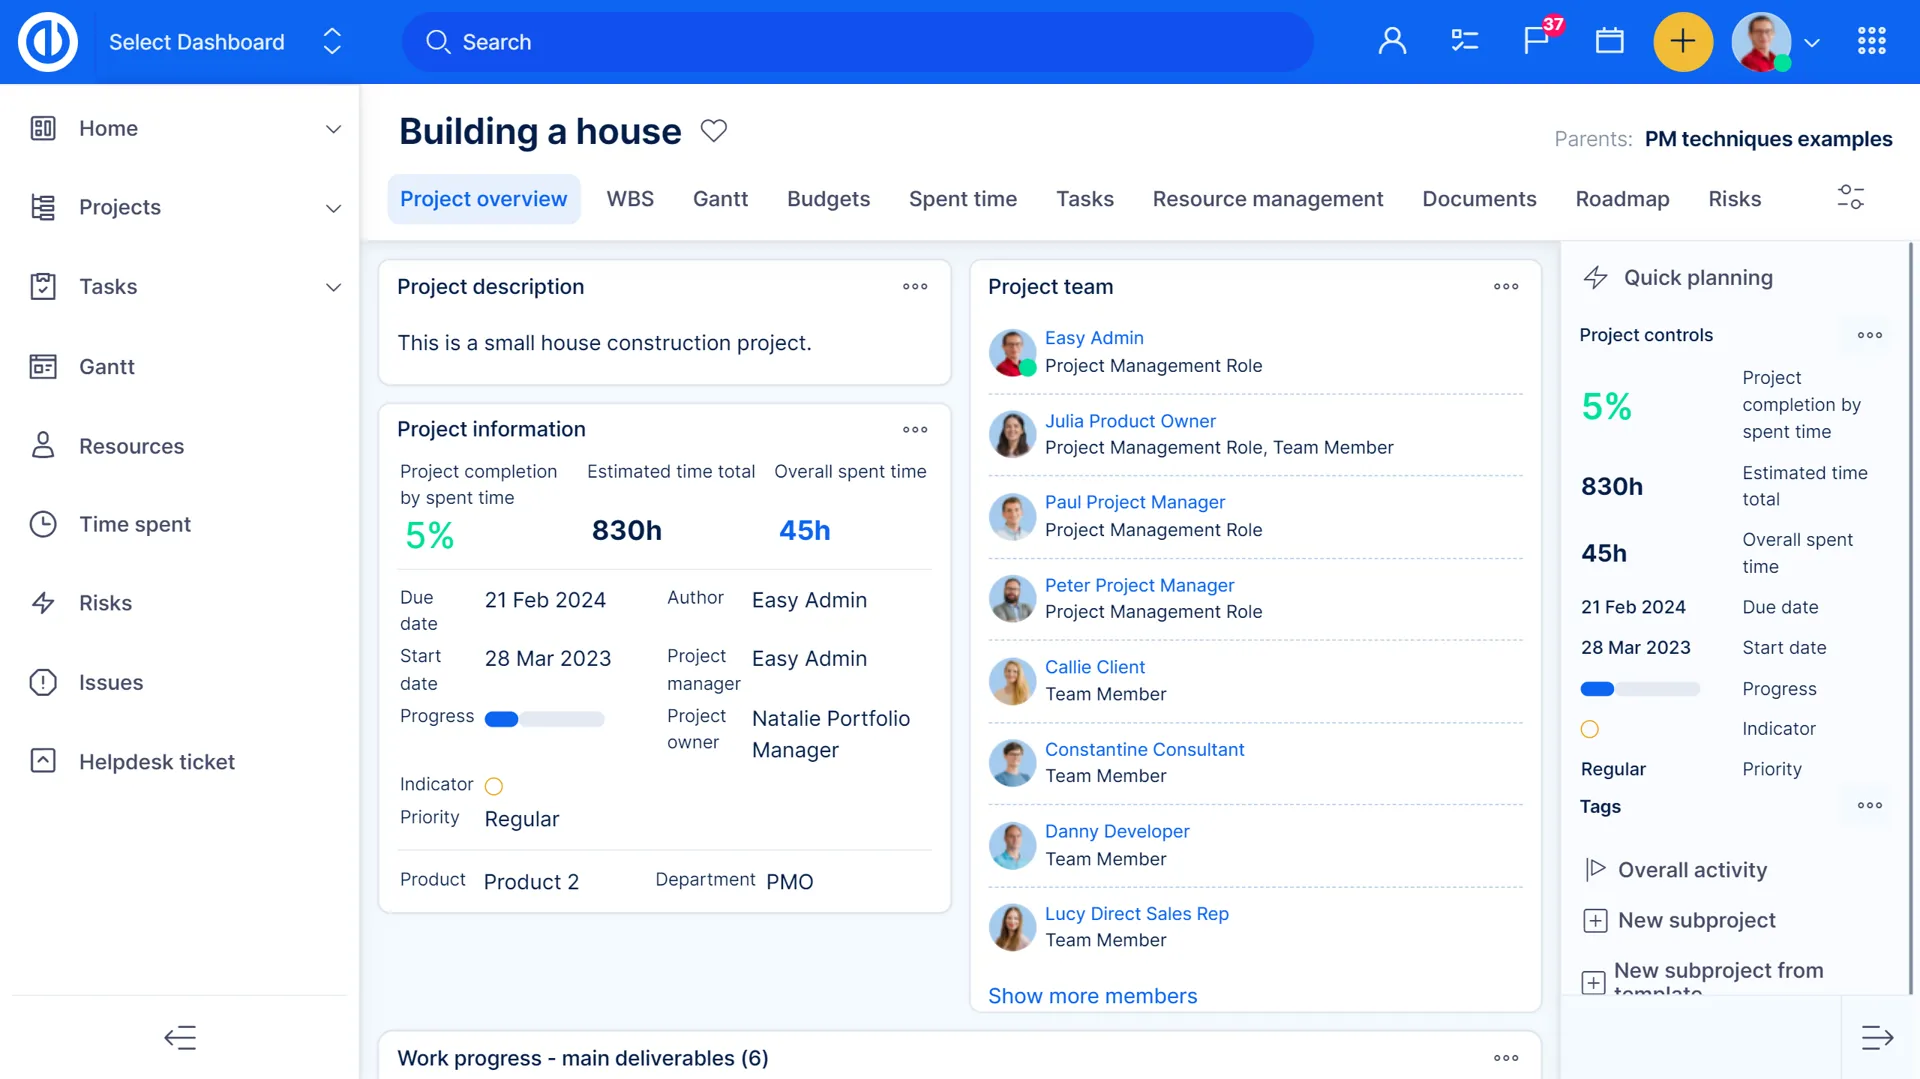
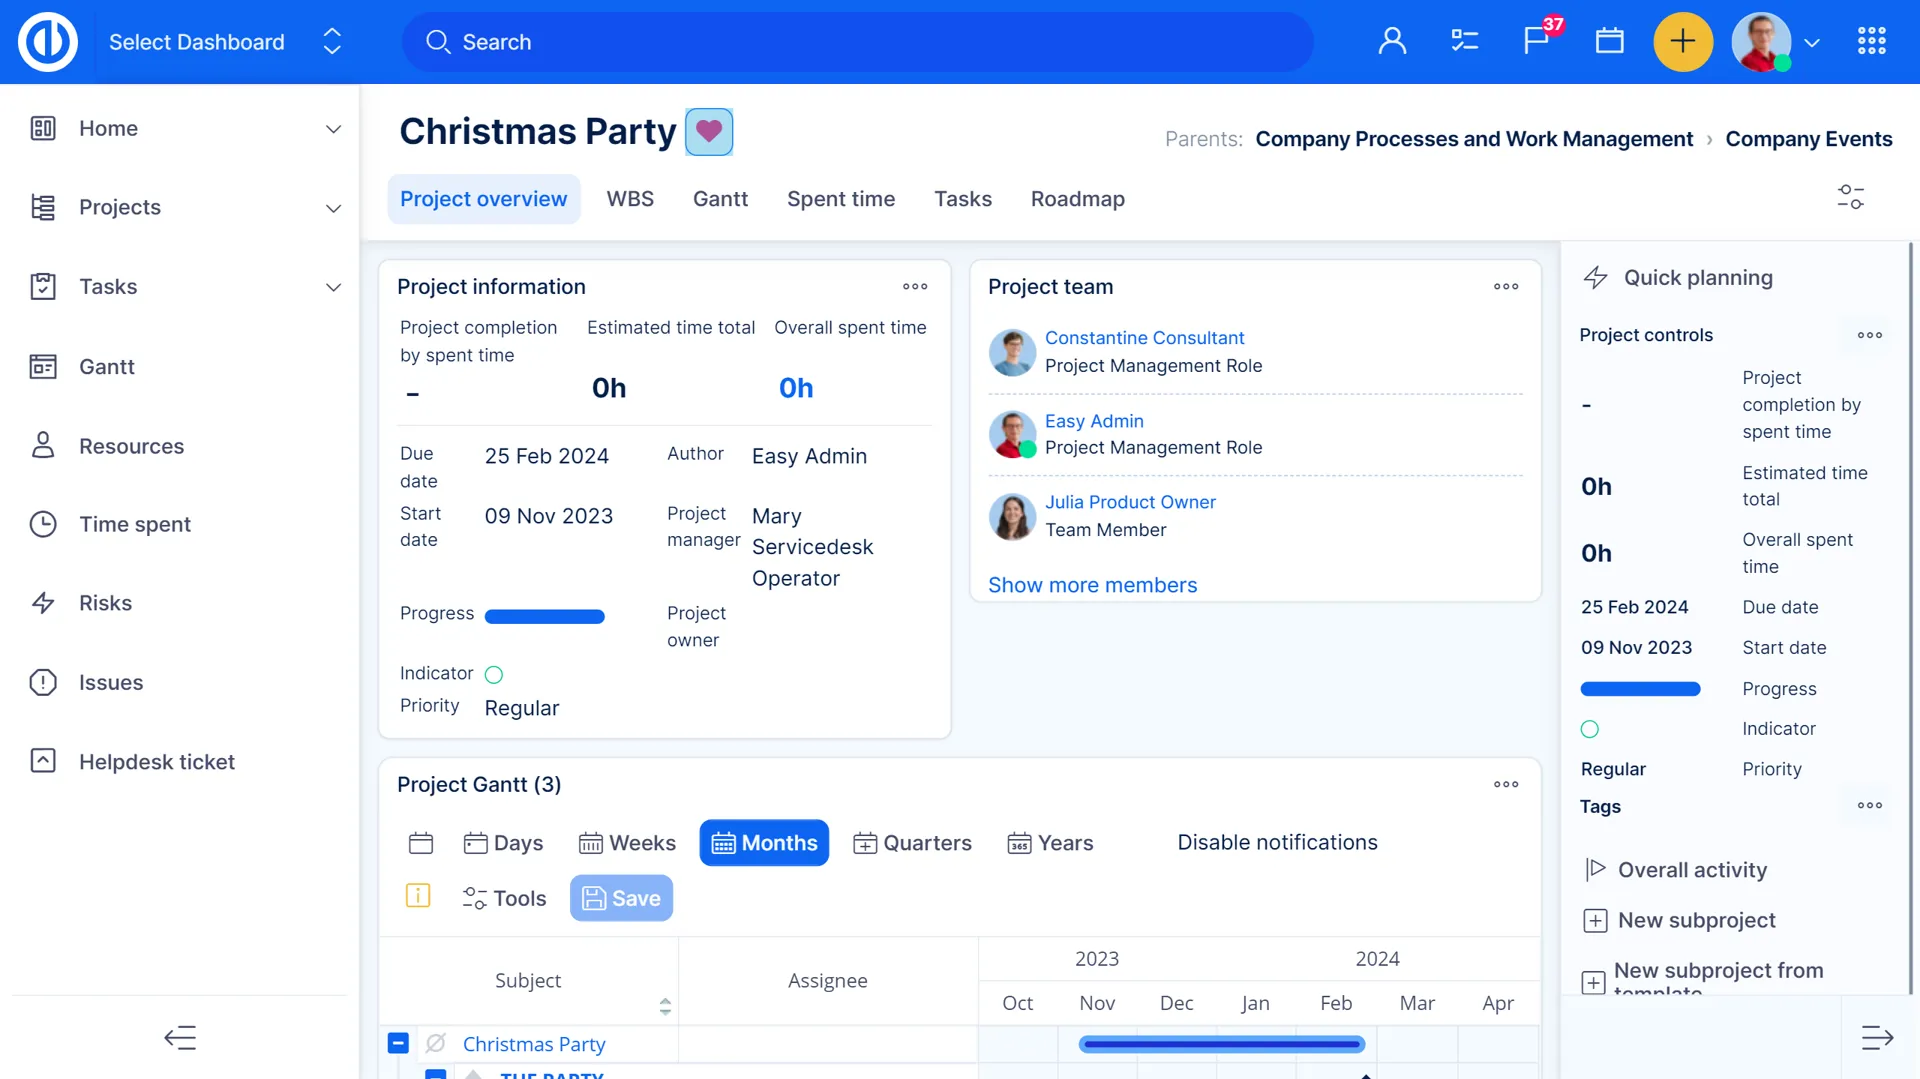
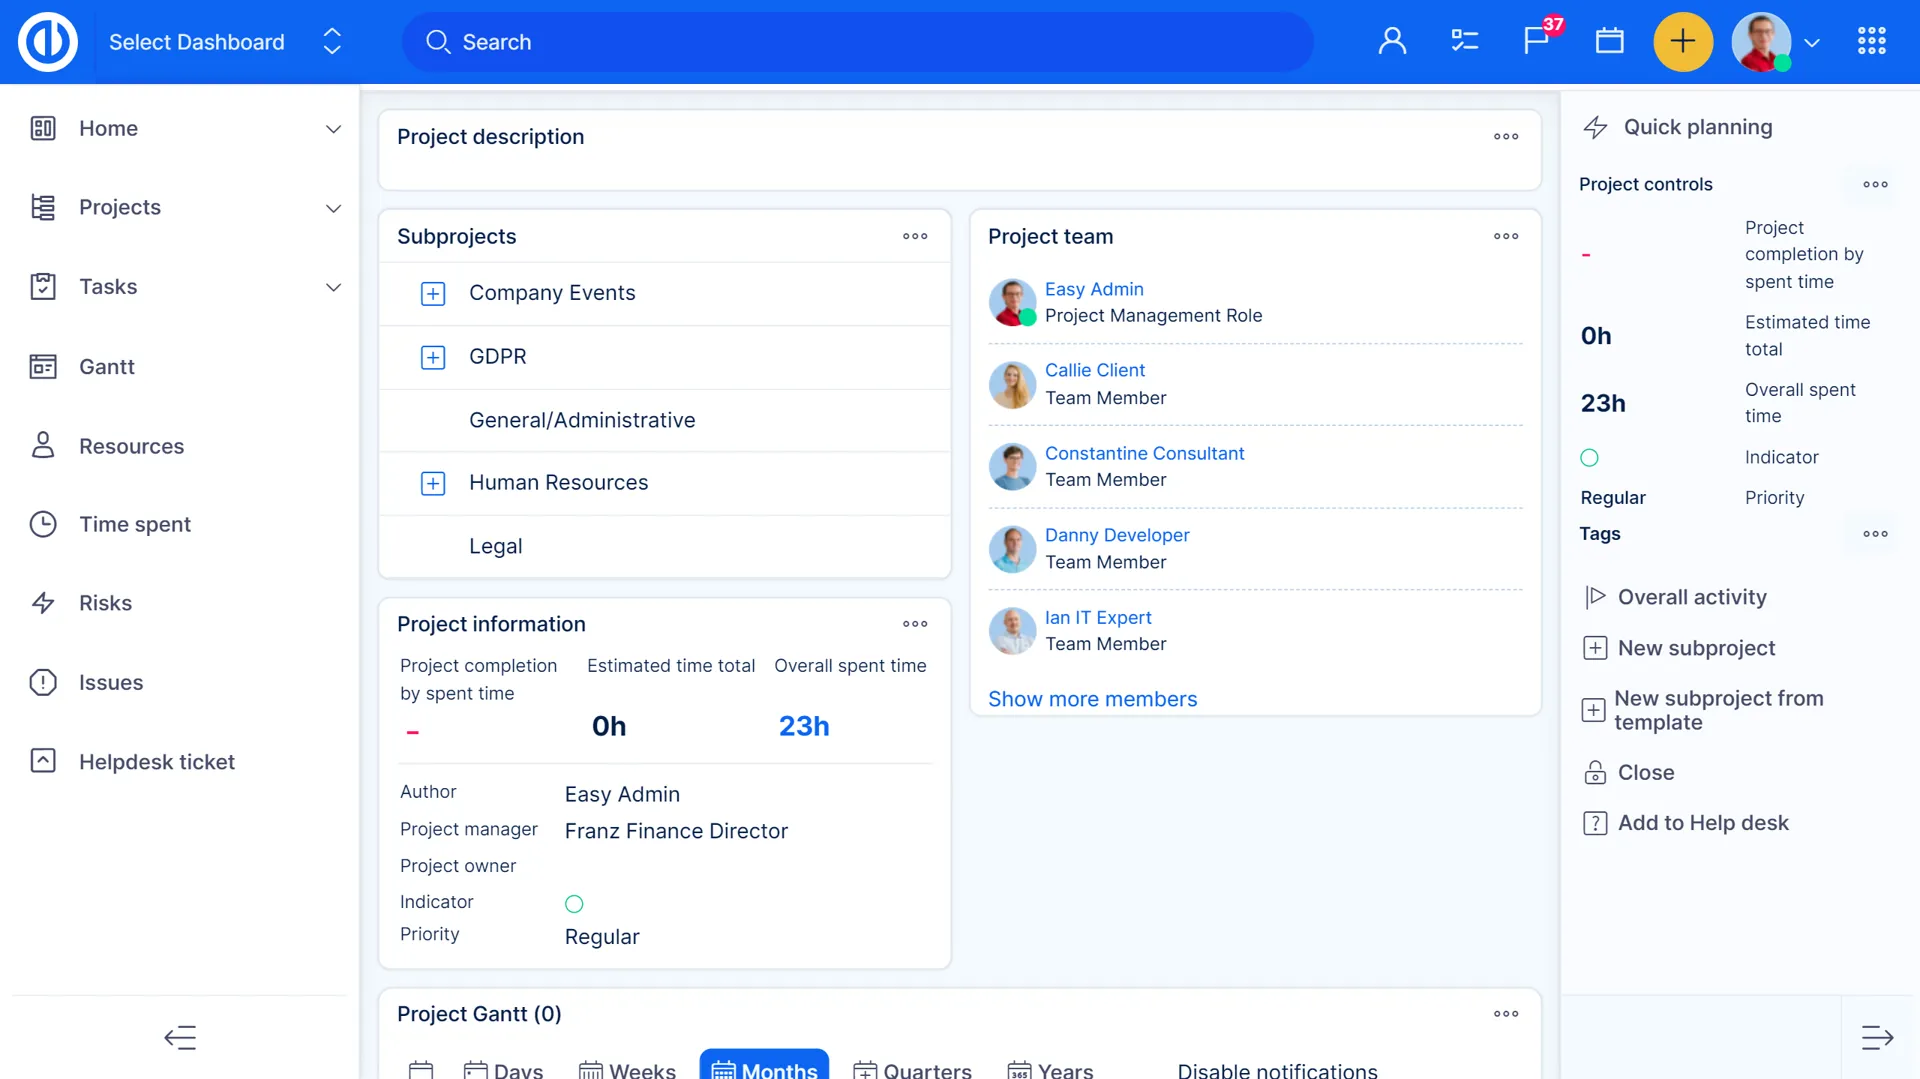
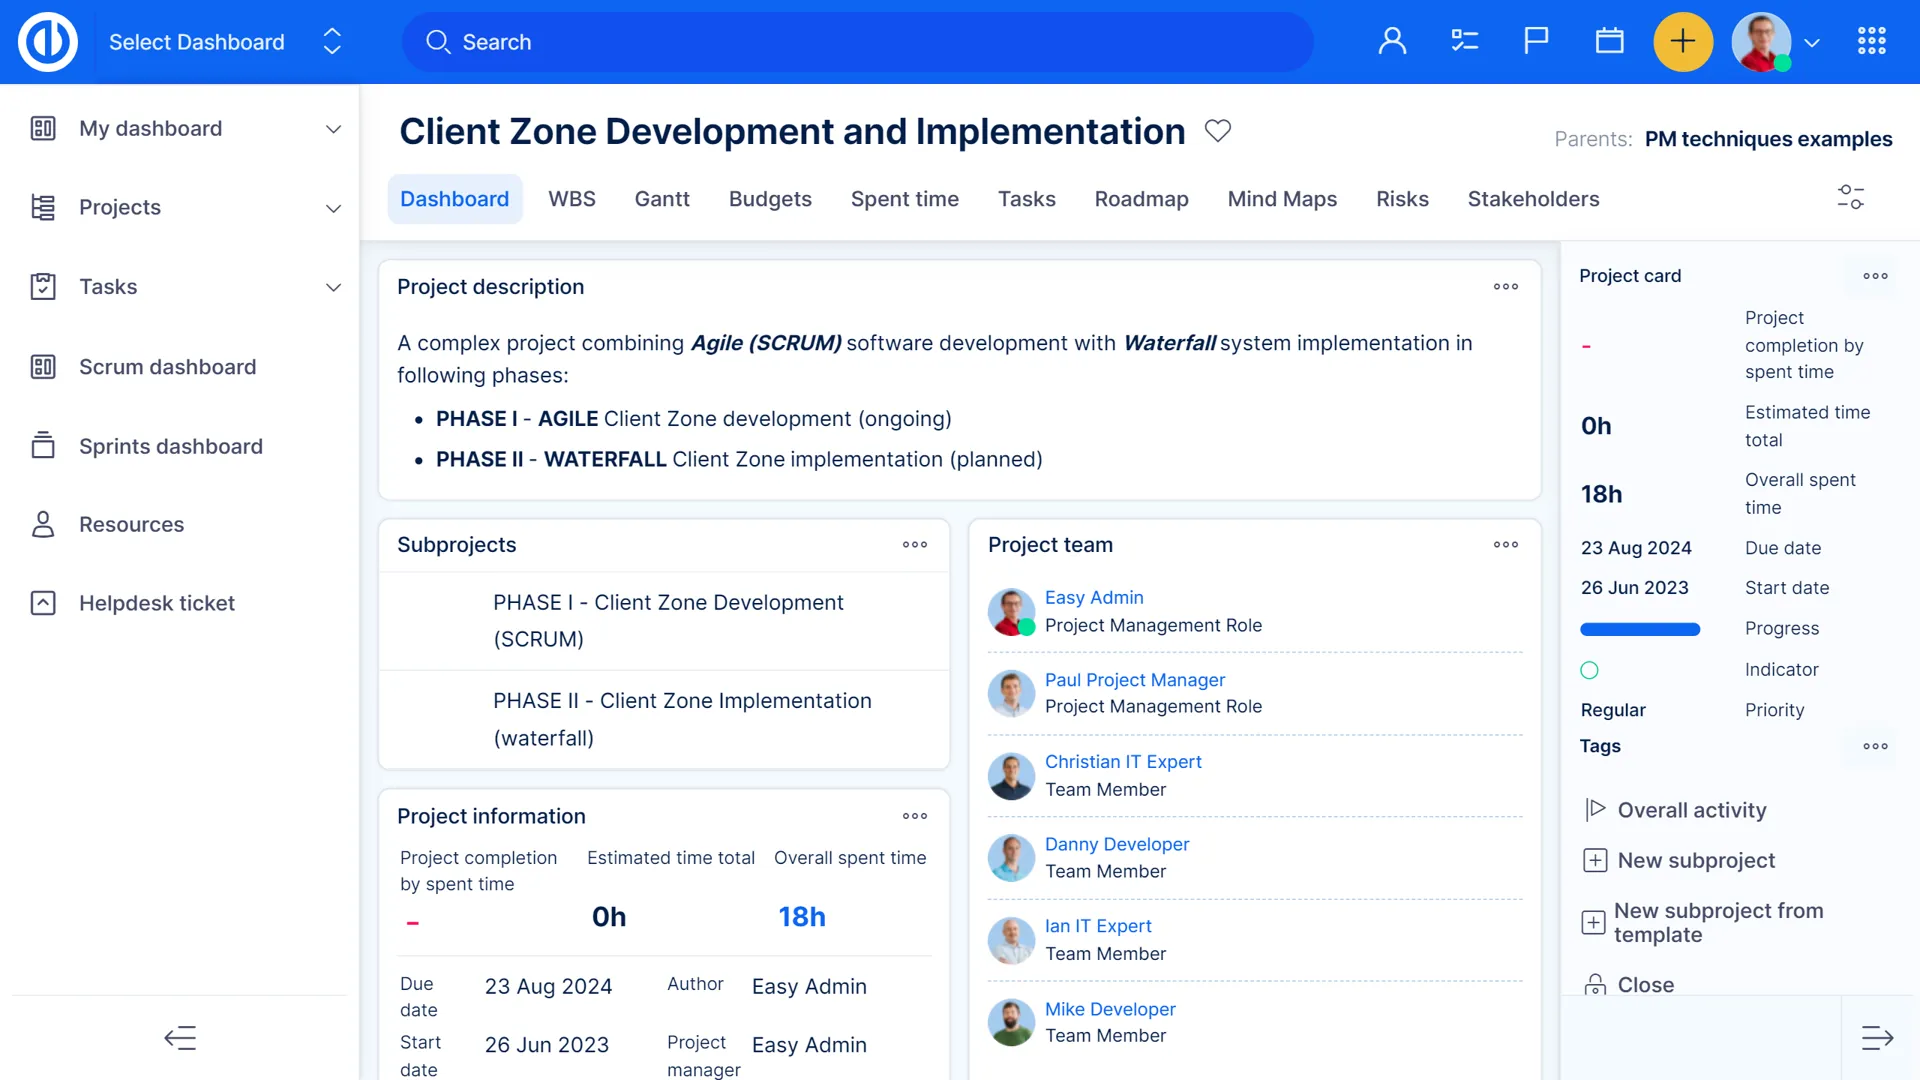
Project Dashboard
In order to keep your business on the right track, project managers and teams need any help they can get. One of the proven ways of tracking and measuring ongoing progress is by using a project dashboard, which makes it simple to visualize real-time data and customize the page to the needs of the team and projects.
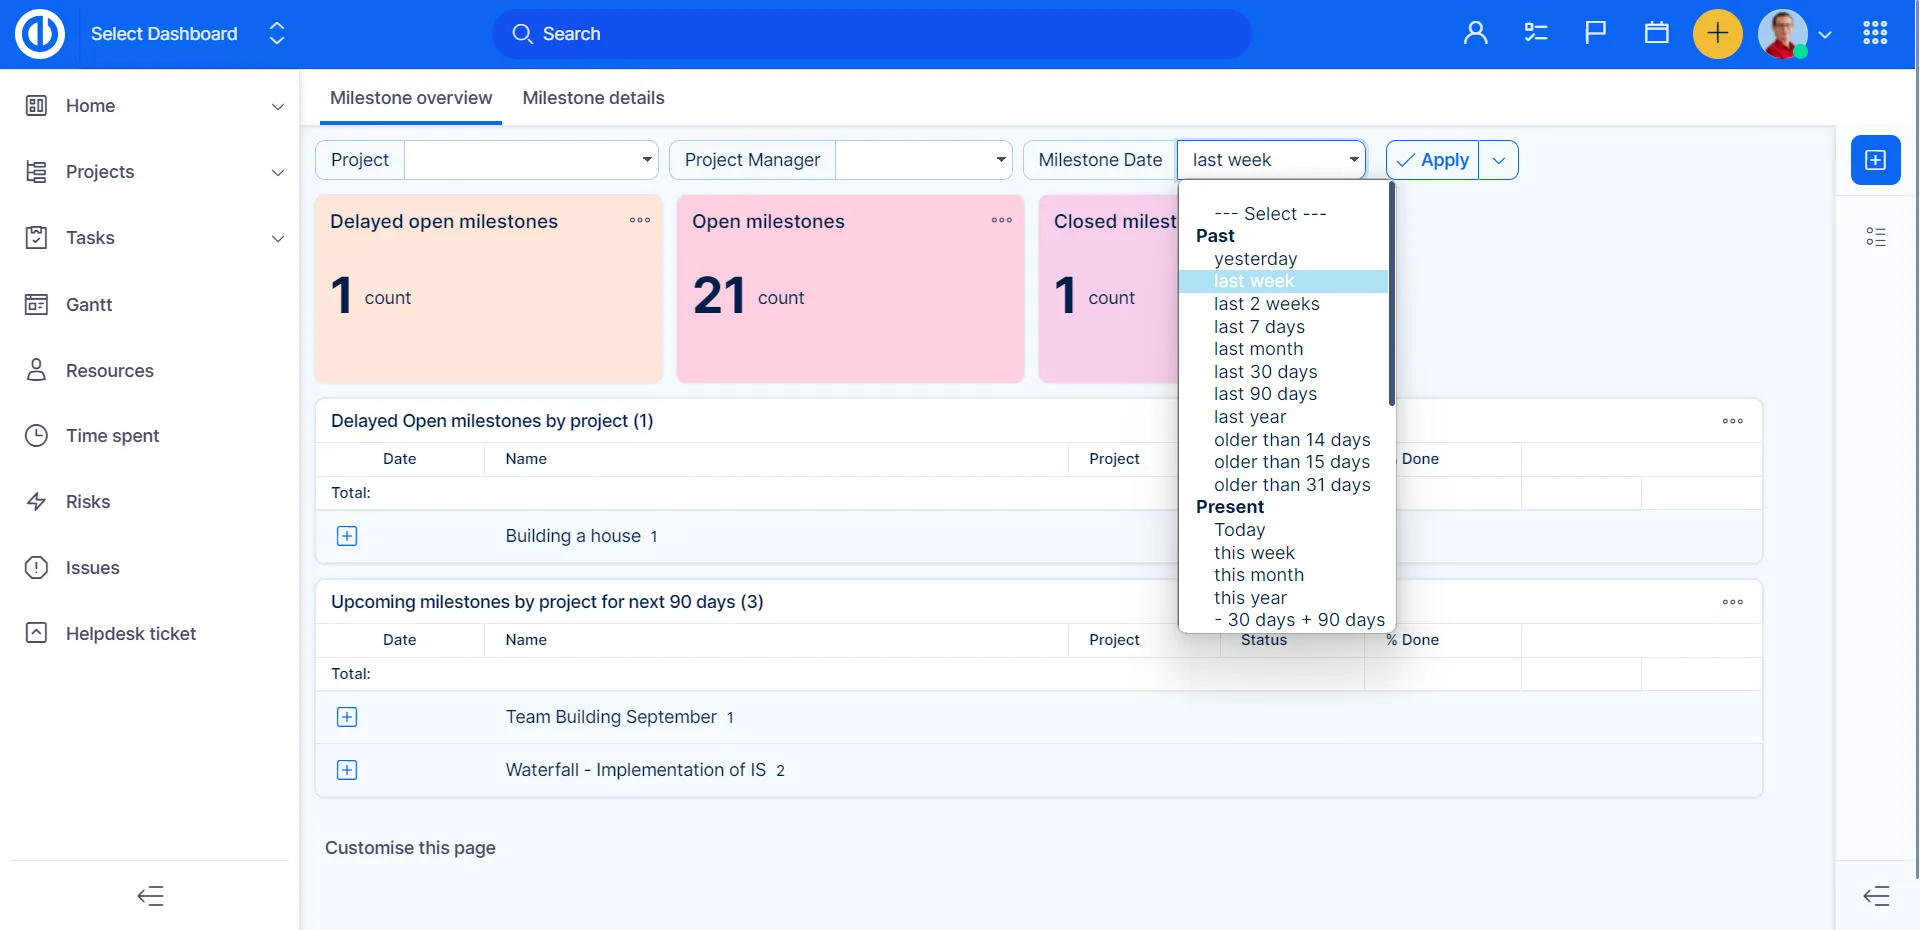
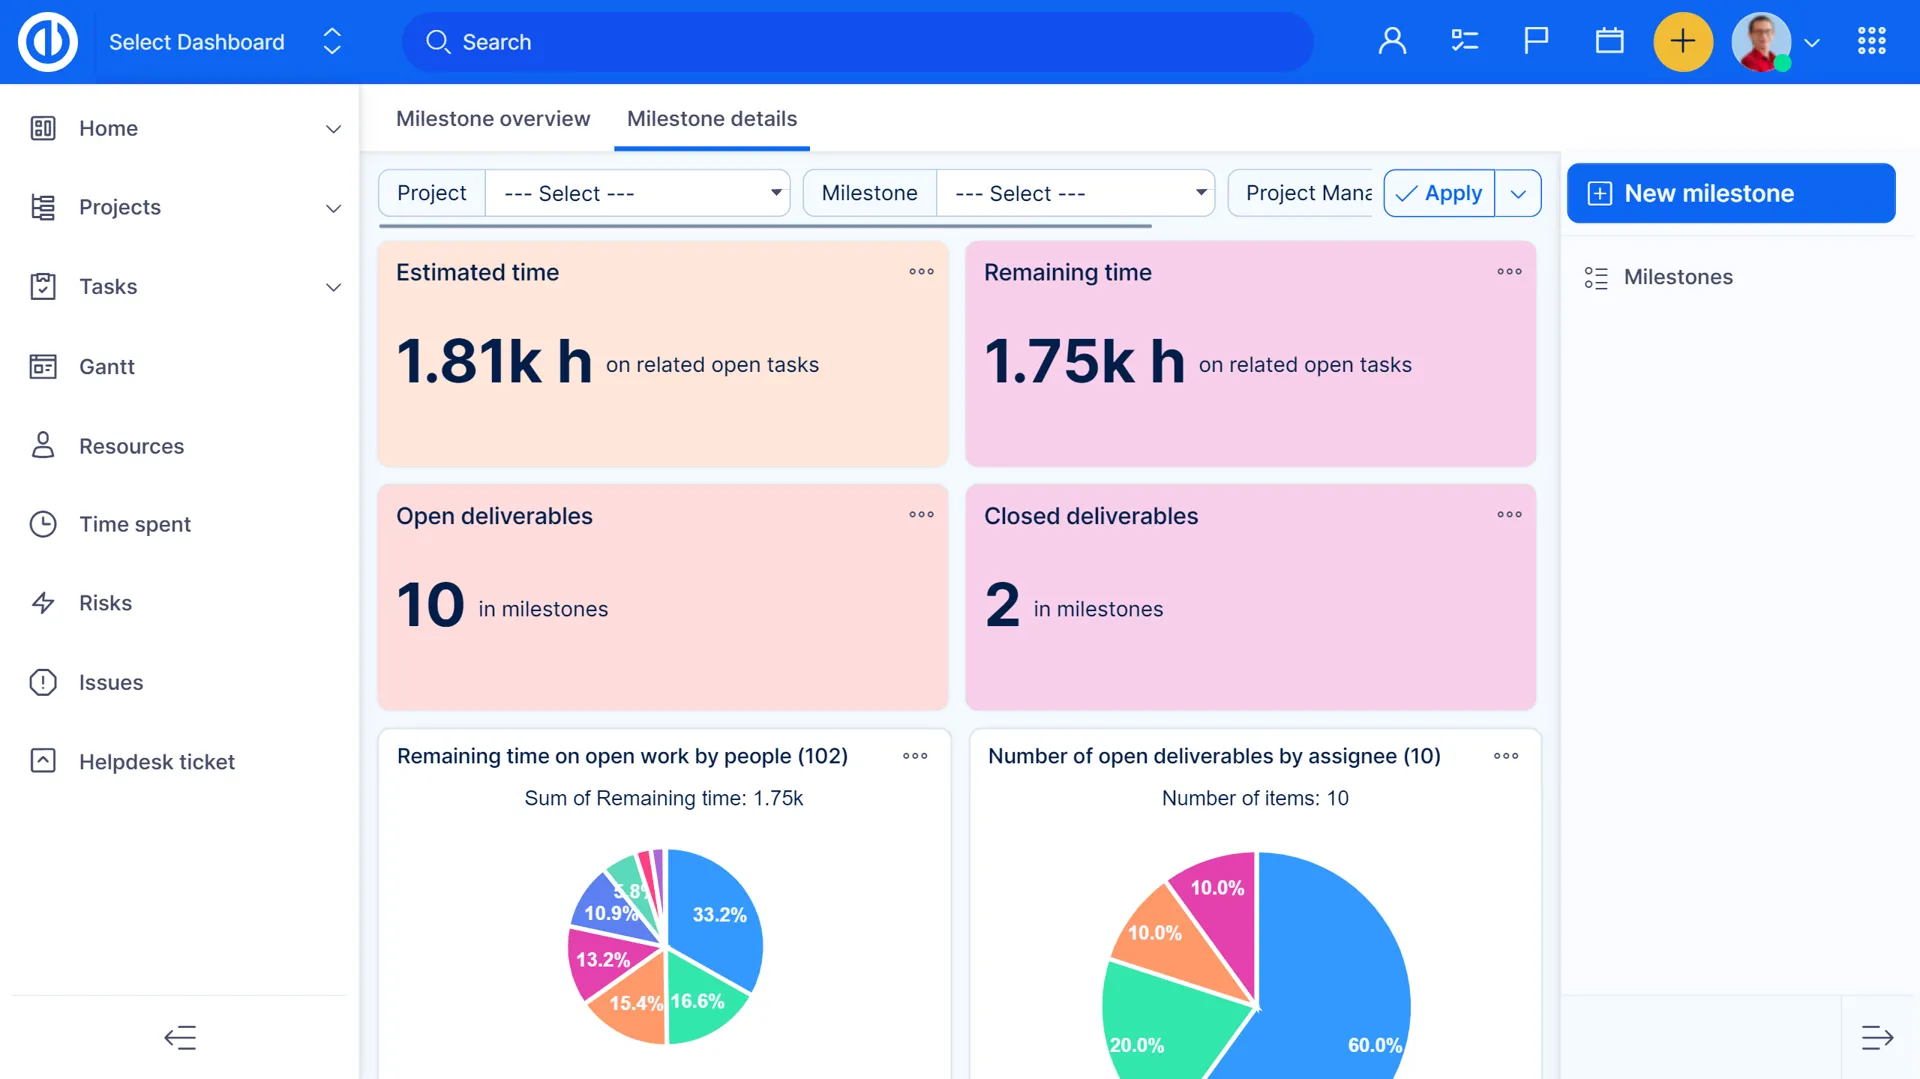
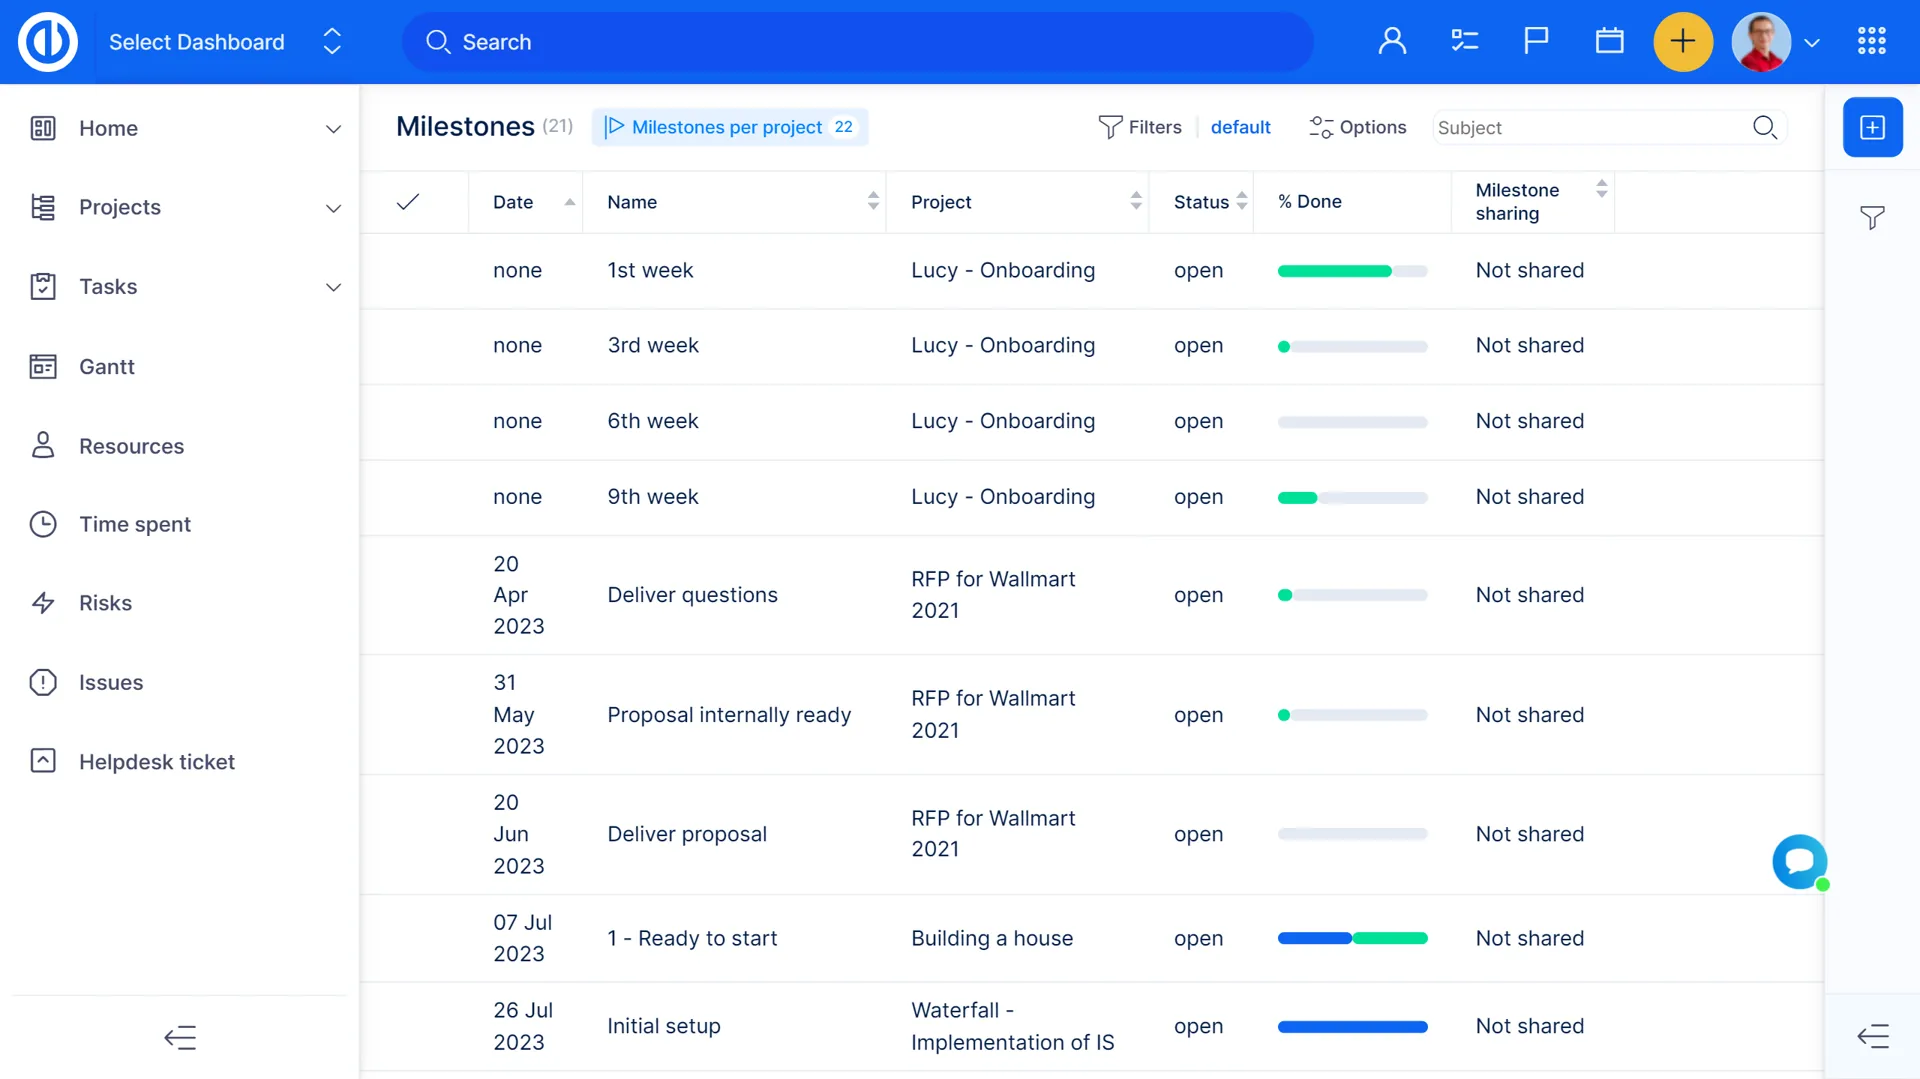
Milestone Dashboard
Track open/closed milestones by projects just like estimated and spent time for individual milestones. This dashboard helps project and portfolio managers see if progress on projects is compliant with an original project plan/schedule.
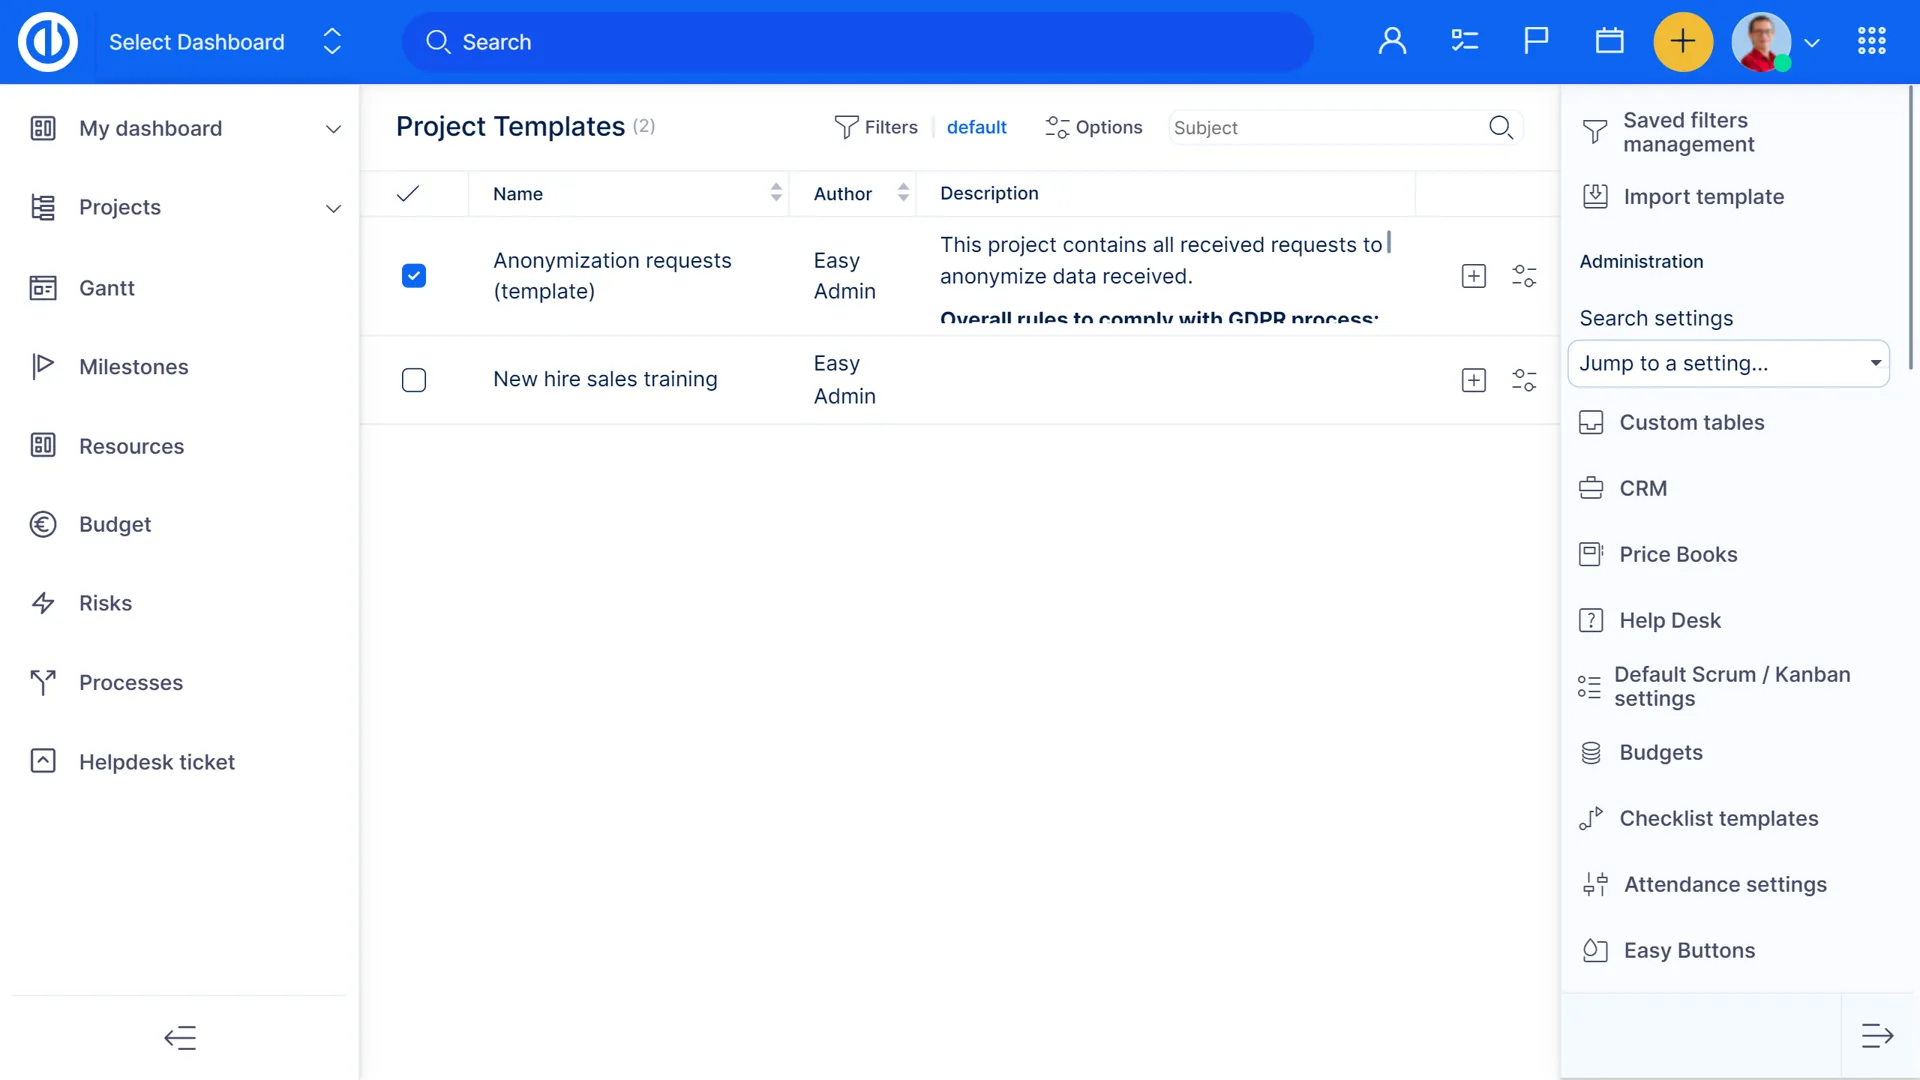
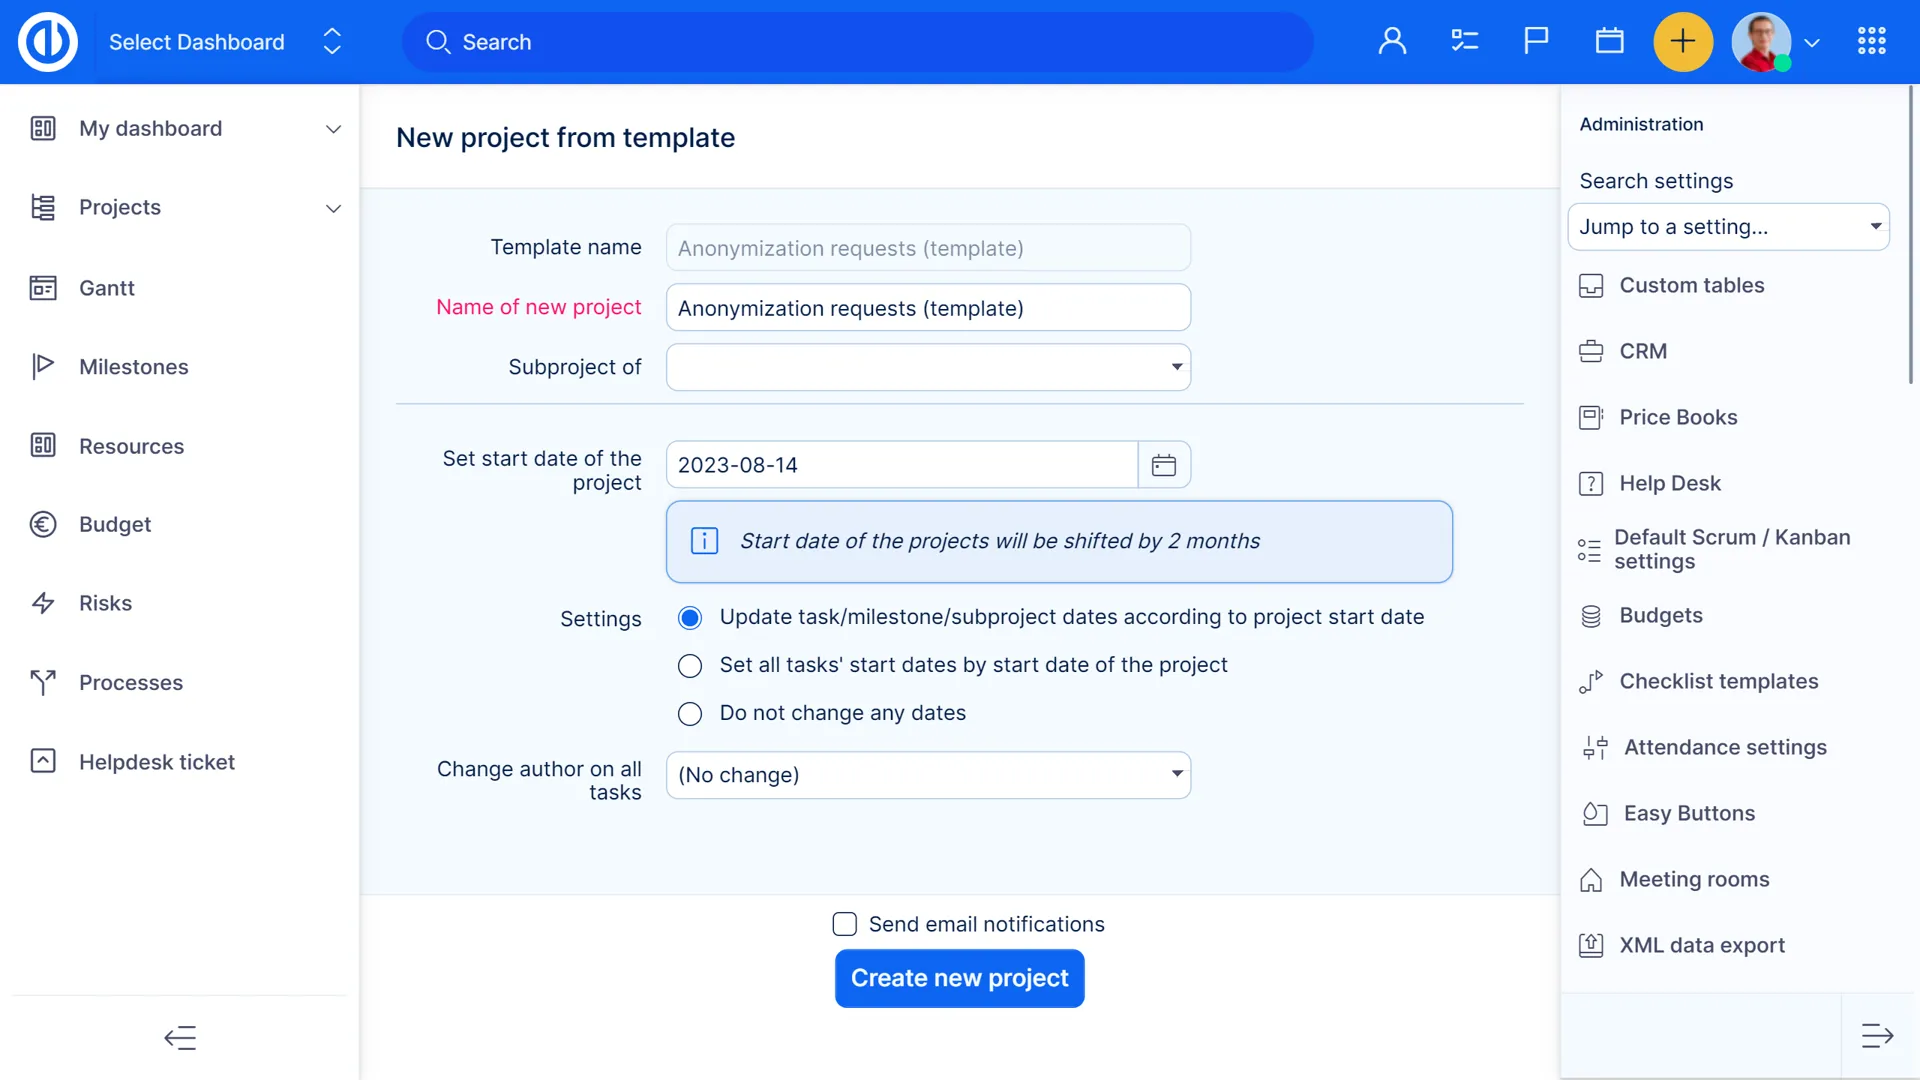
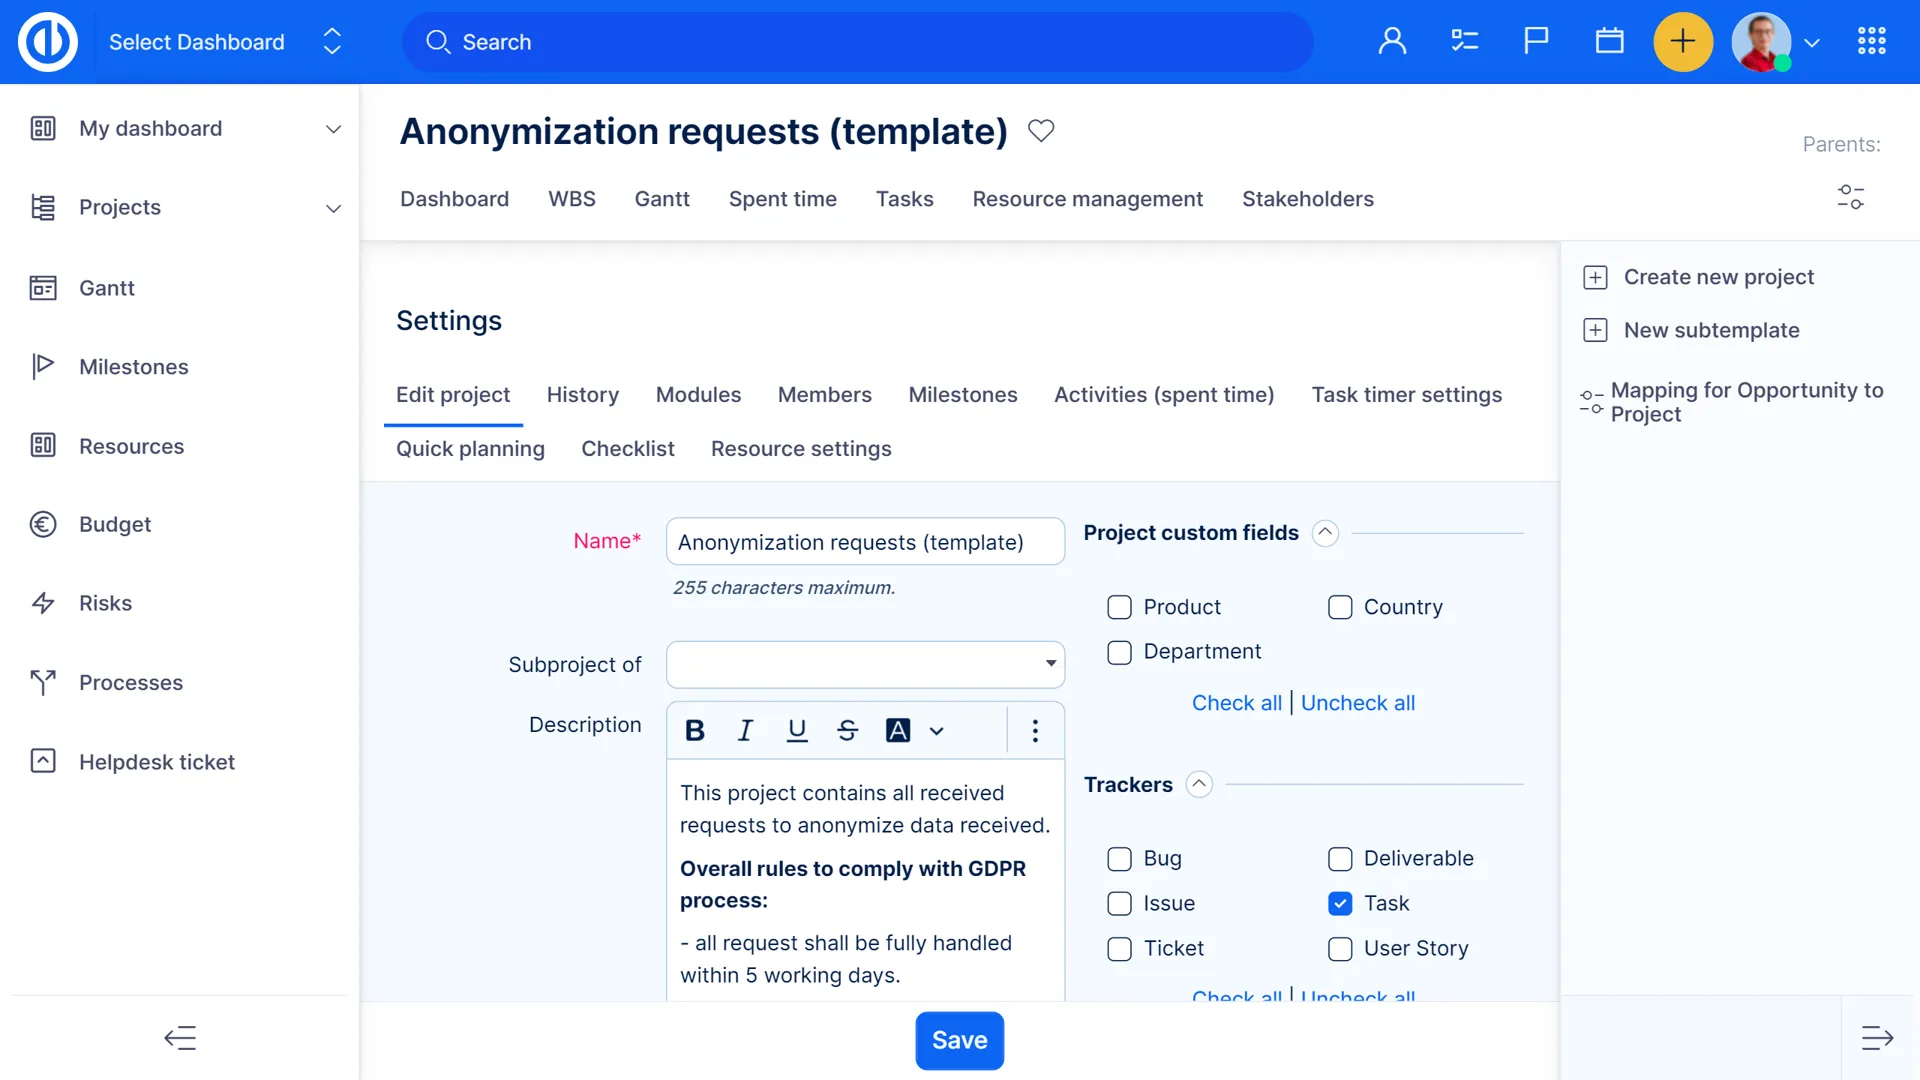
Project Templates

Production Templates
Easy Project offers you a set of professional templates that will help you to bring your project planning and execution to a whole new level. Based on best management practices and the knowledge of our experts from various industries, professional templates will save you time and provide a concrete project planning backbone.


Strategic Project Templates
Create a bridge between the ambitions of the top management and daily activities with help of Easy Strategic Projects templates. Having a concrete structure to your projects, based on the best PM practices will streamline your strategic decision making process and simplify the process of shaping strategy into projects.

Product Development Templates
We have a solution for every development model. You won't miss any crucial step in the product development process with our Development Templates and will be able to re-evaluate which module fits your company best, thanks to the various templates availability, you can try out within your Easy Project solution.


HR Project Templates
To simplify the process of creating, implementing and overseeing policies governing employee behavior and processes such as recruitment, retention, interviews, training and motivation, we provide to you HR project templates that will provide structure to your HR projects based on the best project management practices.


Back office templates
Easy Project Back office templates allow you to smoothly run your administrative tasks, define process in your company and keep control over quality.
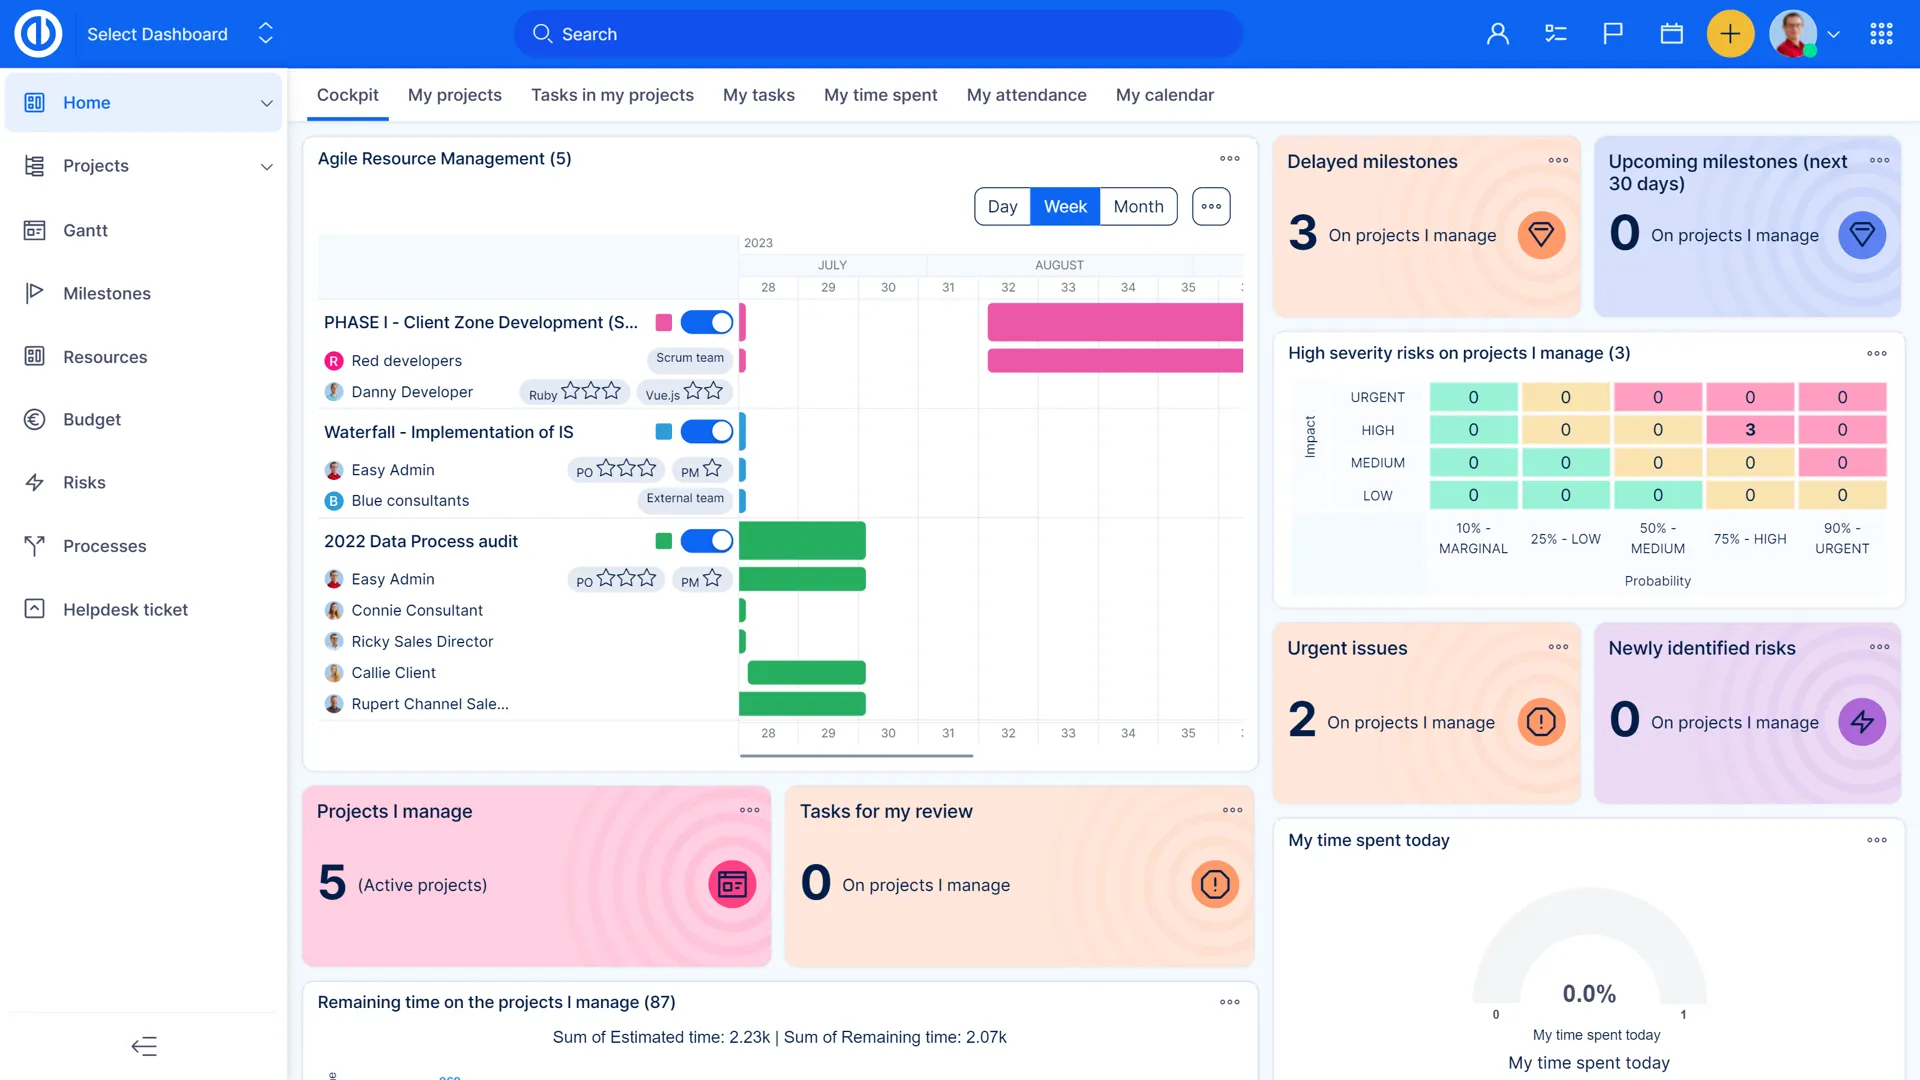
Personal Dashboards

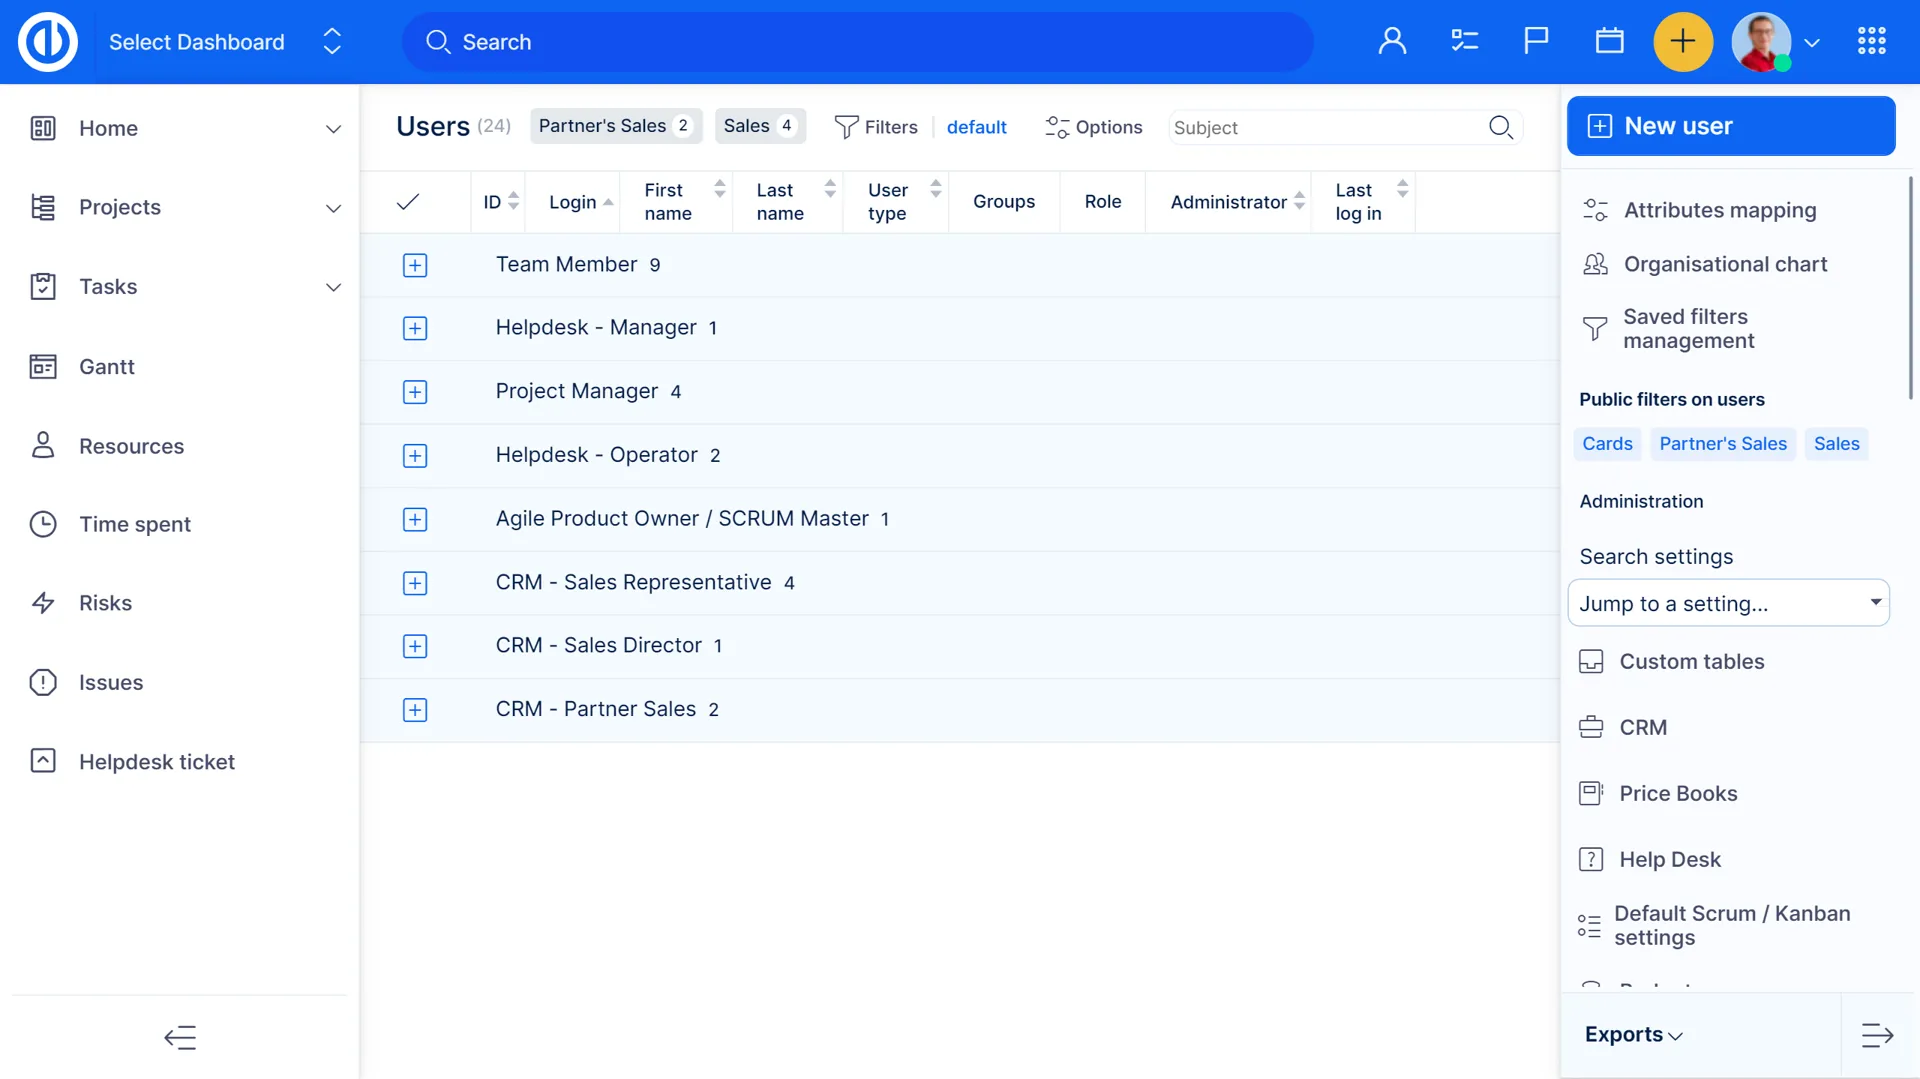
Global roles by user types
Each user type might have a predefined default role, thus eliminating the need to assign a role to newly created users of specific user types. For the sake of simplicity, default user roles are structured into 4 basic levels of common roles in an organization. When you invite new users to the system, you may assign them a specific role already before you send the invitation. For each user type, a customized personal dashboard is available for immediate use.


Project Manager Dashboard
Get a pre-set Easy Dashboard created to meet the needs of even the busiest project managers. Get an instant overview of the open & pending issues, together with a graphical illustration of the projects' statuses. Activity feed shows the latest updates and features like meetings calendar, resource management and more just one click away.


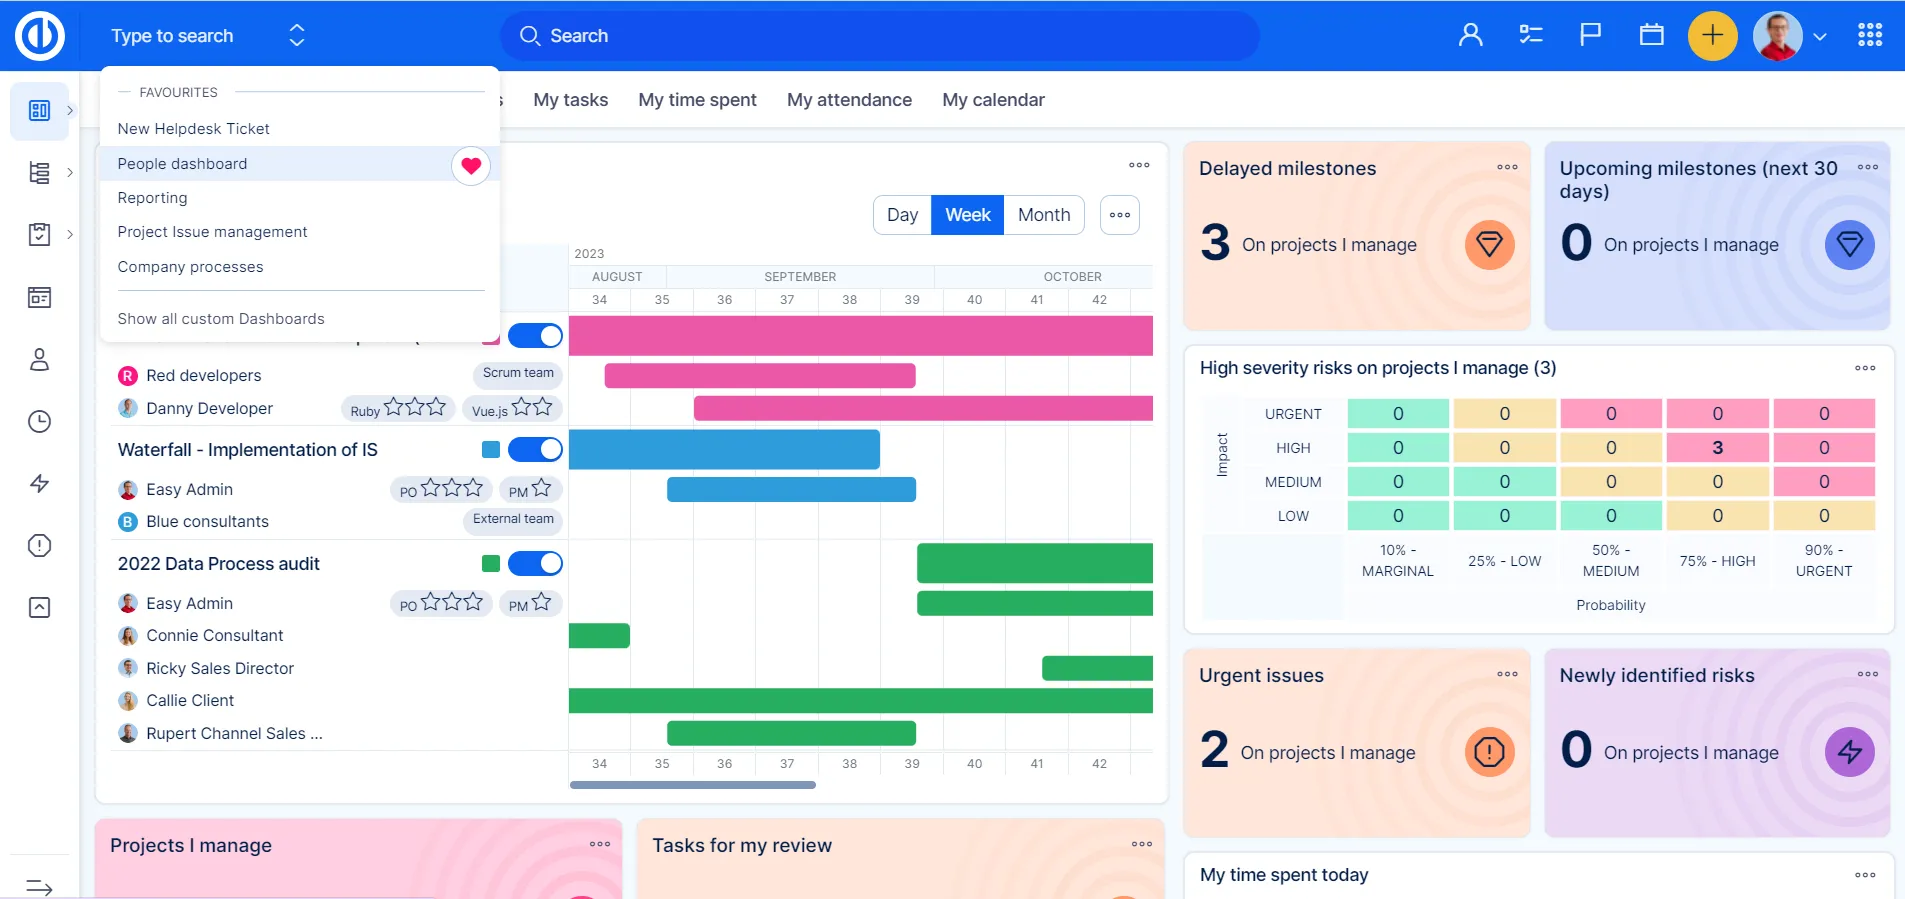
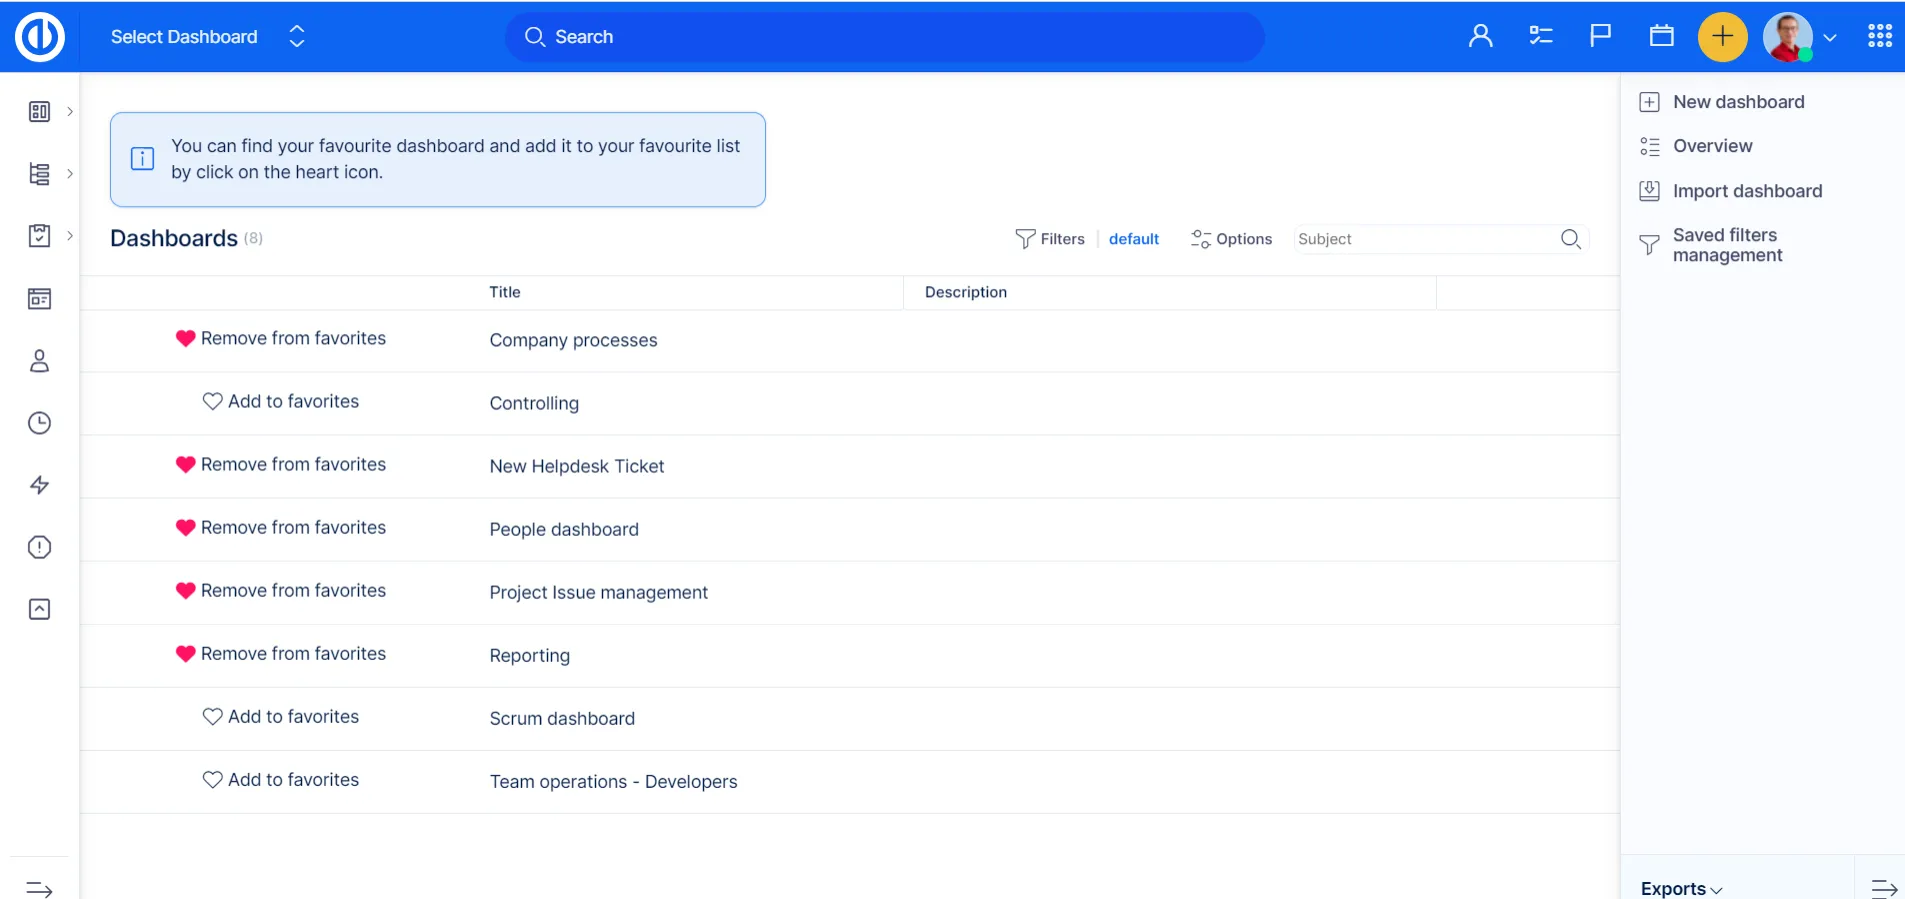
Jump to Dashboards
Access your essential dashboards with ease. Whether custom-made or from templates, quickly jump to and favourite your choices. Keep all your vital dashboards at your fingertips for seamless navigation.

Project Team Member Dashboard
Predefined personal dashboard suitable for Project team member role is designed to provide at-a-glance awareness of current performance relevant to project delivery.


Team Leader Dashboard
Predefined personal dashboard suitable for Team leader role is designed to provide at-a-glance awareness of current performance relevant to the whole team.


Portfolio Manager Dashboard
You can keep all your projects organized and accessible through Portfolio Tree with Portfolio Manager's dashboard. Activity feed and critical issues list will help you to address urgent issues, and, using additional tabs, you can manage workers' workload, current sprints, and budgets. Use Graphs & Charts to visualize any listing for overall performance.


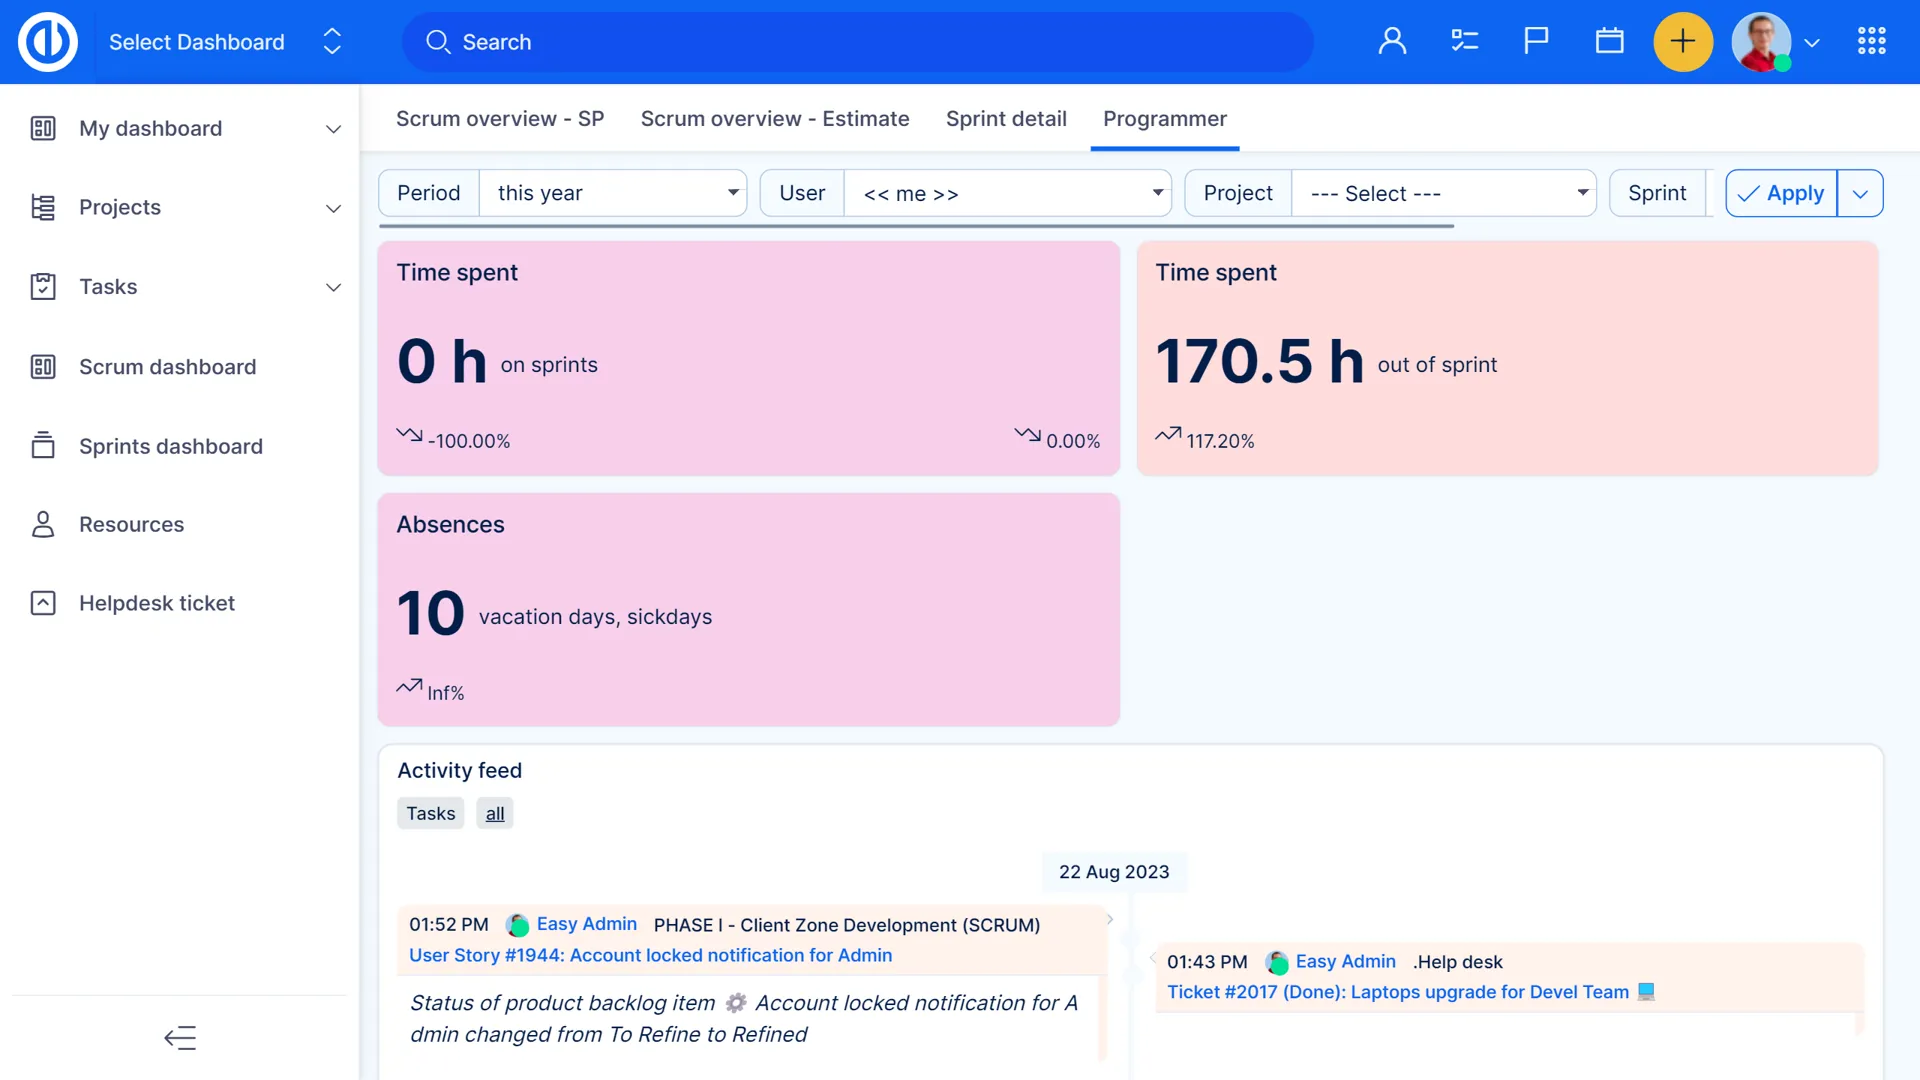
Dashboard for Product Owners and Scrum Masters
All live operations are at the Scrum Master's fingertips. Current sprint status, overall sprint completion progress, velocity by day, week or month, closed story points in time, eye-catching charts and other customizable modules and options.

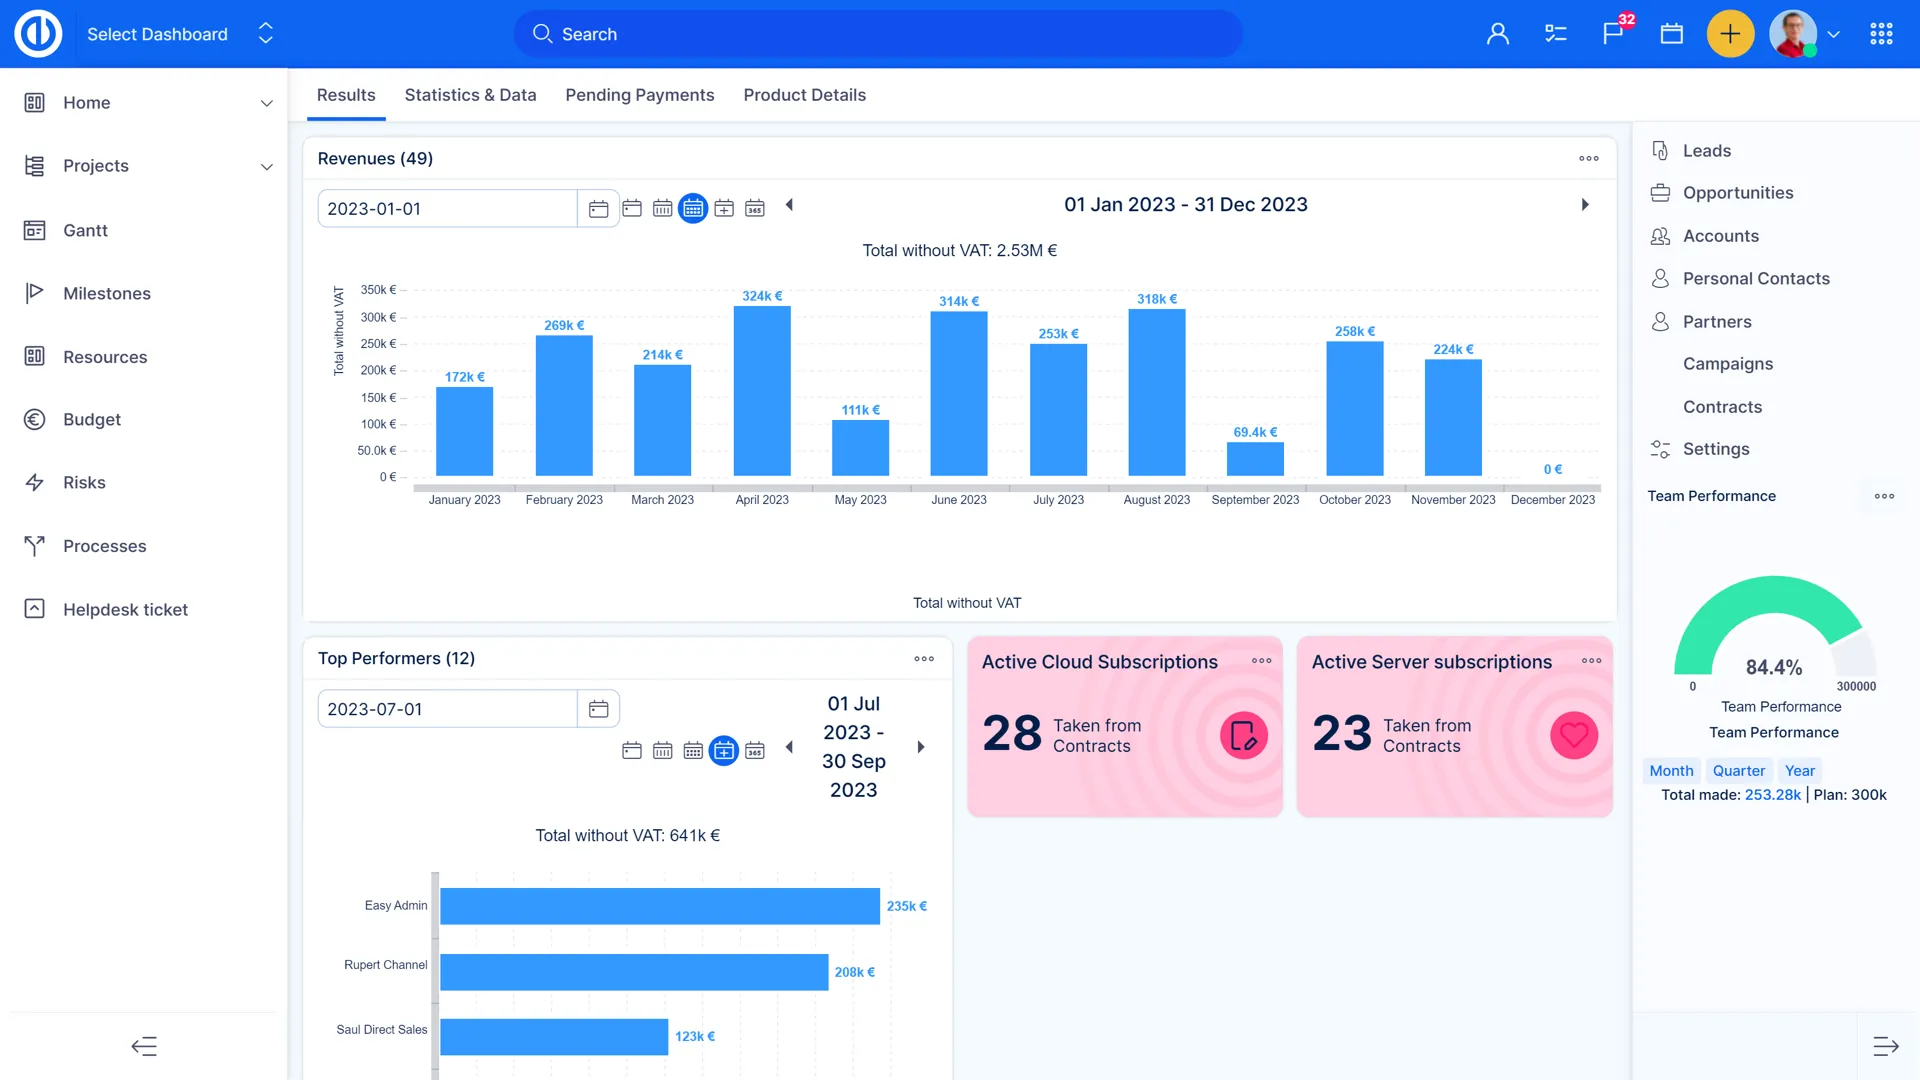
CEO Dashboard
As a CEO it is important to get a quick and complete overview of the company performance at one glance, without the need of going through endless lists of data. Easy Project allows you to transform any data into a chart to compare planned performance to actual with Gauge diagram and to quickly access additional modules like Meetings Calendar and HR dashboard.